
Key Insights
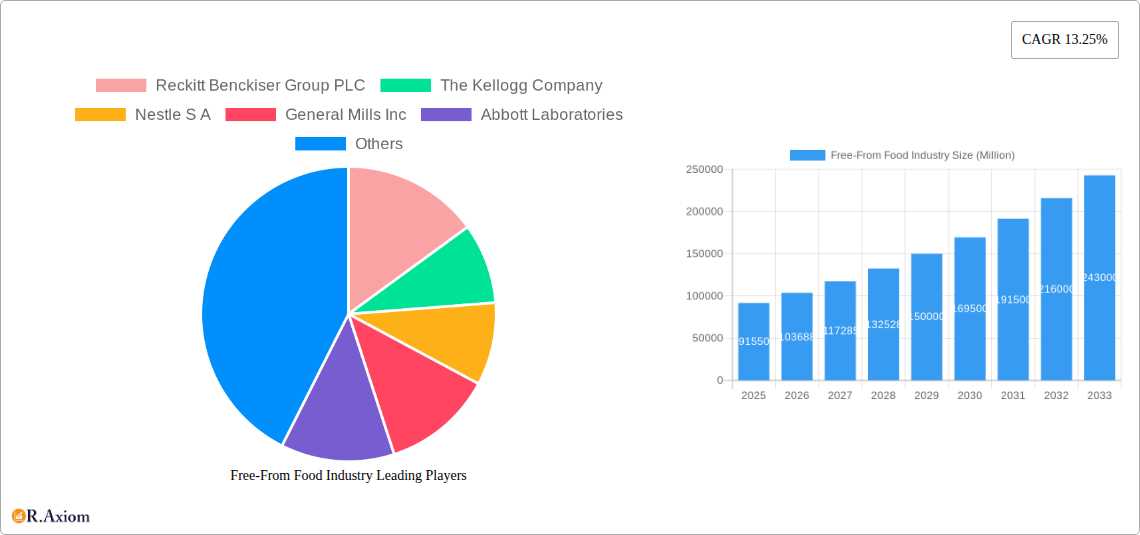
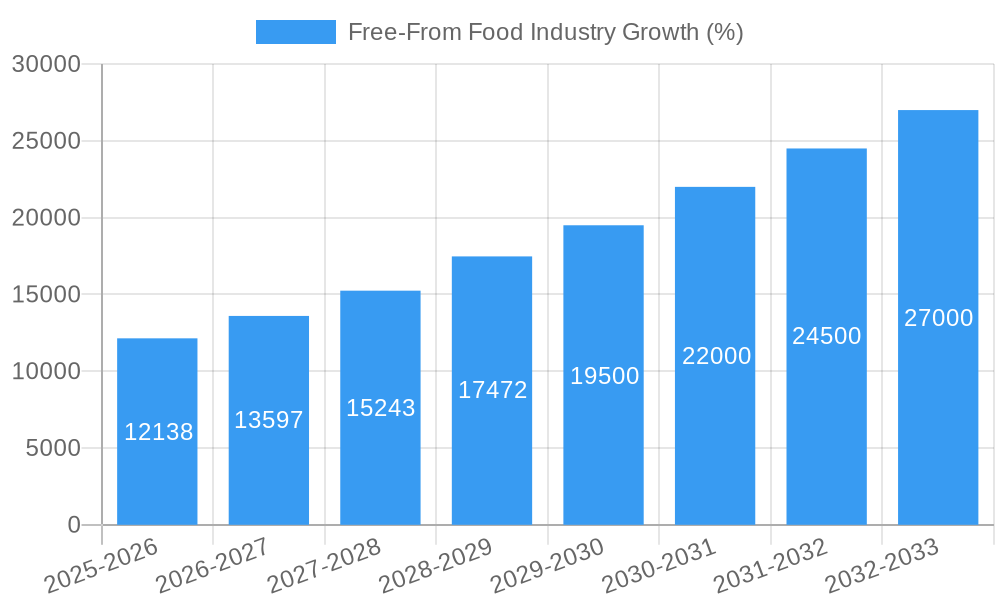
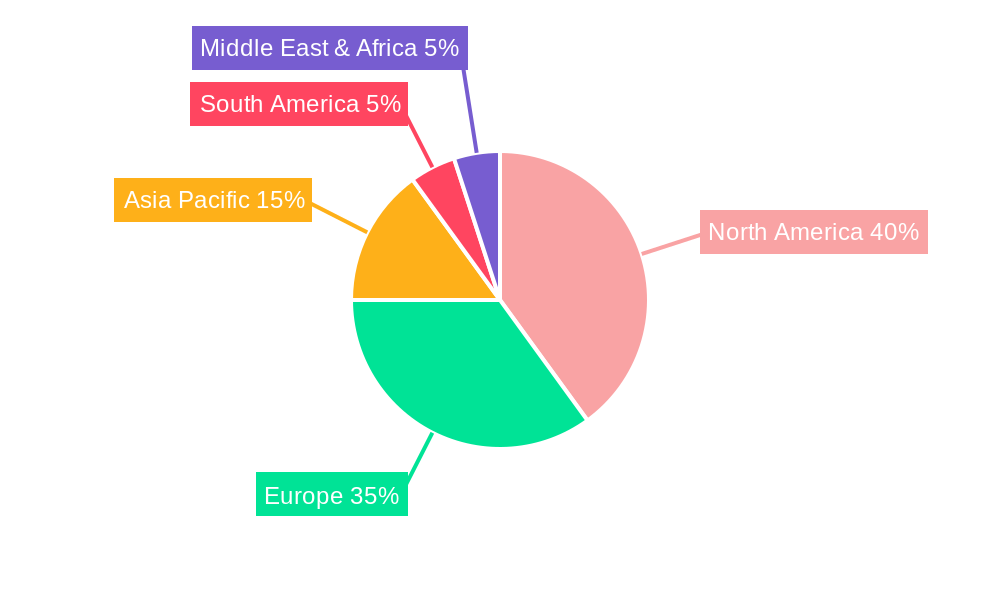
The free-from food industry, valued at $91.55 billion in 2025, is experiencing robust growth, projected to expand at a compound annual growth rate (CAGR) of 13.25% from 2025 to 2033. This surge is driven by several key factors. Increasing prevalence of food allergies and intolerances, particularly among children, fuels demand for products free from gluten, dairy, and other common allergens. Growing consumer awareness of health and wellness, coupled with a rising preference for plant-based diets and sustainable food choices, further accelerates market expansion. The rise of online retail channels significantly broadens market reach, enhancing accessibility for consumers seeking specialized free-from options. Key product segments like baby food, dairy-free foods, and meat substitutes show particularly strong growth potential, reflecting evolving dietary preferences and health concerns. Geographic expansion is also noteworthy, with North America and Europe currently dominating, but Asia-Pacific and other regions exhibiting significant growth opportunities driven by rising disposable incomes and evolving dietary habits. Competition is intense, with established players like Nestle, General Mills, and Reckitt Benckiser alongside innovative startups specializing in specific free-from categories.
However, challenges remain. The higher production costs associated with sourcing specialized ingredients and maintaining stringent quality control measures can impact profitability. Consumer perception of taste and texture in free-from products remains a barrier for some, requiring continuous product innovation to meet evolving expectations. Ensuring consistent supply chain management and meeting the demands of a rapidly expanding market will require strategic investments and efficient operational processes for industry players. The ongoing expansion into emerging markets faces regulatory hurdles and varying consumer preferences, necessitating a nuanced approach to product development and marketing in each region. Nevertheless, the long-term outlook for the free-from food industry remains positive, with continued innovation and evolving consumer preferences poised to drive substantial growth in the coming years.
This comprehensive report provides a detailed analysis of the Free-From Food industry, offering invaluable insights for businesses, investors, and stakeholders. With a study period spanning 2019-2033, a base year of 2025, and a forecast period of 2025-2033, this report covers market size, segmentation, key players, and future growth potential. The global Free-From food market is estimated to be worth xx Million in 2025, experiencing significant growth throughout the forecast period.
Free-From Food Industry Market Concentration & Innovation
The Free-From food market exhibits a moderately concentrated landscape, with several multinational corporations holding significant market share. Key players like Reckitt Benckiser Group PLC, The Kellogg Company, Nestlé S.A., General Mills Inc., and Abbott Laboratories, alongside specialized players like Dr. Schar AG/SPA and Oatly Group AB, compete intensely. Market share data for 2024 indicates that Nestlé holds approximately xx% market share, followed by Kellogg's at xx%, and General Mills at xx%. The remaining share is distributed among other players, including smaller regional and niche brands.
Innovation is a crucial driver, spurred by increasing consumer demand for healthier and more diverse options. Major trends include the development of plant-based alternatives, the expansion of gluten-free and dairy-free product lines, and the introduction of innovative formulations to improve taste and texture. Regulatory frameworks, varying across regions, play a significant role, influencing product labeling, ingredient approvals, and marketing claims. The prevalence of product substitutes, such as conventional food items, presents a constant challenge, necessitating continuous innovation. M&A activity, valued at approximately xx Million in the last five years, showcases consolidation within the industry, with larger companies acquiring smaller, innovative businesses to expand their product portfolios and geographic reach.
- Key Metrics:
- Nestlé Market Share (2024): xx%
- Kellogg's Market Share (2024): xx%
- General Mills Market Share (2024): xx%
- Total M&A Value (2019-2024): xx Million
Free-From Food Industry Industry Trends & Insights
The Free-From food market is experiencing robust growth, driven by several key factors. The increasing prevalence of food allergies and intolerances is a primary driver, expanding the target market considerably. Changing consumer preferences, including growing health consciousness, demand for convenient and ethically sourced products, and interest in plant-based diets, significantly fuel market expansion. Technological advancements in food processing and ingredient development lead to the creation of tastier, healthier, and more affordable Free-From products, thereby enhancing market penetration. The compound annual growth rate (CAGR) for the Free-From food market during the historical period (2019-2024) was estimated at xx%, and is projected to be xx% during the forecast period (2025-2033). This growth is further fueled by the increasing availability of Free-From products through diverse distribution channels, including supermarkets, online retailers, and specialized stores. However, competitive dynamics are intense, with established food companies and emerging niche brands vying for market share.
Dominant Markets & Segments in Free-From Food Industry
The North American region currently dominates the Free-From food market, driven by high consumer awareness, strong regulatory frameworks supporting product development, and a robust distribution network. Within this region, the United States holds the largest market share due to its high prevalence of food allergies, strong consumer spending power, and a well-established Free-From food industry.
- Dominant End Products: Dairy-free foods and meat substitutes represent the fastest-growing segments, followed by gluten-free products.
- Dominant Distribution Channels: Supermarkets/hypermarkets remain the primary distribution channel, though online retail stores are rapidly gaining traction.
- Dominant Types: Dairy-free and gluten-free products constitute the largest market segments due to high prevalence of related intolerances.
Key Drivers for Dominance (North America):
- High consumer awareness of food allergies and intolerances.
- Strong regulatory frameworks supporting innovation and labeling.
- Well-established distribution networks for Free-From products.
- High consumer spending power.
Other regions showing significant growth include Europe and Asia-Pacific, driven by rising health consciousness and increasing disposable incomes.
Free-From Food Industry Product Developments
Recent innovations focus on improving the taste, texture, and nutritional value of Free-From products to enhance consumer acceptance. This involves utilizing advanced ingredient technologies and processing techniques to create products comparable to conventional counterparts in terms of sensory attributes. Key technological trends include the use of novel plant-based proteins, such as pea protein and faba bean protein, and the development of innovative emulsifiers and stabilizers to achieve optimal product texture and shelf life. The market fit for these products is exceptionally strong, given the growing demand for healthier and more sustainable food options.
Report Scope & Segmentation Analysis
This report segments the Free-From food market across several key parameters:
End Product: Baby food, dairy-free foods, meat substitutes, beverages, other end products (with detailed growth projections and market size for each). Dairy-free foods are expected to maintain the highest growth rate.
Distribution Channel: Supermarkets/hypermarkets, online retail stores, convenience stores, other distribution channels. Online retail shows the fastest growth.
Type: Gluten-free, dairy-free, meat-free, other types. Dairy-free products show the strongest growth currently, but meat-free is predicted to show accelerated growth in the forecast period.
Each segment is analyzed based on its market size, growth rate, competitive dynamics, and future outlook.
Key Drivers of Free-From Food Industry Growth
The Free-From food market is propelled by rising health consciousness, increased prevalence of food allergies and intolerances, and growing demand for ethical and sustainable food options. Technological advancements leading to improved product quality and affordability further contribute to market growth. Favorable regulatory environments in several regions also support the development and marketing of Free-From products. Furthermore, the increasing adoption of plant-based diets fuels the growth of segments like dairy-free and meat-substitute products.
Challenges in the Free-From Food Industry Sector
Challenges include maintaining consistent product quality and affordability, addressing consumer perceptions related to taste and texture, and navigating complex regulatory landscapes that vary significantly across regions. Supply chain disruptions and price fluctuations for key ingredients can also impact profitability. Intense competition from both established food companies and new entrants further complicates market dynamics. The potential for reduced nutritional value in some Free-From products is also a challenge.
Emerging Opportunities in Free-From Food Industry
Emerging opportunities lie in expanding into new geographical markets, particularly in developing economies with rising middle classes and increasing health awareness. The development of novel and sustainable Free-From ingredients, along with exploring new product categories such as Free-From snacks and confectionery, presents substantial potential. Personalization and customization of Free-From products to cater to specific dietary needs will further expand market opportunities.
Leading Players in the Free-From Food Industry Market
- Reckitt Benckiser Group PLC
- The Kellogg Company
- Nestle S A
- General Mills Inc
- Abbott Laboratories
- Dr Schar AG / SPA
- Danone SA
- Blue Diamond Growers
- Beyond Meat
- Oatly Group AB
- List Not Exhaustive
Key Developments in Free-From Food Industry Industry
- November 2022: Beyond Meat launched plant-based chicken products, expanding its product portfolio and market reach.
- May 2022: Danone expanded its dairy-free portfolio with Silk Nextmilk, strengthening its position in the rapidly growing dairy-free market.
- January 2022: Mondelez International launched a vegan cream cheese alternative, demonstrating the increasing trend towards plant-based products.
Strategic Outlook for Free-From Food Industry Market
The Free-From food market is poised for continued strong growth, driven by sustained consumer demand for healthier and more diverse food options. Innovation in product development, coupled with expanding distribution channels and rising awareness of food allergies and intolerances, will be crucial for success. Companies that can effectively address consumer needs while maintaining affordability and sustainability will capture the greatest market share in the years to come. The market shows strong potential for further expansion, particularly in emerging markets and niche product categories.
Free-From Food Industry Segmentation
-
1. Type
- 1.1. Gluten-free
- 1.2. Dairy-Free
- 1.3. Meat-Free
- 1.4. Other Types
-
2. End Product
- 2.1. Baby Food
- 2.2. Dairy-free Foods
- 2.3. Meat Substitutes
- 2.4. Beverages
- 2.5. Other End Products
-
3. Distribution Channel
- 3.1. Supermarkets/Hypermarkets
- 3.2. Online Retail Stores
- 3.3. Convenience Stores
- 3.4. Other Distribution Channels
Free-From Food Industry Segmentation By Geography
-
1. North America
- 1.1. United States
- 1.2. Canada
- 1.3. Mexico
- 1.4. Rest of North America
-
2. Europe
- 2.1. United Kingdom
- 2.2. France
- 2.3. Germany
- 2.4. Italy
- 2.5. Spain
- 2.6. Russia
- 2.7. Rest of Europe
-
3. Asia Pacific
- 3.1. China
- 3.2. Japan
- 3.3. Australia
- 3.4. India
- 3.5. Rest of Asia Pacific
-
4. South America
- 4.1. Brazil
- 4.2. Argentina
- 4.3. Rest of South America
- 5. Middle East
-
6. United Arab Emirates
- 6.1. South Africa
- 6.2. Rest of Middle East
Free-From Food Industry REPORT HIGHLIGHTS
| Aspects | Details |
|---|---|
| Study Period | 2019-2033 |
| Base Year | 2024 |
| Estimated Year | 2025 |
| Forecast Period | 2025-2033 |
| Historical Period | 2019-2024 |
| Growth Rate | CAGR of 13.25% from 2019-2033 |
| Segmentation |
|
Table of Contents
- 1. Introduction
- 1.1. Research Scope
- 1.2. Market Segmentation
- 1.3. Research Methodology
- 1.4. Definitions and Assumptions
- 2. Executive Summary
- 2.1. Introduction
- 3. Market Dynamics
- 3.1. Introduction
- 3.2. Market Drivers
- 3.2.1. Increasing Health Concerns are Supporting the Market's Growth; Growing Consumer Preference for Convenience Seafood
- 3.3. Market Restrains
- 3.3.1. Rising Concern About Quality and Safety Standards of Canned Tuna
- 3.4. Market Trends
- 3.4.1. Clean Label Product Development and Associated Labeling Compliance
- 4. Market Factor Analysis
- 4.1. Porters Five Forces
- 4.2. Supply/Value Chain
- 4.3. PESTEL analysis
- 4.4. Market Entropy
- 4.5. Patent/Trademark Analysis
- 5. Global Free-From Food Industry Analysis, Insights and Forecast, 2019-2031
- 5.1. Market Analysis, Insights and Forecast - by Type
- 5.1.1. Gluten-free
- 5.1.2. Dairy-Free
- 5.1.3. Meat-Free
- 5.1.4. Other Types
- 5.2. Market Analysis, Insights and Forecast - by End Product
- 5.2.1. Baby Food
- 5.2.2. Dairy-free Foods
- 5.2.3. Meat Substitutes
- 5.2.4. Beverages
- 5.2.5. Other End Products
- 5.3. Market Analysis, Insights and Forecast - by Distribution Channel
- 5.3.1. Supermarkets/Hypermarkets
- 5.3.2. Online Retail Stores
- 5.3.3. Convenience Stores
- 5.3.4. Other Distribution Channels
- 5.4. Market Analysis, Insights and Forecast - by Region
- 5.4.1. North America
- 5.4.2. Europe
- 5.4.3. Asia Pacific
- 5.4.4. South America
- 5.4.5. Middle East
- 5.4.6. United Arab Emirates
- 5.1. Market Analysis, Insights and Forecast - by Type
- 6. North America Free-From Food Industry Analysis, Insights and Forecast, 2019-2031
- 6.1. Market Analysis, Insights and Forecast - by Type
- 6.1.1. Gluten-free
- 6.1.2. Dairy-Free
- 6.1.3. Meat-Free
- 6.1.4. Other Types
- 6.2. Market Analysis, Insights and Forecast - by End Product
- 6.2.1. Baby Food
- 6.2.2. Dairy-free Foods
- 6.2.3. Meat Substitutes
- 6.2.4. Beverages
- 6.2.5. Other End Products
- 6.3. Market Analysis, Insights and Forecast - by Distribution Channel
- 6.3.1. Supermarkets/Hypermarkets
- 6.3.2. Online Retail Stores
- 6.3.3. Convenience Stores
- 6.3.4. Other Distribution Channels
- 6.1. Market Analysis, Insights and Forecast - by Type
- 7. Europe Free-From Food Industry Analysis, Insights and Forecast, 2019-2031
- 7.1. Market Analysis, Insights and Forecast - by Type
- 7.1.1. Gluten-free
- 7.1.2. Dairy-Free
- 7.1.3. Meat-Free
- 7.1.4. Other Types
- 7.2. Market Analysis, Insights and Forecast - by End Product
- 7.2.1. Baby Food
- 7.2.2. Dairy-free Foods
- 7.2.3. Meat Substitutes
- 7.2.4. Beverages
- 7.2.5. Other End Products
- 7.3. Market Analysis, Insights and Forecast - by Distribution Channel
- 7.3.1. Supermarkets/Hypermarkets
- 7.3.2. Online Retail Stores
- 7.3.3. Convenience Stores
- 7.3.4. Other Distribution Channels
- 7.1. Market Analysis, Insights and Forecast - by Type
- 8. Asia Pacific Free-From Food Industry Analysis, Insights and Forecast, 2019-2031
- 8.1. Market Analysis, Insights and Forecast - by Type
- 8.1.1. Gluten-free
- 8.1.2. Dairy-Free
- 8.1.3. Meat-Free
- 8.1.4. Other Types
- 8.2. Market Analysis, Insights and Forecast - by End Product
- 8.2.1. Baby Food
- 8.2.2. Dairy-free Foods
- 8.2.3. Meat Substitutes
- 8.2.4. Beverages
- 8.2.5. Other End Products
- 8.3. Market Analysis, Insights and Forecast - by Distribution Channel
- 8.3.1. Supermarkets/Hypermarkets
- 8.3.2. Online Retail Stores
- 8.3.3. Convenience Stores
- 8.3.4. Other Distribution Channels
- 8.1. Market Analysis, Insights and Forecast - by Type
- 9. South America Free-From Food Industry Analysis, Insights and Forecast, 2019-2031
- 9.1. Market Analysis, Insights and Forecast - by Type
- 9.1.1. Gluten-free
- 9.1.2. Dairy-Free
- 9.1.3. Meat-Free
- 9.1.4. Other Types
- 9.2. Market Analysis, Insights and Forecast - by End Product
- 9.2.1. Baby Food
- 9.2.2. Dairy-free Foods
- 9.2.3. Meat Substitutes
- 9.2.4. Beverages
- 9.2.5. Other End Products
- 9.3. Market Analysis, Insights and Forecast - by Distribution Channel
- 9.3.1. Supermarkets/Hypermarkets
- 9.3.2. Online Retail Stores
- 9.3.3. Convenience Stores
- 9.3.4. Other Distribution Channels
- 9.1. Market Analysis, Insights and Forecast - by Type
- 10. Middle East Free-From Food Industry Analysis, Insights and Forecast, 2019-2031
- 10.1. Market Analysis, Insights and Forecast - by Type
- 10.1.1. Gluten-free
- 10.1.2. Dairy-Free
- 10.1.3. Meat-Free
- 10.1.4. Other Types
- 10.2. Market Analysis, Insights and Forecast - by End Product
- 10.2.1. Baby Food
- 10.2.2. Dairy-free Foods
- 10.2.3. Meat Substitutes
- 10.2.4. Beverages
- 10.2.5. Other End Products
- 10.3. Market Analysis, Insights and Forecast - by Distribution Channel
- 10.3.1. Supermarkets/Hypermarkets
- 10.3.2. Online Retail Stores
- 10.3.3. Convenience Stores
- 10.3.4. Other Distribution Channels
- 10.1. Market Analysis, Insights and Forecast - by Type
- 11. United Arab Emirates Free-From Food Industry Analysis, Insights and Forecast, 2019-2031
- 11.1. Market Analysis, Insights and Forecast - by Type
- 11.1.1. Gluten-free
- 11.1.2. Dairy-Free
- 11.1.3. Meat-Free
- 11.1.4. Other Types
- 11.2. Market Analysis, Insights and Forecast - by End Product
- 11.2.1. Baby Food
- 11.2.2. Dairy-free Foods
- 11.2.3. Meat Substitutes
- 11.2.4. Beverages
- 11.2.5. Other End Products
- 11.3. Market Analysis, Insights and Forecast - by Distribution Channel
- 11.3.1. Supermarkets/Hypermarkets
- 11.3.2. Online Retail Stores
- 11.3.3. Convenience Stores
- 11.3.4. Other Distribution Channels
- 11.1. Market Analysis, Insights and Forecast - by Type
- 12. North America Free-From Food Industry Analysis, Insights and Forecast, 2019-2031
- 12.1. Market Analysis, Insights and Forecast - By Country/Sub-region
- 12.1.1 United States
- 12.1.2 Canada
- 12.1.3 Mexico
- 12.1.4 Rest of North America
- 13. Europe Free-From Food Industry Analysis, Insights and Forecast, 2019-2031
- 13.1. Market Analysis, Insights and Forecast - By Country/Sub-region
- 13.1.1 United Kingdom
- 13.1.2 France
- 13.1.3 Germany
- 13.1.4 Italy
- 13.1.5 Spain
- 13.1.6 Russia
- 13.1.7 Rest of Europe
- 14. Asia Pacific Free-From Food Industry Analysis, Insights and Forecast, 2019-2031
- 14.1. Market Analysis, Insights and Forecast - By Country/Sub-region
- 14.1.1 China
- 14.1.2 Japan
- 14.1.3 Australia
- 14.1.4 India
- 14.1.5 Rest of Asia Pacific
- 15. South America Free-From Food Industry Analysis, Insights and Forecast, 2019-2031
- 15.1. Market Analysis, Insights and Forecast - By Country/Sub-region
- 15.1.1 Brazil
- 15.1.2 Argentina
- 15.1.3 Rest of South America
- 16. Middle East Free-From Food Industry Analysis, Insights and Forecast, 2019-2031
- 16.1. Market Analysis, Insights and Forecast - By Country/Sub-region
- 16.1.1.
- 17. United Arab Emirates Free-From Food Industry Analysis, Insights and Forecast, 2019-2031
- 17.1. Market Analysis, Insights and Forecast - By Country/Sub-region
- 17.1.1 South Africa
- 17.1.2 Rest of Middle East
- 18. Competitive Analysis
- 18.1. Global Market Share Analysis 2024
- 18.2. Company Profiles
- 18.2.1 Reckitt Benckiser Group PLC
- 18.2.1.1. Overview
- 18.2.1.2. Products
- 18.2.1.3. SWOT Analysis
- 18.2.1.4. Recent Developments
- 18.2.1.5. Financials (Based on Availability)
- 18.2.2 The Kellogg Company
- 18.2.2.1. Overview
- 18.2.2.2. Products
- 18.2.2.3. SWOT Analysis
- 18.2.2.4. Recent Developments
- 18.2.2.5. Financials (Based on Availability)
- 18.2.3 Nestle S A
- 18.2.3.1. Overview
- 18.2.3.2. Products
- 18.2.3.3. SWOT Analysis
- 18.2.3.4. Recent Developments
- 18.2.3.5. Financials (Based on Availability)
- 18.2.4 General Mills Inc
- 18.2.4.1. Overview
- 18.2.4.2. Products
- 18.2.4.3. SWOT Analysis
- 18.2.4.4. Recent Developments
- 18.2.4.5. Financials (Based on Availability)
- 18.2.5 Abbott Laboratories
- 18.2.5.1. Overview
- 18.2.5.2. Products
- 18.2.5.3. SWOT Analysis
- 18.2.5.4. Recent Developments
- 18.2.5.5. Financials (Based on Availability)
- 18.2.6 Dr Schar AG / SPA
- 18.2.6.1. Overview
- 18.2.6.2. Products
- 18.2.6.3. SWOT Analysis
- 18.2.6.4. Recent Developments
- 18.2.6.5. Financials (Based on Availability)
- 18.2.7 Danone SA
- 18.2.7.1. Overview
- 18.2.7.2. Products
- 18.2.7.3. SWOT Analysis
- 18.2.7.4. Recent Developments
- 18.2.7.5. Financials (Based on Availability)
- 18.2.8 Blue Diamond Growers
- 18.2.8.1. Overview
- 18.2.8.2. Products
- 18.2.8.3. SWOT Analysis
- 18.2.8.4. Recent Developments
- 18.2.8.5. Financials (Based on Availability)
- 18.2.9 Beyond Meat
- 18.2.9.1. Overview
- 18.2.9.2. Products
- 18.2.9.3. SWOT Analysis
- 18.2.9.4. Recent Developments
- 18.2.9.5. Financials (Based on Availability)
- 18.2.10 Oatly Group AB*List Not Exhaustive
- 18.2.10.1. Overview
- 18.2.10.2. Products
- 18.2.10.3. SWOT Analysis
- 18.2.10.4. Recent Developments
- 18.2.10.5. Financials (Based on Availability)
- 18.2.1 Reckitt Benckiser Group PLC
List of Figures
- Figure 1: Global Free-From Food Industry Revenue Breakdown (Million, %) by Region 2024 & 2032
- Figure 2: North America Free-From Food Industry Revenue (Million), by Country 2024 & 2032
- Figure 3: North America Free-From Food Industry Revenue Share (%), by Country 2024 & 2032
- Figure 4: Europe Free-From Food Industry Revenue (Million), by Country 2024 & 2032
- Figure 5: Europe Free-From Food Industry Revenue Share (%), by Country 2024 & 2032
- Figure 6: Asia Pacific Free-From Food Industry Revenue (Million), by Country 2024 & 2032
- Figure 7: Asia Pacific Free-From Food Industry Revenue Share (%), by Country 2024 & 2032
- Figure 8: South America Free-From Food Industry Revenue (Million), by Country 2024 & 2032
- Figure 9: South America Free-From Food Industry Revenue Share (%), by Country 2024 & 2032
- Figure 10: Middle East Free-From Food Industry Revenue (Million), by Country 2024 & 2032
- Figure 11: Middle East Free-From Food Industry Revenue Share (%), by Country 2024 & 2032
- Figure 12: United Arab Emirates Free-From Food Industry Revenue (Million), by Country 2024 & 2032
- Figure 13: United Arab Emirates Free-From Food Industry Revenue Share (%), by Country 2024 & 2032
- Figure 14: North America Free-From Food Industry Revenue (Million), by Type 2024 & 2032
- Figure 15: North America Free-From Food Industry Revenue Share (%), by Type 2024 & 2032
- Figure 16: North America Free-From Food Industry Revenue (Million), by End Product 2024 & 2032
- Figure 17: North America Free-From Food Industry Revenue Share (%), by End Product 2024 & 2032
- Figure 18: North America Free-From Food Industry Revenue (Million), by Distribution Channel 2024 & 2032
- Figure 19: North America Free-From Food Industry Revenue Share (%), by Distribution Channel 2024 & 2032
- Figure 20: North America Free-From Food Industry Revenue (Million), by Country 2024 & 2032
- Figure 21: North America Free-From Food Industry Revenue Share (%), by Country 2024 & 2032
- Figure 22: Europe Free-From Food Industry Revenue (Million), by Type 2024 & 2032
- Figure 23: Europe Free-From Food Industry Revenue Share (%), by Type 2024 & 2032
- Figure 24: Europe Free-From Food Industry Revenue (Million), by End Product 2024 & 2032
- Figure 25: Europe Free-From Food Industry Revenue Share (%), by End Product 2024 & 2032
- Figure 26: Europe Free-From Food Industry Revenue (Million), by Distribution Channel 2024 & 2032
- Figure 27: Europe Free-From Food Industry Revenue Share (%), by Distribution Channel 2024 & 2032
- Figure 28: Europe Free-From Food Industry Revenue (Million), by Country 2024 & 2032
- Figure 29: Europe Free-From Food Industry Revenue Share (%), by Country 2024 & 2032
- Figure 30: Asia Pacific Free-From Food Industry Revenue (Million), by Type 2024 & 2032
- Figure 31: Asia Pacific Free-From Food Industry Revenue Share (%), by Type 2024 & 2032
- Figure 32: Asia Pacific Free-From Food Industry Revenue (Million), by End Product 2024 & 2032
- Figure 33: Asia Pacific Free-From Food Industry Revenue Share (%), by End Product 2024 & 2032
- Figure 34: Asia Pacific Free-From Food Industry Revenue (Million), by Distribution Channel 2024 & 2032
- Figure 35: Asia Pacific Free-From Food Industry Revenue Share (%), by Distribution Channel 2024 & 2032
- Figure 36: Asia Pacific Free-From Food Industry Revenue (Million), by Country 2024 & 2032
- Figure 37: Asia Pacific Free-From Food Industry Revenue Share (%), by Country 2024 & 2032
- Figure 38: South America Free-From Food Industry Revenue (Million), by Type 2024 & 2032
- Figure 39: South America Free-From Food Industry Revenue Share (%), by Type 2024 & 2032
- Figure 40: South America Free-From Food Industry Revenue (Million), by End Product 2024 & 2032
- Figure 41: South America Free-From Food Industry Revenue Share (%), by End Product 2024 & 2032
- Figure 42: South America Free-From Food Industry Revenue (Million), by Distribution Channel 2024 & 2032
- Figure 43: South America Free-From Food Industry Revenue Share (%), by Distribution Channel 2024 & 2032
- Figure 44: South America Free-From Food Industry Revenue (Million), by Country 2024 & 2032
- Figure 45: South America Free-From Food Industry Revenue Share (%), by Country 2024 & 2032
- Figure 46: Middle East Free-From Food Industry Revenue (Million), by Type 2024 & 2032
- Figure 47: Middle East Free-From Food Industry Revenue Share (%), by Type 2024 & 2032
- Figure 48: Middle East Free-From Food Industry Revenue (Million), by End Product 2024 & 2032
- Figure 49: Middle East Free-From Food Industry Revenue Share (%), by End Product 2024 & 2032
- Figure 50: Middle East Free-From Food Industry Revenue (Million), by Distribution Channel 2024 & 2032
- Figure 51: Middle East Free-From Food Industry Revenue Share (%), by Distribution Channel 2024 & 2032
- Figure 52: Middle East Free-From Food Industry Revenue (Million), by Country 2024 & 2032
- Figure 53: Middle East Free-From Food Industry Revenue Share (%), by Country 2024 & 2032
- Figure 54: United Arab Emirates Free-From Food Industry Revenue (Million), by Type 2024 & 2032
- Figure 55: United Arab Emirates Free-From Food Industry Revenue Share (%), by Type 2024 & 2032
- Figure 56: United Arab Emirates Free-From Food Industry Revenue (Million), by End Product 2024 & 2032
- Figure 57: United Arab Emirates Free-From Food Industry Revenue Share (%), by End Product 2024 & 2032
- Figure 58: United Arab Emirates Free-From Food Industry Revenue (Million), by Distribution Channel 2024 & 2032
- Figure 59: United Arab Emirates Free-From Food Industry Revenue Share (%), by Distribution Channel 2024 & 2032
- Figure 60: United Arab Emirates Free-From Food Industry Revenue (Million), by Country 2024 & 2032
- Figure 61: United Arab Emirates Free-From Food Industry Revenue Share (%), by Country 2024 & 2032
List of Tables
- Table 1: Global Free-From Food Industry Revenue Million Forecast, by Region 2019 & 2032
- Table 2: Global Free-From Food Industry Revenue Million Forecast, by Type 2019 & 2032
- Table 3: Global Free-From Food Industry Revenue Million Forecast, by End Product 2019 & 2032
- Table 4: Global Free-From Food Industry Revenue Million Forecast, by Distribution Channel 2019 & 2032
- Table 5: Global Free-From Food Industry Revenue Million Forecast, by Region 2019 & 2032
- Table 6: Global Free-From Food Industry Revenue Million Forecast, by Country 2019 & 2032
- Table 7: United States Free-From Food Industry Revenue (Million) Forecast, by Application 2019 & 2032
- Table 8: Canada Free-From Food Industry Revenue (Million) Forecast, by Application 2019 & 2032
- Table 9: Mexico Free-From Food Industry Revenue (Million) Forecast, by Application 2019 & 2032
- Table 10: Rest of North America Free-From Food Industry Revenue (Million) Forecast, by Application 2019 & 2032
- Table 11: Global Free-From Food Industry Revenue Million Forecast, by Country 2019 & 2032
- Table 12: United Kingdom Free-From Food Industry Revenue (Million) Forecast, by Application 2019 & 2032
- Table 13: France Free-From Food Industry Revenue (Million) Forecast, by Application 2019 & 2032
- Table 14: Germany Free-From Food Industry Revenue (Million) Forecast, by Application 2019 & 2032
- Table 15: Italy Free-From Food Industry Revenue (Million) Forecast, by Application 2019 & 2032
- Table 16: Spain Free-From Food Industry Revenue (Million) Forecast, by Application 2019 & 2032
- Table 17: Russia Free-From Food Industry Revenue (Million) Forecast, by Application 2019 & 2032
- Table 18: Rest of Europe Free-From Food Industry Revenue (Million) Forecast, by Application 2019 & 2032
- Table 19: Global Free-From Food Industry Revenue Million Forecast, by Country 2019 & 2032
- Table 20: China Free-From Food Industry Revenue (Million) Forecast, by Application 2019 & 2032
- Table 21: Japan Free-From Food Industry Revenue (Million) Forecast, by Application 2019 & 2032
- Table 22: Australia Free-From Food Industry Revenue (Million) Forecast, by Application 2019 & 2032
- Table 23: India Free-From Food Industry Revenue (Million) Forecast, by Application 2019 & 2032
- Table 24: Rest of Asia Pacific Free-From Food Industry Revenue (Million) Forecast, by Application 2019 & 2032
- Table 25: Global Free-From Food Industry Revenue Million Forecast, by Country 2019 & 2032
- Table 26: Brazil Free-From Food Industry Revenue (Million) Forecast, by Application 2019 & 2032
- Table 27: Argentina Free-From Food Industry Revenue (Million) Forecast, by Application 2019 & 2032
- Table 28: Rest of South America Free-From Food Industry Revenue (Million) Forecast, by Application 2019 & 2032
- Table 29: Global Free-From Food Industry Revenue Million Forecast, by Country 2019 & 2032
- Table 30: Free-From Food Industry Revenue (Million) Forecast, by Application 2019 & 2032
- Table 31: Global Free-From Food Industry Revenue Million Forecast, by Country 2019 & 2032
- Table 32: South Africa Free-From Food Industry Revenue (Million) Forecast, by Application 2019 & 2032
- Table 33: Rest of Middle East Free-From Food Industry Revenue (Million) Forecast, by Application 2019 & 2032
- Table 34: Global Free-From Food Industry Revenue Million Forecast, by Type 2019 & 2032
- Table 35: Global Free-From Food Industry Revenue Million Forecast, by End Product 2019 & 2032
- Table 36: Global Free-From Food Industry Revenue Million Forecast, by Distribution Channel 2019 & 2032
- Table 37: Global Free-From Food Industry Revenue Million Forecast, by Country 2019 & 2032
- Table 38: United States Free-From Food Industry Revenue (Million) Forecast, by Application 2019 & 2032
- Table 39: Canada Free-From Food Industry Revenue (Million) Forecast, by Application 2019 & 2032
- Table 40: Mexico Free-From Food Industry Revenue (Million) Forecast, by Application 2019 & 2032
- Table 41: Rest of North America Free-From Food Industry Revenue (Million) Forecast, by Application 2019 & 2032
- Table 42: Global Free-From Food Industry Revenue Million Forecast, by Type 2019 & 2032
- Table 43: Global Free-From Food Industry Revenue Million Forecast, by End Product 2019 & 2032
- Table 44: Global Free-From Food Industry Revenue Million Forecast, by Distribution Channel 2019 & 2032
- Table 45: Global Free-From Food Industry Revenue Million Forecast, by Country 2019 & 2032
- Table 46: United Kingdom Free-From Food Industry Revenue (Million) Forecast, by Application 2019 & 2032
- Table 47: France Free-From Food Industry Revenue (Million) Forecast, by Application 2019 & 2032
- Table 48: Germany Free-From Food Industry Revenue (Million) Forecast, by Application 2019 & 2032
- Table 49: Italy Free-From Food Industry Revenue (Million) Forecast, by Application 2019 & 2032
- Table 50: Spain Free-From Food Industry Revenue (Million) Forecast, by Application 2019 & 2032
- Table 51: Russia Free-From Food Industry Revenue (Million) Forecast, by Application 2019 & 2032
- Table 52: Rest of Europe Free-From Food Industry Revenue (Million) Forecast, by Application 2019 & 2032
- Table 53: Global Free-From Food Industry Revenue Million Forecast, by Type 2019 & 2032
- Table 54: Global Free-From Food Industry Revenue Million Forecast, by End Product 2019 & 2032
- Table 55: Global Free-From Food Industry Revenue Million Forecast, by Distribution Channel 2019 & 2032
- Table 56: Global Free-From Food Industry Revenue Million Forecast, by Country 2019 & 2032
- Table 57: China Free-From Food Industry Revenue (Million) Forecast, by Application 2019 & 2032
- Table 58: Japan Free-From Food Industry Revenue (Million) Forecast, by Application 2019 & 2032
- Table 59: Australia Free-From Food Industry Revenue (Million) Forecast, by Application 2019 & 2032
- Table 60: India Free-From Food Industry Revenue (Million) Forecast, by Application 2019 & 2032
- Table 61: Rest of Asia Pacific Free-From Food Industry Revenue (Million) Forecast, by Application 2019 & 2032
- Table 62: Global Free-From Food Industry Revenue Million Forecast, by Type 2019 & 2032
- Table 63: Global Free-From Food Industry Revenue Million Forecast, by End Product 2019 & 2032
- Table 64: Global Free-From Food Industry Revenue Million Forecast, by Distribution Channel 2019 & 2032
- Table 65: Global Free-From Food Industry Revenue Million Forecast, by Country 2019 & 2032
- Table 66: Brazil Free-From Food Industry Revenue (Million) Forecast, by Application 2019 & 2032
- Table 67: Argentina Free-From Food Industry Revenue (Million) Forecast, by Application 2019 & 2032
- Table 68: Rest of South America Free-From Food Industry Revenue (Million) Forecast, by Application 2019 & 2032
- Table 69: Global Free-From Food Industry Revenue Million Forecast, by Type 2019 & 2032
- Table 70: Global Free-From Food Industry Revenue Million Forecast, by End Product 2019 & 2032
- Table 71: Global Free-From Food Industry Revenue Million Forecast, by Distribution Channel 2019 & 2032
- Table 72: Global Free-From Food Industry Revenue Million Forecast, by Country 2019 & 2032
- Table 73: Global Free-From Food Industry Revenue Million Forecast, by Type 2019 & 2032
- Table 74: Global Free-From Food Industry Revenue Million Forecast, by End Product 2019 & 2032
- Table 75: Global Free-From Food Industry Revenue Million Forecast, by Distribution Channel 2019 & 2032
- Table 76: Global Free-From Food Industry Revenue Million Forecast, by Country 2019 & 2032
- Table 77: South Africa Free-From Food Industry Revenue (Million) Forecast, by Application 2019 & 2032
- Table 78: Rest of Middle East Free-From Food Industry Revenue (Million) Forecast, by Application 2019 & 2032
Frequently Asked Questions
1. What is the projected Compound Annual Growth Rate (CAGR) of the Free-From Food Industry?
The projected CAGR is approximately 13.25%.
2. Which companies are prominent players in the Free-From Food Industry?
Key companies in the market include Reckitt Benckiser Group PLC, The Kellogg Company, Nestle S A, General Mills Inc, Abbott Laboratories, Dr Schar AG / SPA, Danone SA, Blue Diamond Growers, Beyond Meat, Oatly Group AB*List Not Exhaustive.
3. What are the main segments of the Free-From Food Industry?
The market segments include Type, End Product, Distribution Channel.
4. Can you provide details about the market size?
The market size is estimated to be USD 91.55 Million as of 2022.
5. What are some drivers contributing to market growth?
Increasing Health Concerns are Supporting the Market's Growth; Growing Consumer Preference for Convenience Seafood.
6. What are the notable trends driving market growth?
Clean Label Product Development and Associated Labeling Compliance.
7. Are there any restraints impacting market growth?
Rising Concern About Quality and Safety Standards of Canned Tuna.
8. Can you provide examples of recent developments in the market?
November 2022: Beyond Meat launched plant-based chicken products, including Beyond Chicken Nuggets and Beyond Popcorn Chicken. The company claims that the product contains 14 g of plant-based protein derived from a blend of pea and faba beans, 0% cholesterol, 50% less saturated fat, and no added soy, hormones, or antibiotics. The product was made available at more than 5,000 Kroger and Walmart stores in the United States.
9. What pricing options are available for accessing the report?
Pricing options include single-user, multi-user, and enterprise licenses priced at USD 4750, USD 5250, and USD 8750 respectively.
10. Is the market size provided in terms of value or volume?
The market size is provided in terms of value, measured in Million.
11. Are there any specific market keywords associated with the report?
Yes, the market keyword associated with the report is "Free-From Food Industry," which aids in identifying and referencing the specific market segment covered.
12. How do I determine which pricing option suits my needs best?
The pricing options vary based on user requirements and access needs. Individual users may opt for single-user licenses, while businesses requiring broader access may choose multi-user or enterprise licenses for cost-effective access to the report.
13. Are there any additional resources or data provided in the Free-From Food Industry report?
While the report offers comprehensive insights, it's advisable to review the specific contents or supplementary materials provided to ascertain if additional resources or data are available.
14. How can I stay updated on further developments or reports in the Free-From Food Industry?
To stay informed about further developments, trends, and reports in the Free-From Food Industry, consider subscribing to industry newsletters, following relevant companies and organizations, or regularly checking reputable industry news sources and publications.
Methodology
Step 1 - Identification of Relevant Samples Size from Population Database


Step 2 - Approaches for Defining Global Market Size (Value, Volume* & Price*)

Note*: In applicable scenarios
Step 3 - Data Sources
Primary Research
- Web Analytics
- Survey Reports
- Research Institute
- Latest Research Reports
- Opinion Leaders
Secondary Research
- Annual Reports
- White Paper
- Latest Press Release
- Industry Association
- Paid Database
- Investor Presentations

Step 4 - Data Triangulation
Involves using different sources of information in order to increase the validity of a study
These sources are likely to be stakeholders in a program - participants, other researchers, program staff, other community members, and so on.
Then we put all data in single framework & apply various statistical tools to find out the dynamic on the market.
During the analysis stage, feedback from the stakeholder groups would be compared to determine areas of agreement as well as areas of divergence


