
Key Insights
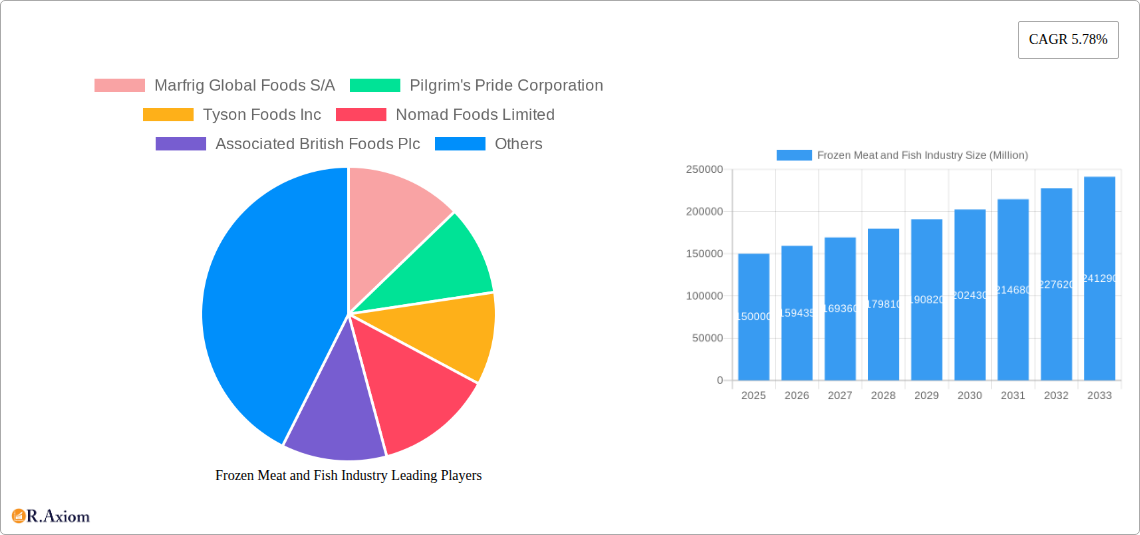
The global frozen meat and fish market, valued at approximately $XX million in 2025, is projected to experience robust growth, exhibiting a Compound Annual Growth Rate (CAGR) of 5.78% from 2025 to 2033. This expansion is fueled by several key drivers. The rising global population and increasing urbanization contribute to heightened demand for convenient, readily available protein sources. Frozen meat and fish products offer extended shelf life and reduced food waste, aligning with consumer preferences for efficient meal preparation and minimizing spoilage. Furthermore, the burgeoning food service industry, including restaurants, fast-food chains, and institutional catering, significantly contributes to market growth. Advancements in freezing technologies, ensuring better product quality and preservation, also play a vital role. However, the market faces challenges, such as fluctuating raw material prices, stringent food safety regulations, and consumer concerns regarding the nutritional value of processed foods. The segmental breakdown reveals a significant share held by white meat, driven by its affordability and widespread consumption. Supermarkets and hypermarkets dominate the distribution channel, although online retail channels show substantial growth potential.
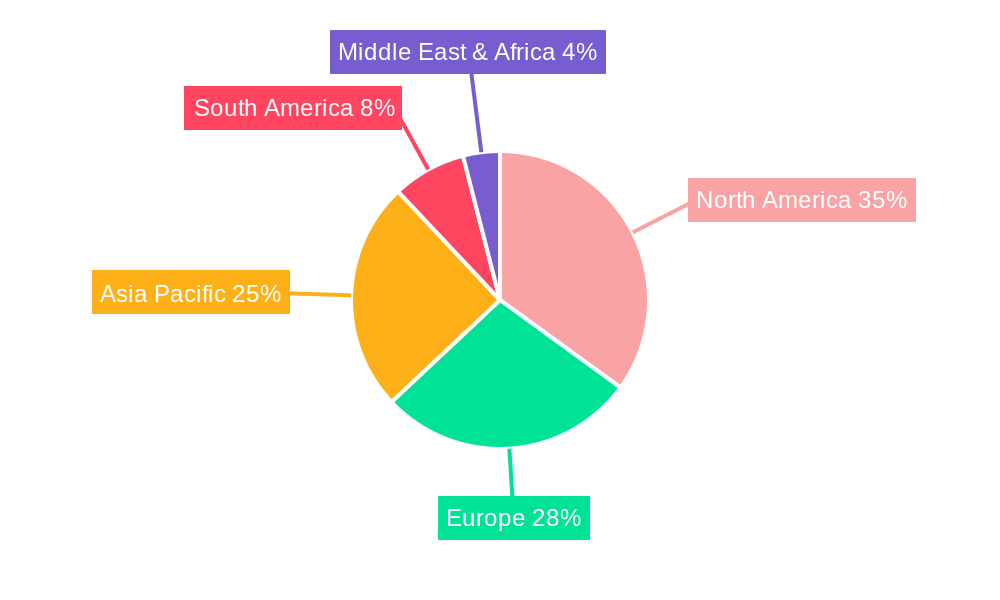
The regional analysis reveals North America and Europe as leading markets, reflecting high per capita consumption and established distribution networks. Asia-Pacific presents significant growth opportunities due to increasing disposable incomes and changing dietary habits. Competitive landscape analysis indicates the presence of both large multinational corporations like Tyson Foods and Marfrig, as well as smaller regional players specializing in niche products. Future market trends point towards an increasing demand for organic and sustainably sourced frozen meat and fish, along with innovative product formats targeting health-conscious consumers. The industry is expected to see continued innovation in packaging technologies, focusing on enhanced preservation, reduced environmental impact, and improved consumer convenience. Overall, the frozen meat and fish market is poised for significant expansion, driven by a confluence of demographic, technological, and economic factors. Understanding these trends is vital for stakeholders to capitalize on emerging opportunities.
Frozen Meat and Fish Industry: A Comprehensive Market Report (2019-2033)
This comprehensive report provides an in-depth analysis of the global frozen meat and fish industry, offering valuable insights for stakeholders seeking to navigate this dynamic market. The report covers the period from 2019 to 2033, with a focus on the forecast period of 2025-2033 and a base year of 2025. The study incorporates detailed segmentation, competitive landscape analysis, and future growth projections, enabling informed decision-making and strategic planning. The total market size in 2025 is estimated at $XX Million.
Frozen Meat and Fish Industry Market Concentration & Innovation
This section analyzes the market concentration, innovation drivers, regulatory landscape, substitute products, end-user trends, and mergers & acquisitions (M&A) activity within the frozen meat and fish industry. The industry is characterized by a mix of large multinational corporations and smaller regional players, leading to a moderately concentrated market structure. Market share data for key players like Marfrig Global Foods S/A, Tyson Foods Inc., and Nomad Foods Limited will be detailed within the full report. Innovation is driven by factors such as consumer demand for convenience, healthier options, and sustainable sourcing. Stringent regulatory frameworks related to food safety and environmental sustainability impact industry practices. The availability of fresh and alternative protein sources presents competitive pressure.
- Market Concentration: The Herfindahl-Hirschman Index (HHI) for the global market is estimated to be xx, indicating a moderately concentrated market.
- M&A Activity: The report details significant M&A transactions, including deal values and their impact on market consolidation. For example, the acquisition of Seattle Fish Company in 2021 demonstrates the ongoing consolidation within the sector. The total value of M&A deals during the study period (2019-2024) is estimated at $XX Million.
- Innovation Drivers: Consumer preferences for convenience, health, and sustainability are key drivers of innovation in product development, packaging, and supply chain management. The rising adoption of advanced technologies like automation and blockchain is further shaping the industry.
- Regulatory Frameworks: Government regulations concerning food safety, labeling, and environmental sustainability influence industry practices and operational costs.
Frozen Meat and Fish Industry Industry Trends & Insights
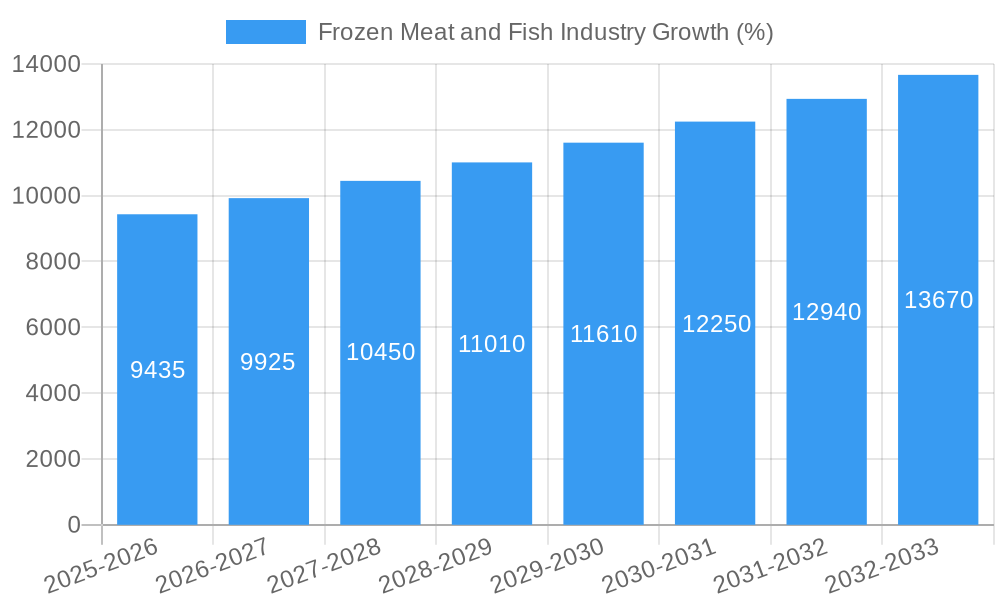
This section delves into the key trends shaping the frozen meat and fish industry, including market growth drivers, technological disruptions, evolving consumer preferences, and competitive dynamics. The global frozen meat and fish market is expected to experience significant growth during the forecast period, driven by factors like rising disposable incomes, increasing urbanization, and changing dietary habits. Technological advancements in freezing, packaging, and distribution are enhancing product quality and shelf life, while simultaneously driving efficiency gains throughout the value chain. The report analyzes the impact of these trends on market growth and competitive positioning. The compound annual growth rate (CAGR) is projected to be xx% during the forecast period. Market penetration of frozen meat and fish products is anticipated to increase from xx% in 2025 to xx% by 2033.
Dominant Markets & Segments in Frozen Meat and Fish Industry
This section identifies the leading regions, countries, and market segments within the frozen meat and fish industry. The analysis considers both product type (white meat, turkey, red meat, fish, and others) and distribution channels (supermarkets/hypermarkets, convenience/grocery stores, online retail stores, and other channels). The report will provide a detailed breakdown of market share and growth potential for each segment.
By Product Type:
- White Meat: Strong growth is expected, driven by increasing demand for poultry and pork products.
- Red Meat: Growth is anticipated, although slower than white meat, influenced by health concerns and changing consumer preferences.
- Fish: Growth is driven by rising health consciousness and the increasing popularity of seafood.
By Distribution Channel:
- Supermarkets/Hypermarkets: Remains the dominant distribution channel, however, growth is expected to slow due to the rise of other channels.
- Convenience/Grocery Stores: Experiencing steady growth, due to its convenience.
- Online Retail Stores: Rapid growth is projected due to increased online shopping and home delivery options.
Geographic Dominance: North America and Europe are expected to remain dominant markets, but rapid growth is projected in Asia-Pacific, driven by increasing consumption and economic growth. Key drivers for specific regions include economic policies, infrastructure development, and consumer behavior.
Frozen Meat and Fish Industry Product Developments
Recent product innovations focus on enhancing convenience, health, and sustainability. This includes ready-to-cook meals, portion-controlled packs, and value-added products. Technological advancements such as improved freezing techniques and innovative packaging materials are improving product quality and shelf life. Manufacturers are increasingly emphasizing sustainable sourcing practices and environmentally friendly packaging. These trends are driving market differentiation and influencing consumer choice.
Report Scope & Segmentation Analysis
The report segments the market by product type (white meat, turkey, red meat, fish, others) and distribution channel (supermarkets/hypermarkets, convenience/grocery stores, online retail stores, other channels). Each segment is analyzed based on its size, growth rate, and competitive dynamics. Growth projections for each segment are provided for the forecast period (2025-2033). Competitive dynamics, including key players, market share, and strategic initiatives, are also analyzed for each segment.
Key Drivers of Frozen Meat and Fish Industry Growth
The industry’s growth is driven by several factors: rising disposable incomes, particularly in developing economies; increasing urbanization leading to higher demand for convenient food options; and health-conscious consumers seeking nutritious and easy-to-prepare meals. Government policies supporting the food industry, technological advancements in food processing and preservation, and improvements in cold chain logistics also contribute to this growth.
Challenges in the Frozen Meat and Fish Industry Sector
Challenges include maintaining food safety and quality throughout the supply chain; managing fluctuating raw material costs; and complying with stringent regulatory requirements. Environmental concerns regarding packaging waste and sustainable sourcing practices also pose challenges. Competition from fresh and alternative protein sources adds further complexity. These factors impact profitability and overall market growth. Estimated losses due to supply chain disruptions are projected to be $XX Million annually.
Emerging Opportunities in Frozen Meat and Fish Industry
Opportunities include expanding into new markets, particularly in developing economies; leveraging technological advancements to improve efficiency and sustainability; and catering to specific consumer needs through product innovation. This includes developing sustainable packaging solutions, catering to dietary restrictions (vegetarian, halal, kosher), and introducing value-added products.
Leading Players in the Frozen Meat and Fish Industry Market
- Marfrig Global Foods S/A
- Pilgrim's Pride Corporation
- Tyson Foods Inc
- Nomad Foods Limited
- Associated British Foods Plc
- High Liner Foods Inc
- Austevoll Seafood ASA
- Verde Farms LLC
- AGROSUPER S A
- M&J Seafood Holdings Limited
Key Developments in Frozen Meat and Fish Industry Industry
- November 2021: Seattle Fish Company acquired by Armand Agra.
- November 2021: Préval AG acquires J&G Foods.
- April 2021: Agthia Group acquires a controlling stake in Ismailia Investments.
These acquisitions illustrate the ongoing consolidation and expansion within the industry.
Strategic Outlook for Frozen Meat and Fish Industry Market
The frozen meat and fish industry is poised for continued growth, driven by increasing consumer demand, technological innovation, and expanding global markets. Strategic investments in sustainable practices, product diversification, and efficient supply chain management will be crucial for success. Focus on health-conscious products, convenient formats, and eco-friendly packaging will appeal to evolving consumer preferences, and propel market growth in the coming years.
Frozen Meat and Fish Industry Segmentation
-
1. Product Type
-
1.1. White Meat
- 1.1.1. Chicken
- 1.1.2. Turkey
-
1.2. Red Meat
- 1.2.1. Beef
- 1.2.2. Pork
- 1.2.3. Lamb
- 1.2.4. Others
-
1.3. Fish
- 1.3.1. Tuna
- 1.3.2. Salmon
- 1.3.3. others
-
1.1. White Meat
-
2. Distibution Channel
- 2.1. Supermarkets/Hypermarkets
- 2.2. Convenience/ Grocery Stores
- 2.3. Online Retail Stores
- 2.4. Other distribution channels
Frozen Meat and Fish Industry Segmentation By Geography
-
1. North America
- 1.1. United States
- 1.2. Canada
- 1.3. Mexico
- 1.4. Rest of North America
-
2. Europe
- 2.1. United Kingdom
- 2.2. Germany
- 2.3. Spain
- 2.4. France
- 2.5. Italy
- 2.6. Russia
- 2.7. Rest of Europe
-
3. Asia Pacific
- 3.1. China
- 3.2. Japan
- 3.3. India
- 3.4. Australia
- 3.5. Rest of Asia Pacific
-
4. South America
- 4.1. Brazil
- 4.2. Argentina
- 4.3. Rest of South America
- 5. Middle East
-
6. Saudi Arabia
- 6.1. South Africa
- 6.2. Rest of Middle East
Frozen Meat and Fish Industry REPORT HIGHLIGHTS
| Aspects | Details |
|---|---|
| Study Period | 2019-2033 |
| Base Year | 2024 |
| Estimated Year | 2025 |
| Forecast Period | 2025-2033 |
| Historical Period | 2019-2024 |
| Growth Rate | CAGR of 5.78% from 2019-2033 |
| Segmentation |
|
Table of Contents
- 1. Introduction
- 1.1. Research Scope
- 1.2. Market Segmentation
- 1.3. Research Methodology
- 1.4. Definitions and Assumptions
- 2. Executive Summary
- 2.1. Introduction
- 3. Market Dynamics
- 3.1. Introduction
- 3.2. Market Drivers
- 3.2.1. The numerous benefits offered by collagen in the food and beverage industry
- 3.3. Market Restrains
- 3.3.1. Increasing vegan population in the region
- 3.4. Market Trends
- 3.4.1 Longer shelf lives
- 3.4.2 expenditure on frozen meals
- 3.4.3 and price point
- 3.4.4 these factors are pushing the market
- 4. Market Factor Analysis
- 4.1. Porters Five Forces
- 4.2. Supply/Value Chain
- 4.3. PESTEL analysis
- 4.4. Market Entropy
- 4.5. Patent/Trademark Analysis
- 5. Global Frozen Meat and Fish Industry Analysis, Insights and Forecast, 2019-2031
- 5.1. Market Analysis, Insights and Forecast - by Product Type
- 5.1.1. White Meat
- 5.1.1.1. Chicken
- 5.1.1.2. Turkey
- 5.1.2. Red Meat
- 5.1.2.1. Beef
- 5.1.2.2. Pork
- 5.1.2.3. Lamb
- 5.1.2.4. Others
- 5.1.3. Fish
- 5.1.3.1. Tuna
- 5.1.3.2. Salmon
- 5.1.3.3. others
- 5.1.1. White Meat
- 5.2. Market Analysis, Insights and Forecast - by Distibution Channel
- 5.2.1. Supermarkets/Hypermarkets
- 5.2.2. Convenience/ Grocery Stores
- 5.2.3. Online Retail Stores
- 5.2.4. Other distribution channels
- 5.3. Market Analysis, Insights and Forecast - by Region
- 5.3.1. North America
- 5.3.2. Europe
- 5.3.3. Asia Pacific
- 5.3.4. South America
- 5.3.5. Middle East
- 5.3.6. Saudi Arabia
- 5.1. Market Analysis, Insights and Forecast - by Product Type
- 6. North America Frozen Meat and Fish Industry Analysis, Insights and Forecast, 2019-2031
- 6.1. Market Analysis, Insights and Forecast - by Product Type
- 6.1.1. White Meat
- 6.1.1.1. Chicken
- 6.1.1.2. Turkey
- 6.1.2. Red Meat
- 6.1.2.1. Beef
- 6.1.2.2. Pork
- 6.1.2.3. Lamb
- 6.1.2.4. Others
- 6.1.3. Fish
- 6.1.3.1. Tuna
- 6.1.3.2. Salmon
- 6.1.3.3. others
- 6.1.1. White Meat
- 6.2. Market Analysis, Insights and Forecast - by Distibution Channel
- 6.2.1. Supermarkets/Hypermarkets
- 6.2.2. Convenience/ Grocery Stores
- 6.2.3. Online Retail Stores
- 6.2.4. Other distribution channels
- 6.1. Market Analysis, Insights and Forecast - by Product Type
- 7. Europe Frozen Meat and Fish Industry Analysis, Insights and Forecast, 2019-2031
- 7.1. Market Analysis, Insights and Forecast - by Product Type
- 7.1.1. White Meat
- 7.1.1.1. Chicken
- 7.1.1.2. Turkey
- 7.1.2. Red Meat
- 7.1.2.1. Beef
- 7.1.2.2. Pork
- 7.1.2.3. Lamb
- 7.1.2.4. Others
- 7.1.3. Fish
- 7.1.3.1. Tuna
- 7.1.3.2. Salmon
- 7.1.3.3. others
- 7.1.1. White Meat
- 7.2. Market Analysis, Insights and Forecast - by Distibution Channel
- 7.2.1. Supermarkets/Hypermarkets
- 7.2.2. Convenience/ Grocery Stores
- 7.2.3. Online Retail Stores
- 7.2.4. Other distribution channels
- 7.1. Market Analysis, Insights and Forecast - by Product Type
- 8. Asia Pacific Frozen Meat and Fish Industry Analysis, Insights and Forecast, 2019-2031
- 8.1. Market Analysis, Insights and Forecast - by Product Type
- 8.1.1. White Meat
- 8.1.1.1. Chicken
- 8.1.1.2. Turkey
- 8.1.2. Red Meat
- 8.1.2.1. Beef
- 8.1.2.2. Pork
- 8.1.2.3. Lamb
- 8.1.2.4. Others
- 8.1.3. Fish
- 8.1.3.1. Tuna
- 8.1.3.2. Salmon
- 8.1.3.3. others
- 8.1.1. White Meat
- 8.2. Market Analysis, Insights and Forecast - by Distibution Channel
- 8.2.1. Supermarkets/Hypermarkets
- 8.2.2. Convenience/ Grocery Stores
- 8.2.3. Online Retail Stores
- 8.2.4. Other distribution channels
- 8.1. Market Analysis, Insights and Forecast - by Product Type
- 9. South America Frozen Meat and Fish Industry Analysis, Insights and Forecast, 2019-2031
- 9.1. Market Analysis, Insights and Forecast - by Product Type
- 9.1.1. White Meat
- 9.1.1.1. Chicken
- 9.1.1.2. Turkey
- 9.1.2. Red Meat
- 9.1.2.1. Beef
- 9.1.2.2. Pork
- 9.1.2.3. Lamb
- 9.1.2.4. Others
- 9.1.3. Fish
- 9.1.3.1. Tuna
- 9.1.3.2. Salmon
- 9.1.3.3. others
- 9.1.1. White Meat
- 9.2. Market Analysis, Insights and Forecast - by Distibution Channel
- 9.2.1. Supermarkets/Hypermarkets
- 9.2.2. Convenience/ Grocery Stores
- 9.2.3. Online Retail Stores
- 9.2.4. Other distribution channels
- 9.1. Market Analysis, Insights and Forecast - by Product Type
- 10. Middle East Frozen Meat and Fish Industry Analysis, Insights and Forecast, 2019-2031
- 10.1. Market Analysis, Insights and Forecast - by Product Type
- 10.1.1. White Meat
- 10.1.1.1. Chicken
- 10.1.1.2. Turkey
- 10.1.2. Red Meat
- 10.1.2.1. Beef
- 10.1.2.2. Pork
- 10.1.2.3. Lamb
- 10.1.2.4. Others
- 10.1.3. Fish
- 10.1.3.1. Tuna
- 10.1.3.2. Salmon
- 10.1.3.3. others
- 10.1.1. White Meat
- 10.2. Market Analysis, Insights and Forecast - by Distibution Channel
- 10.2.1. Supermarkets/Hypermarkets
- 10.2.2. Convenience/ Grocery Stores
- 10.2.3. Online Retail Stores
- 10.2.4. Other distribution channels
- 10.1. Market Analysis, Insights and Forecast - by Product Type
- 11. Saudi Arabia Frozen Meat and Fish Industry Analysis, Insights and Forecast, 2019-2031
- 11.1. Market Analysis, Insights and Forecast - by Product Type
- 11.1.1. White Meat
- 11.1.1.1. Chicken
- 11.1.1.2. Turkey
- 11.1.2. Red Meat
- 11.1.2.1. Beef
- 11.1.2.2. Pork
- 11.1.2.3. Lamb
- 11.1.2.4. Others
- 11.1.3. Fish
- 11.1.3.1. Tuna
- 11.1.3.2. Salmon
- 11.1.3.3. others
- 11.1.1. White Meat
- 11.2. Market Analysis, Insights and Forecast - by Distibution Channel
- 11.2.1. Supermarkets/Hypermarkets
- 11.2.2. Convenience/ Grocery Stores
- 11.2.3. Online Retail Stores
- 11.2.4. Other distribution channels
- 11.1. Market Analysis, Insights and Forecast - by Product Type
- 12. North America Frozen Meat and Fish Industry Analysis, Insights and Forecast, 2019-2031
- 12.1. Market Analysis, Insights and Forecast - By Country/Sub-region
- 12.1.1 United States
- 12.1.2 Canada
- 12.1.3 Mexico
- 12.1.4 Rest of North America
- 13. Europe Frozen Meat and Fish Industry Analysis, Insights and Forecast, 2019-2031
- 13.1. Market Analysis, Insights and Forecast - By Country/Sub-region
- 13.1.1 United Kingdom
- 13.1.2 Germany
- 13.1.3 Spain
- 13.1.4 France
- 13.1.5 Italy
- 13.1.6 Russia
- 13.1.7 Rest of Europe
- 14. Asia Pacific Frozen Meat and Fish Industry Analysis, Insights and Forecast, 2019-2031
- 14.1. Market Analysis, Insights and Forecast - By Country/Sub-region
- 14.1.1 China
- 14.1.2 Japan
- 14.1.3 India
- 14.1.4 Australia
- 14.1.5 Rest of Asia Pacific
- 15. South America Frozen Meat and Fish Industry Analysis, Insights and Forecast, 2019-2031
- 15.1. Market Analysis, Insights and Forecast - By Country/Sub-region
- 15.1.1 Brazil
- 15.1.2 Argentina
- 15.1.3 Rest of South America
- 16. Middle East & Africa Frozen Meat and Fish Industry Analysis, Insights and Forecast, 2019-2031
- 16.1. Market Analysis, Insights and Forecast - By Country/Sub-region
- 16.1.1 UAE
- 16.1.2 South Africa
- 16.1.3 Saudi Arabia
- 16.1.4 Rest of MEA
- 17. Competitive Analysis
- 17.1. Global Market Share Analysis 2024
- 17.2. Company Profiles
- 17.2.1 Marfrig Global Foods S/A
- 17.2.1.1. Overview
- 17.2.1.2. Products
- 17.2.1.3. SWOT Analysis
- 17.2.1.4. Recent Developments
- 17.2.1.5. Financials (Based on Availability)
- 17.2.2 Pilgrim's Pride Corporation
- 17.2.2.1. Overview
- 17.2.2.2. Products
- 17.2.2.3. SWOT Analysis
- 17.2.2.4. Recent Developments
- 17.2.2.5. Financials (Based on Availability)
- 17.2.3 Tyson Foods Inc
- 17.2.3.1. Overview
- 17.2.3.2. Products
- 17.2.3.3. SWOT Analysis
- 17.2.3.4. Recent Developments
- 17.2.3.5. Financials (Based on Availability)
- 17.2.4 Nomad Foods Limited
- 17.2.4.1. Overview
- 17.2.4.2. Products
- 17.2.4.3. SWOT Analysis
- 17.2.4.4. Recent Developments
- 17.2.4.5. Financials (Based on Availability)
- 17.2.5 Associated British Foods Plc
- 17.2.5.1. Overview
- 17.2.5.2. Products
- 17.2.5.3. SWOT Analysis
- 17.2.5.4. Recent Developments
- 17.2.5.5. Financials (Based on Availability)
- 17.2.6 High Liner Foods Inc*List Not Exhaustive
- 17.2.6.1. Overview
- 17.2.6.2. Products
- 17.2.6.3. SWOT Analysis
- 17.2.6.4. Recent Developments
- 17.2.6.5. Financials (Based on Availability)
- 17.2.7 Austevoll Seafood ASA
- 17.2.7.1. Overview
- 17.2.7.2. Products
- 17.2.7.3. SWOT Analysis
- 17.2.7.4. Recent Developments
- 17.2.7.5. Financials (Based on Availability)
- 17.2.8 Verde Farms LLC
- 17.2.8.1. Overview
- 17.2.8.2. Products
- 17.2.8.3. SWOT Analysis
- 17.2.8.4. Recent Developments
- 17.2.8.5. Financials (Based on Availability)
- 17.2.9 AGROSUPER S A
- 17.2.9.1. Overview
- 17.2.9.2. Products
- 17.2.9.3. SWOT Analysis
- 17.2.9.4. Recent Developments
- 17.2.9.5. Financials (Based on Availability)
- 17.2.10 M&J Seafood Holdings Limited
- 17.2.10.1. Overview
- 17.2.10.2. Products
- 17.2.10.3. SWOT Analysis
- 17.2.10.4. Recent Developments
- 17.2.10.5. Financials (Based on Availability)
- 17.2.1 Marfrig Global Foods S/A
List of Figures
- Figure 1: Global Frozen Meat and Fish Industry Revenue Breakdown (Million, %) by Region 2024 & 2032
- Figure 2: North America Frozen Meat and Fish Industry Revenue (Million), by Country 2024 & 2032
- Figure 3: North America Frozen Meat and Fish Industry Revenue Share (%), by Country 2024 & 2032
- Figure 4: Europe Frozen Meat and Fish Industry Revenue (Million), by Country 2024 & 2032
- Figure 5: Europe Frozen Meat and Fish Industry Revenue Share (%), by Country 2024 & 2032
- Figure 6: Asia Pacific Frozen Meat and Fish Industry Revenue (Million), by Country 2024 & 2032
- Figure 7: Asia Pacific Frozen Meat and Fish Industry Revenue Share (%), by Country 2024 & 2032
- Figure 8: South America Frozen Meat and Fish Industry Revenue (Million), by Country 2024 & 2032
- Figure 9: South America Frozen Meat and Fish Industry Revenue Share (%), by Country 2024 & 2032
- Figure 10: Middle East & Africa Frozen Meat and Fish Industry Revenue (Million), by Country 2024 & 2032
- Figure 11: Middle East & Africa Frozen Meat and Fish Industry Revenue Share (%), by Country 2024 & 2032
- Figure 12: North America Frozen Meat and Fish Industry Revenue (Million), by Product Type 2024 & 2032
- Figure 13: North America Frozen Meat and Fish Industry Revenue Share (%), by Product Type 2024 & 2032
- Figure 14: North America Frozen Meat and Fish Industry Revenue (Million), by Distibution Channel 2024 & 2032
- Figure 15: North America Frozen Meat and Fish Industry Revenue Share (%), by Distibution Channel 2024 & 2032
- Figure 16: North America Frozen Meat and Fish Industry Revenue (Million), by Country 2024 & 2032
- Figure 17: North America Frozen Meat and Fish Industry Revenue Share (%), by Country 2024 & 2032
- Figure 18: Europe Frozen Meat and Fish Industry Revenue (Million), by Product Type 2024 & 2032
- Figure 19: Europe Frozen Meat and Fish Industry Revenue Share (%), by Product Type 2024 & 2032
- Figure 20: Europe Frozen Meat and Fish Industry Revenue (Million), by Distibution Channel 2024 & 2032
- Figure 21: Europe Frozen Meat and Fish Industry Revenue Share (%), by Distibution Channel 2024 & 2032
- Figure 22: Europe Frozen Meat and Fish Industry Revenue (Million), by Country 2024 & 2032
- Figure 23: Europe Frozen Meat and Fish Industry Revenue Share (%), by Country 2024 & 2032
- Figure 24: Asia Pacific Frozen Meat and Fish Industry Revenue (Million), by Product Type 2024 & 2032
- Figure 25: Asia Pacific Frozen Meat and Fish Industry Revenue Share (%), by Product Type 2024 & 2032
- Figure 26: Asia Pacific Frozen Meat and Fish Industry Revenue (Million), by Distibution Channel 2024 & 2032
- Figure 27: Asia Pacific Frozen Meat and Fish Industry Revenue Share (%), by Distibution Channel 2024 & 2032
- Figure 28: Asia Pacific Frozen Meat and Fish Industry Revenue (Million), by Country 2024 & 2032
- Figure 29: Asia Pacific Frozen Meat and Fish Industry Revenue Share (%), by Country 2024 & 2032
- Figure 30: South America Frozen Meat and Fish Industry Revenue (Million), by Product Type 2024 & 2032
- Figure 31: South America Frozen Meat and Fish Industry Revenue Share (%), by Product Type 2024 & 2032
- Figure 32: South America Frozen Meat and Fish Industry Revenue (Million), by Distibution Channel 2024 & 2032
- Figure 33: South America Frozen Meat and Fish Industry Revenue Share (%), by Distibution Channel 2024 & 2032
- Figure 34: South America Frozen Meat and Fish Industry Revenue (Million), by Country 2024 & 2032
- Figure 35: South America Frozen Meat and Fish Industry Revenue Share (%), by Country 2024 & 2032
- Figure 36: Middle East Frozen Meat and Fish Industry Revenue (Million), by Product Type 2024 & 2032
- Figure 37: Middle East Frozen Meat and Fish Industry Revenue Share (%), by Product Type 2024 & 2032
- Figure 38: Middle East Frozen Meat and Fish Industry Revenue (Million), by Distibution Channel 2024 & 2032
- Figure 39: Middle East Frozen Meat and Fish Industry Revenue Share (%), by Distibution Channel 2024 & 2032
- Figure 40: Middle East Frozen Meat and Fish Industry Revenue (Million), by Country 2024 & 2032
- Figure 41: Middle East Frozen Meat and Fish Industry Revenue Share (%), by Country 2024 & 2032
- Figure 42: Saudi Arabia Frozen Meat and Fish Industry Revenue (Million), by Product Type 2024 & 2032
- Figure 43: Saudi Arabia Frozen Meat and Fish Industry Revenue Share (%), by Product Type 2024 & 2032
- Figure 44: Saudi Arabia Frozen Meat and Fish Industry Revenue (Million), by Distibution Channel 2024 & 2032
- Figure 45: Saudi Arabia Frozen Meat and Fish Industry Revenue Share (%), by Distibution Channel 2024 & 2032
- Figure 46: Saudi Arabia Frozen Meat and Fish Industry Revenue (Million), by Country 2024 & 2032
- Figure 47: Saudi Arabia Frozen Meat and Fish Industry Revenue Share (%), by Country 2024 & 2032
List of Tables
- Table 1: Global Frozen Meat and Fish Industry Revenue Million Forecast, by Region 2019 & 2032
- Table 2: Global Frozen Meat and Fish Industry Revenue Million Forecast, by Product Type 2019 & 2032
- Table 3: Global Frozen Meat and Fish Industry Revenue Million Forecast, by Distibution Channel 2019 & 2032
- Table 4: Global Frozen Meat and Fish Industry Revenue Million Forecast, by Region 2019 & 2032
- Table 5: Global Frozen Meat and Fish Industry Revenue Million Forecast, by Country 2019 & 2032
- Table 6: United States Frozen Meat and Fish Industry Revenue (Million) Forecast, by Application 2019 & 2032
- Table 7: Canada Frozen Meat and Fish Industry Revenue (Million) Forecast, by Application 2019 & 2032
- Table 8: Mexico Frozen Meat and Fish Industry Revenue (Million) Forecast, by Application 2019 & 2032
- Table 9: Rest of North America Frozen Meat and Fish Industry Revenue (Million) Forecast, by Application 2019 & 2032
- Table 10: Global Frozen Meat and Fish Industry Revenue Million Forecast, by Country 2019 & 2032
- Table 11: United Kingdom Frozen Meat and Fish Industry Revenue (Million) Forecast, by Application 2019 & 2032
- Table 12: Germany Frozen Meat and Fish Industry Revenue (Million) Forecast, by Application 2019 & 2032
- Table 13: Spain Frozen Meat and Fish Industry Revenue (Million) Forecast, by Application 2019 & 2032
- Table 14: France Frozen Meat and Fish Industry Revenue (Million) Forecast, by Application 2019 & 2032
- Table 15: Italy Frozen Meat and Fish Industry Revenue (Million) Forecast, by Application 2019 & 2032
- Table 16: Russia Frozen Meat and Fish Industry Revenue (Million) Forecast, by Application 2019 & 2032
- Table 17: Rest of Europe Frozen Meat and Fish Industry Revenue (Million) Forecast, by Application 2019 & 2032
- Table 18: Global Frozen Meat and Fish Industry Revenue Million Forecast, by Country 2019 & 2032
- Table 19: China Frozen Meat and Fish Industry Revenue (Million) Forecast, by Application 2019 & 2032
- Table 20: Japan Frozen Meat and Fish Industry Revenue (Million) Forecast, by Application 2019 & 2032
- Table 21: India Frozen Meat and Fish Industry Revenue (Million) Forecast, by Application 2019 & 2032
- Table 22: Australia Frozen Meat and Fish Industry Revenue (Million) Forecast, by Application 2019 & 2032
- Table 23: Rest of Asia Pacific Frozen Meat and Fish Industry Revenue (Million) Forecast, by Application 2019 & 2032
- Table 24: Global Frozen Meat and Fish Industry Revenue Million Forecast, by Country 2019 & 2032
- Table 25: Brazil Frozen Meat and Fish Industry Revenue (Million) Forecast, by Application 2019 & 2032
- Table 26: Argentina Frozen Meat and Fish Industry Revenue (Million) Forecast, by Application 2019 & 2032
- Table 27: Rest of South America Frozen Meat and Fish Industry Revenue (Million) Forecast, by Application 2019 & 2032
- Table 28: Global Frozen Meat and Fish Industry Revenue Million Forecast, by Country 2019 & 2032
- Table 29: UAE Frozen Meat and Fish Industry Revenue (Million) Forecast, by Application 2019 & 2032
- Table 30: South Africa Frozen Meat and Fish Industry Revenue (Million) Forecast, by Application 2019 & 2032
- Table 31: Saudi Arabia Frozen Meat and Fish Industry Revenue (Million) Forecast, by Application 2019 & 2032
- Table 32: Rest of MEA Frozen Meat and Fish Industry Revenue (Million) Forecast, by Application 2019 & 2032
- Table 33: Global Frozen Meat and Fish Industry Revenue Million Forecast, by Product Type 2019 & 2032
- Table 34: Global Frozen Meat and Fish Industry Revenue Million Forecast, by Distibution Channel 2019 & 2032
- Table 35: Global Frozen Meat and Fish Industry Revenue Million Forecast, by Country 2019 & 2032
- Table 36: United States Frozen Meat and Fish Industry Revenue (Million) Forecast, by Application 2019 & 2032
- Table 37: Canada Frozen Meat and Fish Industry Revenue (Million) Forecast, by Application 2019 & 2032
- Table 38: Mexico Frozen Meat and Fish Industry Revenue (Million) Forecast, by Application 2019 & 2032
- Table 39: Rest of North America Frozen Meat and Fish Industry Revenue (Million) Forecast, by Application 2019 & 2032
- Table 40: Global Frozen Meat and Fish Industry Revenue Million Forecast, by Product Type 2019 & 2032
- Table 41: Global Frozen Meat and Fish Industry Revenue Million Forecast, by Distibution Channel 2019 & 2032
- Table 42: Global Frozen Meat and Fish Industry Revenue Million Forecast, by Country 2019 & 2032
- Table 43: United Kingdom Frozen Meat and Fish Industry Revenue (Million) Forecast, by Application 2019 & 2032
- Table 44: Germany Frozen Meat and Fish Industry Revenue (Million) Forecast, by Application 2019 & 2032
- Table 45: Spain Frozen Meat and Fish Industry Revenue (Million) Forecast, by Application 2019 & 2032
- Table 46: France Frozen Meat and Fish Industry Revenue (Million) Forecast, by Application 2019 & 2032
- Table 47: Italy Frozen Meat and Fish Industry Revenue (Million) Forecast, by Application 2019 & 2032
- Table 48: Russia Frozen Meat and Fish Industry Revenue (Million) Forecast, by Application 2019 & 2032
- Table 49: Rest of Europe Frozen Meat and Fish Industry Revenue (Million) Forecast, by Application 2019 & 2032
- Table 50: Global Frozen Meat and Fish Industry Revenue Million Forecast, by Product Type 2019 & 2032
- Table 51: Global Frozen Meat and Fish Industry Revenue Million Forecast, by Distibution Channel 2019 & 2032
- Table 52: Global Frozen Meat and Fish Industry Revenue Million Forecast, by Country 2019 & 2032
- Table 53: China Frozen Meat and Fish Industry Revenue (Million) Forecast, by Application 2019 & 2032
- Table 54: Japan Frozen Meat and Fish Industry Revenue (Million) Forecast, by Application 2019 & 2032
- Table 55: India Frozen Meat and Fish Industry Revenue (Million) Forecast, by Application 2019 & 2032
- Table 56: Australia Frozen Meat and Fish Industry Revenue (Million) Forecast, by Application 2019 & 2032
- Table 57: Rest of Asia Pacific Frozen Meat and Fish Industry Revenue (Million) Forecast, by Application 2019 & 2032
- Table 58: Global Frozen Meat and Fish Industry Revenue Million Forecast, by Product Type 2019 & 2032
- Table 59: Global Frozen Meat and Fish Industry Revenue Million Forecast, by Distibution Channel 2019 & 2032
- Table 60: Global Frozen Meat and Fish Industry Revenue Million Forecast, by Country 2019 & 2032
- Table 61: Brazil Frozen Meat and Fish Industry Revenue (Million) Forecast, by Application 2019 & 2032
- Table 62: Argentina Frozen Meat and Fish Industry Revenue (Million) Forecast, by Application 2019 & 2032
- Table 63: Rest of South America Frozen Meat and Fish Industry Revenue (Million) Forecast, by Application 2019 & 2032
- Table 64: Global Frozen Meat and Fish Industry Revenue Million Forecast, by Product Type 2019 & 2032
- Table 65: Global Frozen Meat and Fish Industry Revenue Million Forecast, by Distibution Channel 2019 & 2032
- Table 66: Global Frozen Meat and Fish Industry Revenue Million Forecast, by Country 2019 & 2032
- Table 67: Global Frozen Meat and Fish Industry Revenue Million Forecast, by Product Type 2019 & 2032
- Table 68: Global Frozen Meat and Fish Industry Revenue Million Forecast, by Distibution Channel 2019 & 2032
- Table 69: Global Frozen Meat and Fish Industry Revenue Million Forecast, by Country 2019 & 2032
- Table 70: South Africa Frozen Meat and Fish Industry Revenue (Million) Forecast, by Application 2019 & 2032
- Table 71: Rest of Middle East Frozen Meat and Fish Industry Revenue (Million) Forecast, by Application 2019 & 2032
Frequently Asked Questions
1. What is the projected Compound Annual Growth Rate (CAGR) of the Frozen Meat and Fish Industry?
The projected CAGR is approximately 5.78%.
2. Which companies are prominent players in the Frozen Meat and Fish Industry?
Key companies in the market include Marfrig Global Foods S/A, Pilgrim's Pride Corporation, Tyson Foods Inc, Nomad Foods Limited, Associated British Foods Plc, High Liner Foods Inc*List Not Exhaustive, Austevoll Seafood ASA, Verde Farms LLC, AGROSUPER S A, M&J Seafood Holdings Limited.
3. What are the main segments of the Frozen Meat and Fish Industry?
The market segments include Product Type, Distibution Channel.
4. Can you provide details about the market size?
The market size is estimated to be USD XX Million as of 2022.
5. What are some drivers contributing to market growth?
The numerous benefits offered by collagen in the food and beverage industry.
6. What are the notable trends driving market growth?
Longer shelf lives. expenditure on frozen meals. and price point. these factors are pushing the market.
7. Are there any restraints impacting market growth?
Increasing vegan population in the region.
8. Can you provide examples of recent developments in the market?
In November 2021, Seattle Fish Company, situated in the United States, has been sold to Armand Agra, a subsidiary of the Founders Group of Food Companies. Armand Agra operates Sierra Meat and Seafood, Durham Ranches, McDonald Meat Co., and Flocchini Family Provisions in Reno and Carson City, Nevada, and Seattle, Washington, USA.
9. What pricing options are available for accessing the report?
Pricing options include single-user, multi-user, and enterprise licenses priced at USD 4750, USD 5250, and USD 8750 respectively.
10. Is the market size provided in terms of value or volume?
The market size is provided in terms of value, measured in Million.
11. Are there any specific market keywords associated with the report?
Yes, the market keyword associated with the report is "Frozen Meat and Fish Industry," which aids in identifying and referencing the specific market segment covered.
12. How do I determine which pricing option suits my needs best?
The pricing options vary based on user requirements and access needs. Individual users may opt for single-user licenses, while businesses requiring broader access may choose multi-user or enterprise licenses for cost-effective access to the report.
13. Are there any additional resources or data provided in the Frozen Meat and Fish Industry report?
While the report offers comprehensive insights, it's advisable to review the specific contents or supplementary materials provided to ascertain if additional resources or data are available.
14. How can I stay updated on further developments or reports in the Frozen Meat and Fish Industry?
To stay informed about further developments, trends, and reports in the Frozen Meat and Fish Industry, consider subscribing to industry newsletters, following relevant companies and organizations, or regularly checking reputable industry news sources and publications.
Methodology
Step 1 - Identification of Relevant Samples Size from Population Database


Step 2 - Approaches for Defining Global Market Size (Value, Volume* & Price*)

Note*: In applicable scenarios
Step 3 - Data Sources
Primary Research
- Web Analytics
- Survey Reports
- Research Institute
- Latest Research Reports
- Opinion Leaders
Secondary Research
- Annual Reports
- White Paper
- Latest Press Release
- Industry Association
- Paid Database
- Investor Presentations

Step 4 - Data Triangulation
Involves using different sources of information in order to increase the validity of a study
These sources are likely to be stakeholders in a program - participants, other researchers, program staff, other community members, and so on.
Then we put all data in single framework & apply various statistical tools to find out the dynamic on the market.
During the analysis stage, feedback from the stakeholder groups would be compared to determine areas of agreement as well as areas of divergence


