
Key Insights
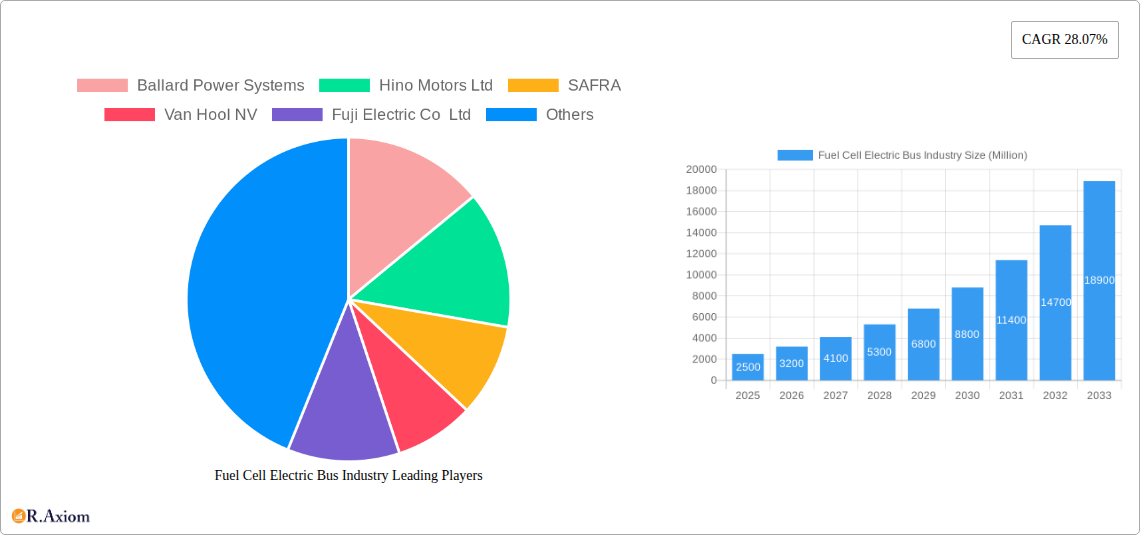
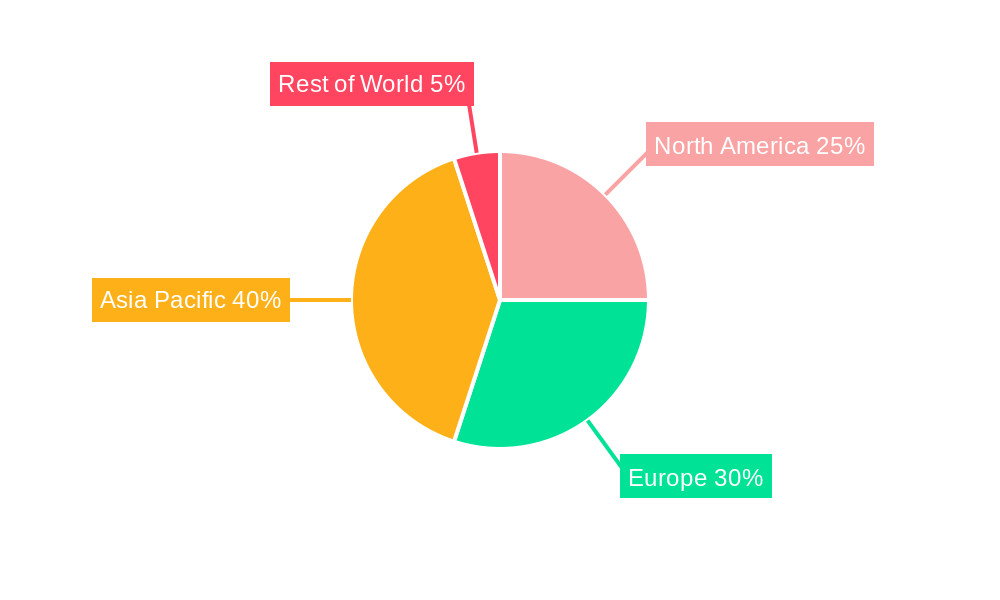
The global fuel cell electric bus market is experiencing robust growth, driven by increasing environmental concerns, stringent emission regulations, and the pursuit of sustainable public transportation. The market's Compound Annual Growth Rate (CAGR) of 28.07% from 2019 to 2024 indicates a significant upward trajectory, projected to continue over the forecast period (2025-2033). This expansion is fueled by substantial investments in research and development, technological advancements leading to improved efficiency and durability of fuel cell systems, and supportive government policies promoting the adoption of zero-emission vehicles. The intercity segment is expected to witness faster growth compared to intracity due to the longer distances covered and consequently higher fuel savings. The adoption of new hydrogen buses is projected to outpace retrofitted hydrogen buses due to their superior performance and efficiency. Key players, including Ballard Power Systems, Hino Motors, and others, are actively contributing to market growth through innovation, strategic partnerships, and expansion into new markets. The Asia-Pacific region, particularly China and India, is anticipated to dominate the market due to the substantial investments in public transportation infrastructure and growing awareness of environmental sustainability. North America and Europe also present significant market opportunities, driven by supportive policies and increasing demand for clean transportation solutions.
The market's growth, however, faces certain restraints. High initial investment costs associated with fuel cell buses and the limited availability of hydrogen refueling infrastructure remain key challenges. Furthermore, the fluctuating prices of hydrogen fuel can impact the overall cost-effectiveness of fuel cell buses, potentially hindering widespread adoption. Overcoming these challenges requires collaborative efforts between governments, manufacturers, and infrastructure providers to create a supportive ecosystem for the deployment of fuel cell electric buses. Technological advancements focused on reducing the cost of fuel cell technology and increasing the efficiency of hydrogen production and distribution will play a crucial role in accelerating market penetration and achieving long-term sustainable growth. The strategic focus on improving battery technology integration within fuel cell buses is expected to mitigate some of the limitations of current fuel cell electric bus technology.
This in-depth report provides a comprehensive analysis of the Fuel Cell Electric Bus industry, covering market size, growth drivers, key players, technological advancements, and future outlook. The study period spans from 2019 to 2033, with 2025 serving as the base and estimated year. This report is essential for industry stakeholders, investors, and strategic decision-makers seeking actionable insights into this rapidly evolving sector. The report projects a market value of xx Million by 2033, exhibiting a CAGR of xx% during the forecast period (2025-2033).
Fuel Cell Electric Bus Industry Market Concentration & Innovation
The Fuel Cell Electric Bus industry is characterized by a moderately concentrated market, with several key players holding significant market share. Ballard Power Systems, Hino Motors Ltd, and New Flyer Industries Ltd are among the prominent companies driving innovation and shaping market dynamics. The market share of these key players is estimated at xx% in 2025, with Ballard Power Systems holding approximately xx%. However, several smaller companies and startups are also contributing to the growing innovation landscape.
Innovation is driven by advancements in fuel cell technology, including increased efficiency, durability, and reduced costs. Stringent environmental regulations globally are also accelerating the adoption of fuel cell electric buses, particularly in urban areas. The regulatory landscape varies across regions, with some governments providing significant incentives for the adoption of fuel cell vehicles. Product substitutes include battery electric buses and traditional diesel buses; however, the advantages of fuel cell buses in terms of range and refueling time provide a competitive edge. End-user trends indicate a growing preference for sustainable transportation solutions. Recent mergers and acquisitions (M&A) activity in the industry, while not at a high volume, indicates strategic consolidation and the entrance of new players in the sector with total M&A deal values exceeding xx Million in the last five years.
- Key Market Players: Ballard Power Systems, Hino Motors Ltd, SAFRA, Van Hool NV, Fuji Electric Co Ltd, IVECO Group, EvoBus GmbH, NovaBus Corporation, Tata Motors Limited, MAN Truck & Bus SE, SunLine Transit Agency, New Flyer Industries Ltd, Cummins Inc, Proton Motor Fuel Cell GmbH, Nuvera Fuel Cells LLC.
- Innovation Drivers: Technological advancements in fuel cell efficiency, government regulations, and growing environmental consciousness.
- M&A Activity: Strategic acquisitions to expand market reach and technology portfolios (xx Million total deal value in last five years).
Fuel Cell Electric Bus Industry Industry Trends & Insights
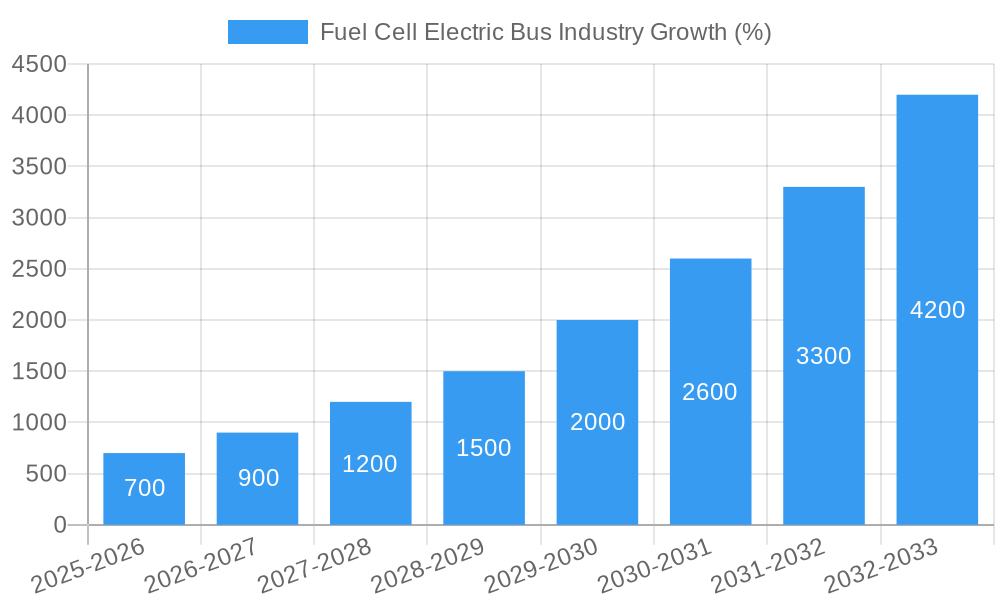
The Fuel Cell Electric Bus market is experiencing significant growth, driven by factors such as increasing environmental concerns, government regulations promoting clean transportation, and technological advancements leading to improved fuel cell performance and reduced costs. The market is predicted to witness substantial growth, exceeding xx Million by 2033. The rising demand for sustainable transportation solutions in urban and intercity applications is a significant contributor to this growth.
Technological disruptions, particularly in fuel cell stack technology and hydrogen storage solutions, are impacting the industry's competitive dynamics. Consumer preferences are shifting towards eco-friendly transportation options, further boosting the demand for fuel cell electric buses. The competitive landscape is dynamic, with established players and new entrants vying for market share. This leads to innovation and competition in pricing and features. The market penetration of fuel cell buses is still relatively low compared to traditional diesel buses, but it's rapidly increasing at a CAGR of xx% from 2025 to 2033, driven by substantial government investments and supportive policies. The emergence of new hydrogen refueling infrastructure is also expected to fuel growth over the forecast period.
Dominant Markets & Segments in Fuel Cell Electric Bus Industry
The dominant segment in the Fuel Cell Electric Bus industry is currently the Intracity application, driven by high passenger volume and the potential for reduced emissions in densely populated urban areas. Within Bus Type, New Hydrogen Buses currently hold the largest market share due to continuous advancements in hydrogen production and storage technologies, surpassing Retrofitted Hydrogen Buses, whose penetration is still limited due to the higher retrofitting costs and technical challenges. Geographically, regions with strong government support for green initiatives, such as Europe and North America, are exhibiting the highest adoption rates.
- Key Drivers in Dominant Segments:
- Intracity: High passenger volume, reduced emission targets in urban areas, supportive government policies, and increasing availability of hydrogen fueling stations.
- New Hydrogen Buses: Technological advancements improving efficiency and durability, cost reductions through economies of scale.
- Leading Regions: Europe and North America (due to strong environmental regulations and government incentives).
Fuel Cell Electric Bus Industry Product Developments
Recent product innovations focus on enhancing fuel cell efficiency, increasing range, and improving the overall performance and reliability of fuel cell electric buses. Companies are developing higher-capacity fuel cell systems, advanced hydrogen storage solutions, and intelligent energy management systems to optimize bus performance and lower operational costs. New models like New Flyer's Xcelsior CHARGE FC demonstrate the integration of advanced fuel cell modules from companies such as Ballard Power Systems. These advancements cater to the increasing demand for longer-range, more reliable, and cost-effective fuel cell electric buses, ensuring a better market fit and enhanced competitive advantages.
Report Scope & Segmentation Analysis
This report segments the Fuel Cell Electric Bus market based on application (Intercity and Intracity) and bus type (New Hydrogen Buses and Retrofitted Hydrogen Buses).
Application: The Intercity segment is expected to show slower but steady growth due to its reliance on existing infrastructure and the necessity of establishing long-distance hydrogen refueling networks. The Intracity segment is projected to demonstrate significant growth due to the concentration of potential customers and the suitability of fuel cell buses for urban environments.
Bus Type: The New Hydrogen Buses segment will dominate the market due to higher efficiency and lower initial costs compared to retrofitting existing buses. While the Retrofitted Hydrogen Buses segment presents potential for growth, it faces challenges related to cost, technical compatibility, and infrastructure limitations. The competitive landscape for each segment reflects the varying technological readiness and market penetration levels.
Key Drivers of Fuel Cell Electric Bus Industry Growth
The growth of the Fuel Cell Electric Bus industry is fueled by several key factors: stringent environmental regulations aimed at reducing greenhouse gas emissions from public transportation, government incentives and subsidies promoting the adoption of clean energy vehicles, technological advancements enhancing fuel cell efficiency and durability, and growing consumer demand for eco-friendly transportation options. The development of hydrogen refueling infrastructure is also a crucial driver, enabling wider adoption of fuel cell buses.
Challenges in the Fuel Cell Electric Bus Industry Sector
Despite the growth potential, the Fuel Cell Electric Bus industry faces several challenges: the high initial cost of fuel cell buses compared to traditional diesel buses, the limited availability of hydrogen refueling infrastructure, the complexities of the hydrogen supply chain, and the ongoing competition from battery electric buses. These factors can significantly impact market penetration and adoption rates, limiting growth potential. Furthermore, regulatory uncertainties in certain regions create uncertainty for long-term investments. These challenges cumulatively represent a significant restraint on faster market growth.
Emerging Opportunities in Fuel Cell Electric Bus Industry
Emerging opportunities include expanding into new markets with supportive government policies, developing advanced fuel cell and hydrogen storage technologies to enhance efficiency and reduce costs, creating strategic partnerships with hydrogen infrastructure providers, and exploring potential applications in other transportation sectors beyond buses. The focus on improving the overall cost-effectiveness of fuel cell buses presents a significant opportunity for market expansion.
Leading Players in the Fuel Cell Electric Bus Industry Market
- Ballard Power Systems
- Hino Motors Ltd
- SAFRA
- Van Hool NV
- Fuji Electric Co Ltd
- IVECO Group
- EvoBus GmbH
- NovaBus Corporation
- Tata Motors Limited
- MAN Truck & Bus SE
- SunLine Transit Agency
- New Flyer Industries Ltd
- Cummins Inc
- Proton Motor Fuel Cell GmbH
- Nuvera Fuel Cells LLC
Key Developments in Fuel Cell Electric Bus Industry Industry
- September 2022: New Flyer unveils the Xcelsior CHARGE FC fuel cell bus, featuring Ballard Power Systems' fuel cell module. This launch showcases significant advancements in fuel cell technology and further validates the growing market for hydrogen-powered buses.
- September 2022: Guangdong Sino-Synergy Hydrogen Technology Co., Ltd. introduces the first "Hydrogen Fuel Cell Journey Coach" in Europe, demonstrating growing international collaboration and expansion of the technology into new markets. This further highlights the growing acceptance of fuel cell buses as a viable transportation solution.
- September 2022: Marcopolo showcases its first hydrogen-powered bus at IAA Transportation 2022. This indicates further momentum in the development and adoption of fuel cell electric buses by major players in the global bus manufacturing sector.
Strategic Outlook for Fuel Cell Electric Bus Industry Market
The future of the Fuel Cell Electric Bus market is promising, driven by ongoing technological advancements, supportive government policies, and growing environmental awareness. The market is expected to experience significant growth in the coming years, with increasing adoption in both urban and intercity applications. Continued investment in research and development, along with expansion of hydrogen refueling infrastructure, will be key factors in shaping the future of this industry. The focus on cost reduction and improved efficiency will further drive market expansion and wider adoption of this clean transportation technology.
Fuel Cell Electric Bus Industry Segmentation
-
1. Application
- 1.1. Intercity
- 1.2. Intracity
-
2. Bus Type
- 2.1. New Hydrogen Buses
- 2.2. Retrofitted Hydrogen Buses
Fuel Cell Electric Bus Industry Segmentation By Geography
-
1. North America
- 1.1. United States
- 1.2. Canada
- 1.3. Mexico
- 1.4. Rest of North America
-
2. Europe
- 2.1. Germany
- 2.2. United Kingdom
- 2.3. France
- 2.4. Italy
- 2.5. Spain
- 2.6. Rest of Europe
-
3. Asia Pacific
- 3.1. India
- 3.2. China
- 3.3. South Korea
- 3.4. Japan
- 3.5. Rest of Asia Pacific
-
4. Rest of the World
- 4.1. South America
- 4.2. Middle East and Africa
Fuel Cell Electric Bus Industry REPORT HIGHLIGHTS
| Aspects | Details |
|---|---|
| Study Period | 2019-2033 |
| Base Year | 2024 |
| Estimated Year | 2025 |
| Forecast Period | 2025-2033 |
| Historical Period | 2019-2024 |
| Growth Rate | CAGR of 28.07% from 2019-2033 |
| Segmentation |
|
Table of Contents
- 1. Introduction
- 1.1. Research Scope
- 1.2. Market Segmentation
- 1.3. Research Methodology
- 1.4. Definitions and Assumptions
- 2. Executive Summary
- 2.1. Introduction
- 3. Market Dynamics
- 3.1. Introduction
- 3.2. Market Drivers
- 3.2.1. Increase in Passenger Car Sales Propelling Market Growth
- 3.3. Market Restrains
- 3.3.1. Fluctuation in Raw Material Prices
- 3.4. Market Trends
- 3.4.1. Emission Concerns and Increasing Hydrogen Bus Testing Fueling Market Demand
- 4. Market Factor Analysis
- 4.1. Porters Five Forces
- 4.2. Supply/Value Chain
- 4.3. PESTEL analysis
- 4.4. Market Entropy
- 4.5. Patent/Trademark Analysis
- 5. Global Fuel Cell Electric Bus Industry Analysis, Insights and Forecast, 2019-2031
- 5.1. Market Analysis, Insights and Forecast - by Application
- 5.1.1. Intercity
- 5.1.2. Intracity
- 5.2. Market Analysis, Insights and Forecast - by Bus Type
- 5.2.1. New Hydrogen Buses
- 5.2.2. Retrofitted Hydrogen Buses
- 5.3. Market Analysis, Insights and Forecast - by Region
- 5.3.1. North America
- 5.3.2. Europe
- 5.3.3. Asia Pacific
- 5.3.4. Rest of the World
- 5.1. Market Analysis, Insights and Forecast - by Application
- 6. North America Fuel Cell Electric Bus Industry Analysis, Insights and Forecast, 2019-2031
- 6.1. Market Analysis, Insights and Forecast - by Application
- 6.1.1. Intercity
- 6.1.2. Intracity
- 6.2. Market Analysis, Insights and Forecast - by Bus Type
- 6.2.1. New Hydrogen Buses
- 6.2.2. Retrofitted Hydrogen Buses
- 6.1. Market Analysis, Insights and Forecast - by Application
- 7. Europe Fuel Cell Electric Bus Industry Analysis, Insights and Forecast, 2019-2031
- 7.1. Market Analysis, Insights and Forecast - by Application
- 7.1.1. Intercity
- 7.1.2. Intracity
- 7.2. Market Analysis, Insights and Forecast - by Bus Type
- 7.2.1. New Hydrogen Buses
- 7.2.2. Retrofitted Hydrogen Buses
- 7.1. Market Analysis, Insights and Forecast - by Application
- 8. Asia Pacific Fuel Cell Electric Bus Industry Analysis, Insights and Forecast, 2019-2031
- 8.1. Market Analysis, Insights and Forecast - by Application
- 8.1.1. Intercity
- 8.1.2. Intracity
- 8.2. Market Analysis, Insights and Forecast - by Bus Type
- 8.2.1. New Hydrogen Buses
- 8.2.2. Retrofitted Hydrogen Buses
- 8.1. Market Analysis, Insights and Forecast - by Application
- 9. Rest of the World Fuel Cell Electric Bus Industry Analysis, Insights and Forecast, 2019-2031
- 9.1. Market Analysis, Insights and Forecast - by Application
- 9.1.1. Intercity
- 9.1.2. Intracity
- 9.2. Market Analysis, Insights and Forecast - by Bus Type
- 9.2.1. New Hydrogen Buses
- 9.2.2. Retrofitted Hydrogen Buses
- 9.1. Market Analysis, Insights and Forecast - by Application
- 10. North America Fuel Cell Electric Bus Industry Analysis, Insights and Forecast, 2019-2031
- 10.1. Market Analysis, Insights and Forecast - By Country/Sub-region
- 10.1.1 United States
- 10.1.2 Canada
- 10.1.3 Mexico
- 10.1.4 Rest of North America
- 11. Europe Fuel Cell Electric Bus Industry Analysis, Insights and Forecast, 2019-2031
- 11.1. Market Analysis, Insights and Forecast - By Country/Sub-region
- 11.1.1 Germany
- 11.1.2 United Kingdom
- 11.1.3 France
- 11.1.4 Italy
- 11.1.5 Spain
- 11.1.6 Rest of Europe
- 12. Asia Pacific Fuel Cell Electric Bus Industry Analysis, Insights and Forecast, 2019-2031
- 12.1. Market Analysis, Insights and Forecast - By Country/Sub-region
- 12.1.1 India
- 12.1.2 China
- 12.1.3 South Korea
- 12.1.4 Japan
- 12.1.5 Rest of Asia Pacific
- 13. Rest of the World Fuel Cell Electric Bus Industry Analysis, Insights and Forecast, 2019-2031
- 13.1. Market Analysis, Insights and Forecast - By Country/Sub-region
- 13.1.1 South America
- 13.1.2 Middle East and Africa
- 14. Competitive Analysis
- 14.1. Global Market Share Analysis 2024
- 14.2. Company Profiles
- 14.2.1 Ballard Power Systems
- 14.2.1.1. Overview
- 14.2.1.2. Products
- 14.2.1.3. SWOT Analysis
- 14.2.1.4. Recent Developments
- 14.2.1.5. Financials (Based on Availability)
- 14.2.2 Hino Motors Ltd
- 14.2.2.1. Overview
- 14.2.2.2. Products
- 14.2.2.3. SWOT Analysis
- 14.2.2.4. Recent Developments
- 14.2.2.5. Financials (Based on Availability)
- 14.2.3 SAFRA
- 14.2.3.1. Overview
- 14.2.3.2. Products
- 14.2.3.3. SWOT Analysis
- 14.2.3.4. Recent Developments
- 14.2.3.5. Financials (Based on Availability)
- 14.2.4 Van Hool NV
- 14.2.4.1. Overview
- 14.2.4.2. Products
- 14.2.4.3. SWOT Analysis
- 14.2.4.4. Recent Developments
- 14.2.4.5. Financials (Based on Availability)
- 14.2.5 Fuji Electric Co Ltd
- 14.2.5.1. Overview
- 14.2.5.2. Products
- 14.2.5.3. SWOT Analysis
- 14.2.5.4. Recent Developments
- 14.2.5.5. Financials (Based on Availability)
- 14.2.6 IVECO Group
- 14.2.6.1. Overview
- 14.2.6.2. Products
- 14.2.6.3. SWOT Analysis
- 14.2.6.4. Recent Developments
- 14.2.6.5. Financials (Based on Availability)
- 14.2.7 EvoBus GmbH
- 14.2.7.1. Overview
- 14.2.7.2. Products
- 14.2.7.3. SWOT Analysis
- 14.2.7.4. Recent Developments
- 14.2.7.5. Financials (Based on Availability)
- 14.2.8 NovaBus Corporation
- 14.2.8.1. Overview
- 14.2.8.2. Products
- 14.2.8.3. SWOT Analysis
- 14.2.8.4. Recent Developments
- 14.2.8.5. Financials (Based on Availability)
- 14.2.9 Tata Motors Limited
- 14.2.9.1. Overview
- 14.2.9.2. Products
- 14.2.9.3. SWOT Analysis
- 14.2.9.4. Recent Developments
- 14.2.9.5. Financials (Based on Availability)
- 14.2.10 MAN Truck & Bus SE
- 14.2.10.1. Overview
- 14.2.10.2. Products
- 14.2.10.3. SWOT Analysis
- 14.2.10.4. Recent Developments
- 14.2.10.5. Financials (Based on Availability)
- 14.2.11 SunLine Transit Agency *List Not Exhaustive
- 14.2.11.1. Overview
- 14.2.11.2. Products
- 14.2.11.3. SWOT Analysis
- 14.2.11.4. Recent Developments
- 14.2.11.5. Financials (Based on Availability)
- 14.2.12 New Flyer Industries Ltd
- 14.2.12.1. Overview
- 14.2.12.2. Products
- 14.2.12.3. SWOT Analysis
- 14.2.12.4. Recent Developments
- 14.2.12.5. Financials (Based on Availability)
- 14.2.13 Cummins Inc
- 14.2.13.1. Overview
- 14.2.13.2. Products
- 14.2.13.3. SWOT Analysis
- 14.2.13.4. Recent Developments
- 14.2.13.5. Financials (Based on Availability)
- 14.2.14 Proton Motor Fuel Cell GmbH
- 14.2.14.1. Overview
- 14.2.14.2. Products
- 14.2.14.3. SWOT Analysis
- 14.2.14.4. Recent Developments
- 14.2.14.5. Financials (Based on Availability)
- 14.2.15 Nuvera Fuel Cells LLC
- 14.2.15.1. Overview
- 14.2.15.2. Products
- 14.2.15.3. SWOT Analysis
- 14.2.15.4. Recent Developments
- 14.2.15.5. Financials (Based on Availability)
- 14.2.1 Ballard Power Systems
List of Figures
- Figure 1: Global Fuel Cell Electric Bus Industry Revenue Breakdown (Million, %) by Region 2024 & 2032
- Figure 2: North America Fuel Cell Electric Bus Industry Revenue (Million), by Country 2024 & 2032
- Figure 3: North America Fuel Cell Electric Bus Industry Revenue Share (%), by Country 2024 & 2032
- Figure 4: Europe Fuel Cell Electric Bus Industry Revenue (Million), by Country 2024 & 2032
- Figure 5: Europe Fuel Cell Electric Bus Industry Revenue Share (%), by Country 2024 & 2032
- Figure 6: Asia Pacific Fuel Cell Electric Bus Industry Revenue (Million), by Country 2024 & 2032
- Figure 7: Asia Pacific Fuel Cell Electric Bus Industry Revenue Share (%), by Country 2024 & 2032
- Figure 8: Rest of the World Fuel Cell Electric Bus Industry Revenue (Million), by Country 2024 & 2032
- Figure 9: Rest of the World Fuel Cell Electric Bus Industry Revenue Share (%), by Country 2024 & 2032
- Figure 10: North America Fuel Cell Electric Bus Industry Revenue (Million), by Application 2024 & 2032
- Figure 11: North America Fuel Cell Electric Bus Industry Revenue Share (%), by Application 2024 & 2032
- Figure 12: North America Fuel Cell Electric Bus Industry Revenue (Million), by Bus Type 2024 & 2032
- Figure 13: North America Fuel Cell Electric Bus Industry Revenue Share (%), by Bus Type 2024 & 2032
- Figure 14: North America Fuel Cell Electric Bus Industry Revenue (Million), by Country 2024 & 2032
- Figure 15: North America Fuel Cell Electric Bus Industry Revenue Share (%), by Country 2024 & 2032
- Figure 16: Europe Fuel Cell Electric Bus Industry Revenue (Million), by Application 2024 & 2032
- Figure 17: Europe Fuel Cell Electric Bus Industry Revenue Share (%), by Application 2024 & 2032
- Figure 18: Europe Fuel Cell Electric Bus Industry Revenue (Million), by Bus Type 2024 & 2032
- Figure 19: Europe Fuel Cell Electric Bus Industry Revenue Share (%), by Bus Type 2024 & 2032
- Figure 20: Europe Fuel Cell Electric Bus Industry Revenue (Million), by Country 2024 & 2032
- Figure 21: Europe Fuel Cell Electric Bus Industry Revenue Share (%), by Country 2024 & 2032
- Figure 22: Asia Pacific Fuel Cell Electric Bus Industry Revenue (Million), by Application 2024 & 2032
- Figure 23: Asia Pacific Fuel Cell Electric Bus Industry Revenue Share (%), by Application 2024 & 2032
- Figure 24: Asia Pacific Fuel Cell Electric Bus Industry Revenue (Million), by Bus Type 2024 & 2032
- Figure 25: Asia Pacific Fuel Cell Electric Bus Industry Revenue Share (%), by Bus Type 2024 & 2032
- Figure 26: Asia Pacific Fuel Cell Electric Bus Industry Revenue (Million), by Country 2024 & 2032
- Figure 27: Asia Pacific Fuel Cell Electric Bus Industry Revenue Share (%), by Country 2024 & 2032
- Figure 28: Rest of the World Fuel Cell Electric Bus Industry Revenue (Million), by Application 2024 & 2032
- Figure 29: Rest of the World Fuel Cell Electric Bus Industry Revenue Share (%), by Application 2024 & 2032
- Figure 30: Rest of the World Fuel Cell Electric Bus Industry Revenue (Million), by Bus Type 2024 & 2032
- Figure 31: Rest of the World Fuel Cell Electric Bus Industry Revenue Share (%), by Bus Type 2024 & 2032
- Figure 32: Rest of the World Fuel Cell Electric Bus Industry Revenue (Million), by Country 2024 & 2032
- Figure 33: Rest of the World Fuel Cell Electric Bus Industry Revenue Share (%), by Country 2024 & 2032
List of Tables
- Table 1: Global Fuel Cell Electric Bus Industry Revenue Million Forecast, by Region 2019 & 2032
- Table 2: Global Fuel Cell Electric Bus Industry Revenue Million Forecast, by Application 2019 & 2032
- Table 3: Global Fuel Cell Electric Bus Industry Revenue Million Forecast, by Bus Type 2019 & 2032
- Table 4: Global Fuel Cell Electric Bus Industry Revenue Million Forecast, by Region 2019 & 2032
- Table 5: Global Fuel Cell Electric Bus Industry Revenue Million Forecast, by Country 2019 & 2032
- Table 6: United States Fuel Cell Electric Bus Industry Revenue (Million) Forecast, by Application 2019 & 2032
- Table 7: Canada Fuel Cell Electric Bus Industry Revenue (Million) Forecast, by Application 2019 & 2032
- Table 8: Mexico Fuel Cell Electric Bus Industry Revenue (Million) Forecast, by Application 2019 & 2032
- Table 9: Rest of North America Fuel Cell Electric Bus Industry Revenue (Million) Forecast, by Application 2019 & 2032
- Table 10: Global Fuel Cell Electric Bus Industry Revenue Million Forecast, by Country 2019 & 2032
- Table 11: Germany Fuel Cell Electric Bus Industry Revenue (Million) Forecast, by Application 2019 & 2032
- Table 12: United Kingdom Fuel Cell Electric Bus Industry Revenue (Million) Forecast, by Application 2019 & 2032
- Table 13: France Fuel Cell Electric Bus Industry Revenue (Million) Forecast, by Application 2019 & 2032
- Table 14: Italy Fuel Cell Electric Bus Industry Revenue (Million) Forecast, by Application 2019 & 2032
- Table 15: Spain Fuel Cell Electric Bus Industry Revenue (Million) Forecast, by Application 2019 & 2032
- Table 16: Rest of Europe Fuel Cell Electric Bus Industry Revenue (Million) Forecast, by Application 2019 & 2032
- Table 17: Global Fuel Cell Electric Bus Industry Revenue Million Forecast, by Country 2019 & 2032
- Table 18: India Fuel Cell Electric Bus Industry Revenue (Million) Forecast, by Application 2019 & 2032
- Table 19: China Fuel Cell Electric Bus Industry Revenue (Million) Forecast, by Application 2019 & 2032
- Table 20: South Korea Fuel Cell Electric Bus Industry Revenue (Million) Forecast, by Application 2019 & 2032
- Table 21: Japan Fuel Cell Electric Bus Industry Revenue (Million) Forecast, by Application 2019 & 2032
- Table 22: Rest of Asia Pacific Fuel Cell Electric Bus Industry Revenue (Million) Forecast, by Application 2019 & 2032
- Table 23: Global Fuel Cell Electric Bus Industry Revenue Million Forecast, by Country 2019 & 2032
- Table 24: South America Fuel Cell Electric Bus Industry Revenue (Million) Forecast, by Application 2019 & 2032
- Table 25: Middle East and Africa Fuel Cell Electric Bus Industry Revenue (Million) Forecast, by Application 2019 & 2032
- Table 26: Global Fuel Cell Electric Bus Industry Revenue Million Forecast, by Application 2019 & 2032
- Table 27: Global Fuel Cell Electric Bus Industry Revenue Million Forecast, by Bus Type 2019 & 2032
- Table 28: Global Fuel Cell Electric Bus Industry Revenue Million Forecast, by Country 2019 & 2032
- Table 29: United States Fuel Cell Electric Bus Industry Revenue (Million) Forecast, by Application 2019 & 2032
- Table 30: Canada Fuel Cell Electric Bus Industry Revenue (Million) Forecast, by Application 2019 & 2032
- Table 31: Mexico Fuel Cell Electric Bus Industry Revenue (Million) Forecast, by Application 2019 & 2032
- Table 32: Rest of North America Fuel Cell Electric Bus Industry Revenue (Million) Forecast, by Application 2019 & 2032
- Table 33: Global Fuel Cell Electric Bus Industry Revenue Million Forecast, by Application 2019 & 2032
- Table 34: Global Fuel Cell Electric Bus Industry Revenue Million Forecast, by Bus Type 2019 & 2032
- Table 35: Global Fuel Cell Electric Bus Industry Revenue Million Forecast, by Country 2019 & 2032
- Table 36: Germany Fuel Cell Electric Bus Industry Revenue (Million) Forecast, by Application 2019 & 2032
- Table 37: United Kingdom Fuel Cell Electric Bus Industry Revenue (Million) Forecast, by Application 2019 & 2032
- Table 38: France Fuel Cell Electric Bus Industry Revenue (Million) Forecast, by Application 2019 & 2032
- Table 39: Italy Fuel Cell Electric Bus Industry Revenue (Million) Forecast, by Application 2019 & 2032
- Table 40: Spain Fuel Cell Electric Bus Industry Revenue (Million) Forecast, by Application 2019 & 2032
- Table 41: Rest of Europe Fuel Cell Electric Bus Industry Revenue (Million) Forecast, by Application 2019 & 2032
- Table 42: Global Fuel Cell Electric Bus Industry Revenue Million Forecast, by Application 2019 & 2032
- Table 43: Global Fuel Cell Electric Bus Industry Revenue Million Forecast, by Bus Type 2019 & 2032
- Table 44: Global Fuel Cell Electric Bus Industry Revenue Million Forecast, by Country 2019 & 2032
- Table 45: India Fuel Cell Electric Bus Industry Revenue (Million) Forecast, by Application 2019 & 2032
- Table 46: China Fuel Cell Electric Bus Industry Revenue (Million) Forecast, by Application 2019 & 2032
- Table 47: South Korea Fuel Cell Electric Bus Industry Revenue (Million) Forecast, by Application 2019 & 2032
- Table 48: Japan Fuel Cell Electric Bus Industry Revenue (Million) Forecast, by Application 2019 & 2032
- Table 49: Rest of Asia Pacific Fuel Cell Electric Bus Industry Revenue (Million) Forecast, by Application 2019 & 2032
- Table 50: Global Fuel Cell Electric Bus Industry Revenue Million Forecast, by Application 2019 & 2032
- Table 51: Global Fuel Cell Electric Bus Industry Revenue Million Forecast, by Bus Type 2019 & 2032
- Table 52: Global Fuel Cell Electric Bus Industry Revenue Million Forecast, by Country 2019 & 2032
- Table 53: South America Fuel Cell Electric Bus Industry Revenue (Million) Forecast, by Application 2019 & 2032
- Table 54: Middle East and Africa Fuel Cell Electric Bus Industry Revenue (Million) Forecast, by Application 2019 & 2032
Frequently Asked Questions
1. What is the projected Compound Annual Growth Rate (CAGR) of the Fuel Cell Electric Bus Industry?
The projected CAGR is approximately 28.07%.
2. Which companies are prominent players in the Fuel Cell Electric Bus Industry?
Key companies in the market include Ballard Power Systems, Hino Motors Ltd, SAFRA, Van Hool NV, Fuji Electric Co Ltd, IVECO Group, EvoBus GmbH, NovaBus Corporation, Tata Motors Limited, MAN Truck & Bus SE, SunLine Transit Agency *List Not Exhaustive, New Flyer Industries Ltd, Cummins Inc, Proton Motor Fuel Cell GmbH, Nuvera Fuel Cells LLC.
3. What are the main segments of the Fuel Cell Electric Bus Industry?
The market segments include Application, Bus Type.
4. Can you provide details about the market size?
The market size is estimated to be USD XX Million as of 2022.
5. What are some drivers contributing to market growth?
Increase in Passenger Car Sales Propelling Market Growth.
6. What are the notable trends driving market growth?
Emission Concerns and Increasing Hydrogen Bus Testing Fueling Market Demand.
7. Are there any restraints impacting market growth?
Fluctuation in Raw Material Prices.
8. Can you provide examples of recent developments in the market?
In September 2022, The Xcelsior CHARGE FC fuel cell bus model from New Flyer, which features a fuel cell module from Ballard Power Systems and a Siemens ELFA 3 driveline, was unveiled . The model is similar to the Xcelsior CHARGE H2, and it comes in both 40-foot and 60-foot lengths. Both of these models pass the Federal Transit Administration Model Bus Testing Program in Altoona, Pennsylvania.
9. What pricing options are available for accessing the report?
Pricing options include single-user, multi-user, and enterprise licenses priced at USD 4750, USD 5250, and USD 8750 respectively.
10. Is the market size provided in terms of value or volume?
The market size is provided in terms of value, measured in Million.
11. Are there any specific market keywords associated with the report?
Yes, the market keyword associated with the report is "Fuel Cell Electric Bus Industry," which aids in identifying and referencing the specific market segment covered.
12. How do I determine which pricing option suits my needs best?
The pricing options vary based on user requirements and access needs. Individual users may opt for single-user licenses, while businesses requiring broader access may choose multi-user or enterprise licenses for cost-effective access to the report.
13. Are there any additional resources or data provided in the Fuel Cell Electric Bus Industry report?
While the report offers comprehensive insights, it's advisable to review the specific contents or supplementary materials provided to ascertain if additional resources or data are available.
14. How can I stay updated on further developments or reports in the Fuel Cell Electric Bus Industry?
To stay informed about further developments, trends, and reports in the Fuel Cell Electric Bus Industry, consider subscribing to industry newsletters, following relevant companies and organizations, or regularly checking reputable industry news sources and publications.
Methodology
Step 1 - Identification of Relevant Samples Size from Population Database


Step 2 - Approaches for Defining Global Market Size (Value, Volume* & Price*)

Note*: In applicable scenarios
Step 3 - Data Sources
Primary Research
- Web Analytics
- Survey Reports
- Research Institute
- Latest Research Reports
- Opinion Leaders
Secondary Research
- Annual Reports
- White Paper
- Latest Press Release
- Industry Association
- Paid Database
- Investor Presentations

Step 4 - Data Triangulation
Involves using different sources of information in order to increase the validity of a study
These sources are likely to be stakeholders in a program - participants, other researchers, program staff, other community members, and so on.
Then we put all data in single framework & apply various statistical tools to find out the dynamic on the market.
During the analysis stage, feedback from the stakeholder groups would be compared to determine areas of agreement as well as areas of divergence


