
Key Insights
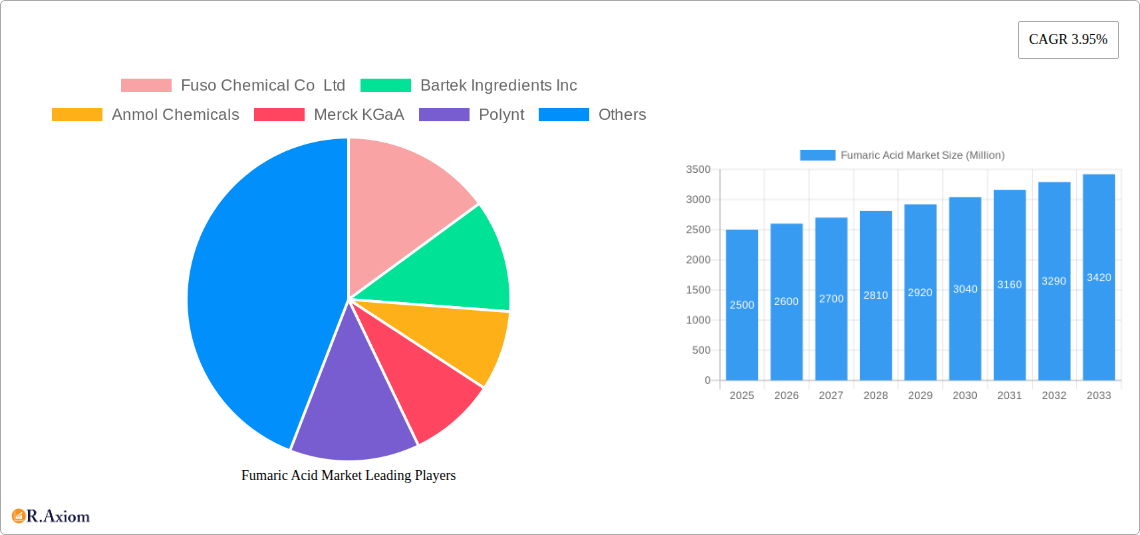
The global fumaric acid market, valued at approximately $XX million in 2025, is projected to experience steady growth with a CAGR of 3.95% from 2025 to 2033. This expansion is driven by increasing demand from various sectors, primarily food and beverages, where fumaric acid serves as an acidulant and flavor enhancer. The growing popularity of healthier food options and the rising consumption of processed foods are significant contributors to market growth. Furthermore, the use of fumaric acid in the production of unsaturated polyester resins and alkyd resins in the chemical industry also fuels market expansion. The food grade segment holds a dominant market share due to its wide-ranging applications in food and beverage products. Geographically, the Asia-Pacific region is anticipated to witness significant growth, fueled by increasing industrialization and rising disposable incomes in countries like China and India. However, factors such as price fluctuations in raw materials and the potential emergence of substitute products pose challenges to market growth. The market is highly competitive, with key players including Fuso Chemical Co Ltd, Bartek Ingredients Inc, Anmol Chemicals, and Merck KGaA, focusing on product innovation and geographical expansion to maintain market share. Strategic partnerships and collaborations also play a pivotal role in shaping the market landscape.
The forecast period (2025-2033) indicates continued growth, albeit at a possibly slightly moderated rate compared to the historical period (2019-2024). This moderation could be due to market saturation in certain segments and regions. However, the consistent demand from the food & beverage industry, coupled with potential applications in emerging sectors like personal care and pharmaceuticals, suggests continued expansion in the long term. Companies are investing in research and development to explore new applications and improve the efficiency of fumaric acid production, contributing to market sustainability. The technical grade segment is expected to see moderate growth driven by the construction and chemical industries. Regional growth will vary, with developing economies showcasing faster growth compared to mature markets, reflecting economic growth patterns and industrial development.
Fumaric Acid Market: A Comprehensive Report (2019-2033)
This in-depth report provides a comprehensive analysis of the global Fumaric Acid market, offering invaluable insights for stakeholders across the value chain. The study period covers 2019-2033, with 2025 as the base and estimated year, and a forecast period of 2025-2033. The report leverages rigorous research methodologies and data analysis to provide a detailed understanding of market dynamics, trends, and future prospects.
Fumaric Acid Market Concentration & Innovation
The Fumaric Acid market exhibits a moderately consolidated structure, with key players like Fuso Chemical Co Ltd, Bartek Ingredients Inc, Anmol Chemicals, Merck KGaA, Polynt, Yongsan Chemicals Inc, Changmao Biochem, UPC Group, XST Biological Co Ltd, Thirumalai Chemicals Ltd, and ESIM Chemicals holding significant market share. However, the presence of several smaller players indicates a competitive landscape. Market share data for 2024 suggests that the top 5 players collectively hold approximately xx% of the market.
Innovation in the Fumaric Acid market is driven by the development of higher-purity grades, specialized formulations for niche applications, and sustainable production processes. Regulatory frameworks, particularly those related to food safety and environmental regulations, significantly influence market dynamics. The market faces pressure from potential substitutes, particularly other organic acids, depending on the specific application. Ongoing M&A activities, with deal values estimated at approximately xx Million in 2024, reflect industry consolidation and expansion strategies. Trends in end-user industries, such as the increasing demand for natural and sustainable ingredients in food and beverage, are key drivers of innovation.
- Market Concentration: Moderately consolidated with top 5 players holding xx% market share (2024).
- Innovation Drivers: Higher purity grades, specialized formulations, sustainable production.
- Regulatory Impact: Food safety and environmental regulations significantly influence market.
- M&A Activity: Deal values estimated at xx Million in 2024.
Fumaric Acid Market Industry Trends & Insights
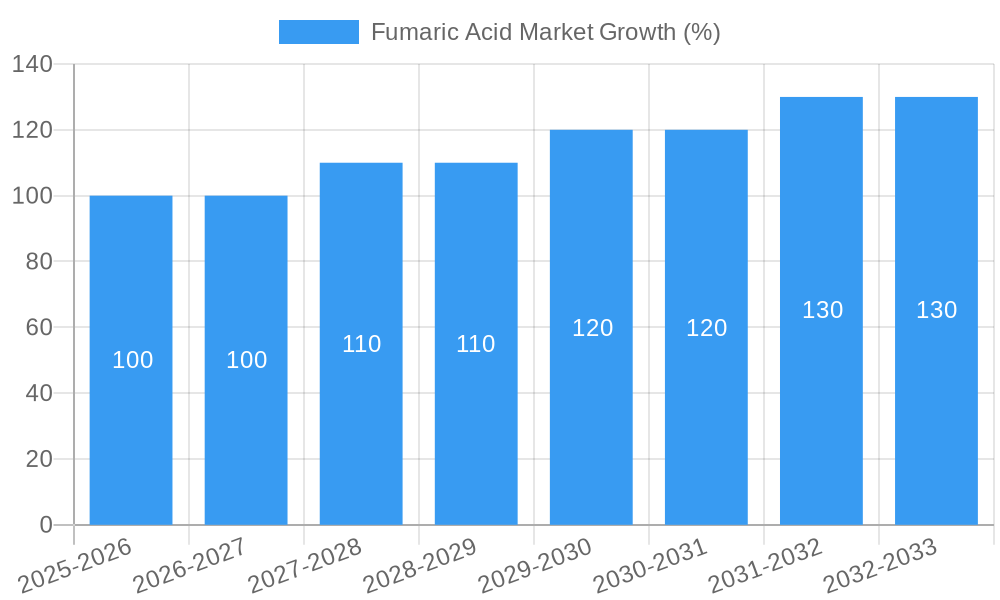
The global Fumaric Acid market is projected to experience robust growth, with a Compound Annual Growth Rate (CAGR) of xx% during the forecast period (2025-2033). This growth is fueled by several factors, including increasing demand from the food and beverage industry, the rising popularity of unsaturated polyester resins in various applications, and the growing use of fumaric acid in the pharmaceutical and personal care industries. Technological advancements in production processes, leading to improved efficiency and reduced costs, further contribute to market expansion. Consumer preferences for natural and health-conscious products are driving demand for food-grade fumaric acid. The competitive landscape is marked by intense rivalry among existing players, with new entrants constantly emerging. Market penetration in specific regions like Asia-Pacific is relatively high compared to others.
Dominant Markets & Segments in Fumaric Acid Market
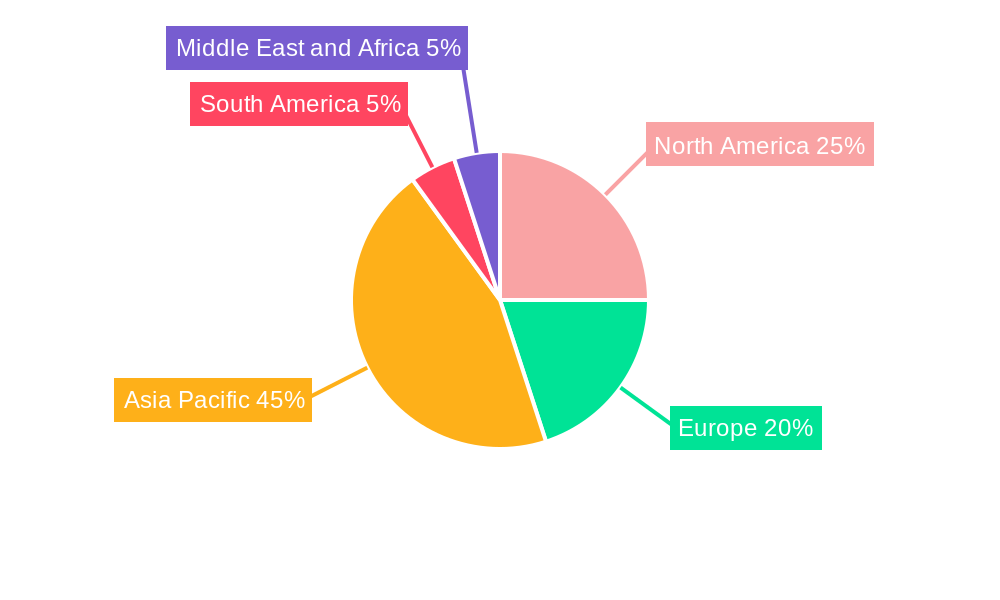
The Asia-Pacific region currently dominates the global Fumaric Acid market, driven primarily by robust economic growth, expanding food and beverage processing industries, and increasing investments in infrastructure in countries like China and India. Within the market segmentation:
Type:
- Food Grade: Holds the largest market share due to increasing demand for natural food additives.
- Technical Grade: This segment is experiencing significant growth driven by applications in resins and polymers.
Application:
- Food & Beverage Processing: The largest application segment owing to fumaric acid's use as an acidulant and flavor enhancer.
- Unsaturated Polyester Resin: Significant growth due to expanding construction and automotive industries.
End-user Industry:
- Food and Beverage: Leading end-user sector due to high demand for natural food ingredients.
- Chemical: Significant usage of technical-grade fumaric acid in the manufacturing of various chemicals.
Key Drivers (by region):
- Asia-Pacific: Rapid economic growth, expanding food and beverage industries, and infrastructure development.
- North America: Strong demand from the pharmaceutical and personal care industries.
- Europe: Stringent regulations, focus on sustainable solutions, and advanced applications drive growth.
Fumaric Acid Market Product Developments
Recent product developments focus on enhancing the purity and functionality of fumaric acid. Manufacturers are introducing specialized grades tailored to specific applications, optimizing performance and cost-effectiveness. Technological advances in fermentation processes, improving production yields and sustainability, are becoming increasingly prominent. The market is witnessing the emergence of innovative applications of fumaric acid in emerging sectors, such as biodegradable plastics and advanced materials. These developments enhance competitiveness by offering superior product attributes and expanding market access.
Report Scope & Segmentation Analysis
This report provides a detailed analysis of the Fumaric Acid market across various segments:
By Type: Food Grade, Technical Grade (each segment includes market size, growth projections, and competitive dynamics)
By Application: Food & Beverage Processing, Rosin Paper Sizing, Unsaturated Polyester Resin, Alkyd Resin, Personal Care & Cosmetics, Other Applications (each segment includes market size, growth projections, and competitive dynamics)
By End-user Industry: Food and Beverage, Cosmetics, Pharmaceutical, Chemical, Other End-user Industries (each segment includes market size, growth projections, and competitive dynamics)
This segmentation provides a granular view of market dynamics within each segment, highlighting growth opportunities and competitive landscapes.
Key Drivers of Fumaric Acid Market Growth
The growth of the Fumaric Acid market is propelled by several key factors: the increasing demand for natural and health-conscious food ingredients, the expansion of the construction and automotive industries (driving demand for unsaturated polyester resins), and advancements in the pharmaceutical and personal care sectors. Favorable regulatory frameworks promoting the use of natural additives further boost market expansion.
Challenges in the Fumaric Acid Market Sector
The Fumaric Acid market faces challenges such as price volatility of raw materials, fluctuating energy costs impacting production expenses, and intense competition among established and emerging players. Supply chain disruptions and stringent regulatory compliance requirements also pose significant hurdles to market growth, potentially impacting profit margins and limiting expansion possibilities.
Emerging Opportunities in Fumaric Acid Market
Emerging opportunities lie in exploring new applications of fumaric acid in the biodegradable plastics and advanced materials sectors. Growing demand for sustainable and eco-friendly solutions offers significant potential for market expansion. Further research and development into new applications across various industries will drive the industry forward.
Leading Players in the Fumaric Acid Market Market
- Fuso Chemical Co Ltd
- Bartek Ingredients Inc
- Anmol Chemicals
- Merck KGaA
- Polynt
- Yongsan Chemicals Inc
- Changmao Biochem
- UPC Group
- XST Biological Co Ltd
- Thirumalai Chemicals Ltd
- ESIM Chemicals
Key Developments in Fumaric Acid Market Industry
- 2023: XST Biological Co Ltd announced a significant investment in expanding its fumaric acid production capacity.
- 2022: Merck KGaA launched a new high-purity fumaric acid grade for pharmaceutical applications.
- 2021: A major merger between two significant players in the industry resulted in increased market concentration. (Further details on specific companies involved would need to be added if available).
Strategic Outlook for Fumaric Acid Market Market
The Fumaric Acid market presents considerable potential for future growth, driven by expanding applications across various sectors. Continuous innovation in production technologies and the development of new product formulations will shape future market dynamics. Strategic partnerships and collaborations between key players will be crucial in tapping into emerging markets and achieving sustainable growth. The rising demand for environmentally friendly and sustainable solutions in various industries will be a significant catalyst for future growth.
Fumaric Acid Market Segmentation
-
1. Type
- 1.1. Food Grade
- 1.2. Technical Grade
-
2. Application
- 2.1. Food & Beverage Processing
- 2.2. Rosin Paper Sizing
- 2.3. Unsaturated Polyster Resin
- 2.4. Alkyd Resin
- 2.5. Personal Care & Cosmetics
- 2.6. Other Applications
-
3. End-user Industry
- 3.1. Food and Beverage
- 3.2. Cosmetics
- 3.3. Pharmaceutical
- 3.4. Chemical
- 3.5. Other End-user Industries
Fumaric Acid Market Segmentation By Geography
-
1. Asia Pacific
- 1.1. China
- 1.2. India
- 1.3. Japan
- 1.4. South Korea
- 1.5. Rest of Asia Pacific
-
2. North America
- 2.1. United States
- 2.2. Canada
- 2.3. Mexico
-
3. Europe
- 3.1. Germany
- 3.2. United Kingdom
- 3.3. France
- 3.4. Italy
- 3.5. Rest of Europe
-
4. South America
- 4.1. Brazil
- 4.2. Argentina
- 4.3. Rest of South America
-
5. Middle East and Africa
- 5.1. South Africa
- 5.2. Saudi Arabia
- 5.3. Rest of Middle East and Africa
Fumaric Acid Market REPORT HIGHLIGHTS
| Aspects | Details |
|---|---|
| Study Period | 2019-2033 |
| Base Year | 2024 |
| Estimated Year | 2025 |
| Forecast Period | 2025-2033 |
| Historical Period | 2019-2024 |
| Growth Rate | CAGR of 3.95% from 2019-2033 |
| Segmentation |
|
Table of Contents
- 1. Introduction
- 1.1. Research Scope
- 1.2. Market Segmentation
- 1.3. Research Methodology
- 1.4. Definitions and Assumptions
- 2. Executive Summary
- 2.1. Introduction
- 3. Market Dynamics
- 3.1. Introduction
- 3.2. Market Drivers
- 3.2.1. Growing Application in the Food and Beverage Industry; Other Drivers
- 3.3. Market Restrains
- 3.3.1. Health Hazard Related to Fumaric Acid
- 3.4. Market Trends
- 3.4.1. Food and Beverage to Dominate the Demand
- 4. Market Factor Analysis
- 4.1. Porters Five Forces
- 4.2. Supply/Value Chain
- 4.3. PESTEL analysis
- 4.4. Market Entropy
- 4.5. Patent/Trademark Analysis
- 5. Global Fumaric Acid Market Analysis, Insights and Forecast, 2019-2031
- 5.1. Market Analysis, Insights and Forecast - by Type
- 5.1.1. Food Grade
- 5.1.2. Technical Grade
- 5.2. Market Analysis, Insights and Forecast - by Application
- 5.2.1. Food & Beverage Processing
- 5.2.2. Rosin Paper Sizing
- 5.2.3. Unsaturated Polyster Resin
- 5.2.4. Alkyd Resin
- 5.2.5. Personal Care & Cosmetics
- 5.2.6. Other Applications
- 5.3. Market Analysis, Insights and Forecast - by End-user Industry
- 5.3.1. Food and Beverage
- 5.3.2. Cosmetics
- 5.3.3. Pharmaceutical
- 5.3.4. Chemical
- 5.3.5. Other End-user Industries
- 5.4. Market Analysis, Insights and Forecast - by Region
- 5.4.1. Asia Pacific
- 5.4.2. North America
- 5.4.3. Europe
- 5.4.4. South America
- 5.4.5. Middle East and Africa
- 5.1. Market Analysis, Insights and Forecast - by Type
- 6. Asia Pacific Fumaric Acid Market Analysis, Insights and Forecast, 2019-2031
- 6.1. Market Analysis, Insights and Forecast - by Type
- 6.1.1. Food Grade
- 6.1.2. Technical Grade
- 6.2. Market Analysis, Insights and Forecast - by Application
- 6.2.1. Food & Beverage Processing
- 6.2.2. Rosin Paper Sizing
- 6.2.3. Unsaturated Polyster Resin
- 6.2.4. Alkyd Resin
- 6.2.5. Personal Care & Cosmetics
- 6.2.6. Other Applications
- 6.3. Market Analysis, Insights and Forecast - by End-user Industry
- 6.3.1. Food and Beverage
- 6.3.2. Cosmetics
- 6.3.3. Pharmaceutical
- 6.3.4. Chemical
- 6.3.5. Other End-user Industries
- 6.1. Market Analysis, Insights and Forecast - by Type
- 7. North America Fumaric Acid Market Analysis, Insights and Forecast, 2019-2031
- 7.1. Market Analysis, Insights and Forecast - by Type
- 7.1.1. Food Grade
- 7.1.2. Technical Grade
- 7.2. Market Analysis, Insights and Forecast - by Application
- 7.2.1. Food & Beverage Processing
- 7.2.2. Rosin Paper Sizing
- 7.2.3. Unsaturated Polyster Resin
- 7.2.4. Alkyd Resin
- 7.2.5. Personal Care & Cosmetics
- 7.2.6. Other Applications
- 7.3. Market Analysis, Insights and Forecast - by End-user Industry
- 7.3.1. Food and Beverage
- 7.3.2. Cosmetics
- 7.3.3. Pharmaceutical
- 7.3.4. Chemical
- 7.3.5. Other End-user Industries
- 7.1. Market Analysis, Insights and Forecast - by Type
- 8. Europe Fumaric Acid Market Analysis, Insights and Forecast, 2019-2031
- 8.1. Market Analysis, Insights and Forecast - by Type
- 8.1.1. Food Grade
- 8.1.2. Technical Grade
- 8.2. Market Analysis, Insights and Forecast - by Application
- 8.2.1. Food & Beverage Processing
- 8.2.2. Rosin Paper Sizing
- 8.2.3. Unsaturated Polyster Resin
- 8.2.4. Alkyd Resin
- 8.2.5. Personal Care & Cosmetics
- 8.2.6. Other Applications
- 8.3. Market Analysis, Insights and Forecast - by End-user Industry
- 8.3.1. Food and Beverage
- 8.3.2. Cosmetics
- 8.3.3. Pharmaceutical
- 8.3.4. Chemical
- 8.3.5. Other End-user Industries
- 8.1. Market Analysis, Insights and Forecast - by Type
- 9. South America Fumaric Acid Market Analysis, Insights and Forecast, 2019-2031
- 9.1. Market Analysis, Insights and Forecast - by Type
- 9.1.1. Food Grade
- 9.1.2. Technical Grade
- 9.2. Market Analysis, Insights and Forecast - by Application
- 9.2.1. Food & Beverage Processing
- 9.2.2. Rosin Paper Sizing
- 9.2.3. Unsaturated Polyster Resin
- 9.2.4. Alkyd Resin
- 9.2.5. Personal Care & Cosmetics
- 9.2.6. Other Applications
- 9.3. Market Analysis, Insights and Forecast - by End-user Industry
- 9.3.1. Food and Beverage
- 9.3.2. Cosmetics
- 9.3.3. Pharmaceutical
- 9.3.4. Chemical
- 9.3.5. Other End-user Industries
- 9.1. Market Analysis, Insights and Forecast - by Type
- 10. Middle East and Africa Fumaric Acid Market Analysis, Insights and Forecast, 2019-2031
- 10.1. Market Analysis, Insights and Forecast - by Type
- 10.1.1. Food Grade
- 10.1.2. Technical Grade
- 10.2. Market Analysis, Insights and Forecast - by Application
- 10.2.1. Food & Beverage Processing
- 10.2.2. Rosin Paper Sizing
- 10.2.3. Unsaturated Polyster Resin
- 10.2.4. Alkyd Resin
- 10.2.5. Personal Care & Cosmetics
- 10.2.6. Other Applications
- 10.3. Market Analysis, Insights and Forecast - by End-user Industry
- 10.3.1. Food and Beverage
- 10.3.2. Cosmetics
- 10.3.3. Pharmaceutical
- 10.3.4. Chemical
- 10.3.5. Other End-user Industries
- 10.1. Market Analysis, Insights and Forecast - by Type
- 11. Asia Pacific Fumaric Acid Market Analysis, Insights and Forecast, 2019-2031
- 11.1. Market Analysis, Insights and Forecast - By Country/Sub-region
- 11.1.1 China
- 11.1.2 India
- 11.1.3 Japan
- 11.1.4 South Korea
- 11.1.5 Rest of Asia Pacific
- 12. North America Fumaric Acid Market Analysis, Insights and Forecast, 2019-2031
- 12.1. Market Analysis, Insights and Forecast - By Country/Sub-region
- 12.1.1 United States
- 12.1.2 Canada
- 12.1.3 Mexico
- 13. Europe Fumaric Acid Market Analysis, Insights and Forecast, 2019-2031
- 13.1. Market Analysis, Insights and Forecast - By Country/Sub-region
- 13.1.1 Germany
- 13.1.2 United Kingdom
- 13.1.3 France
- 13.1.4 Italy
- 13.1.5 Rest of Europe
- 14. South America Fumaric Acid Market Analysis, Insights and Forecast, 2019-2031
- 14.1. Market Analysis, Insights and Forecast - By Country/Sub-region
- 14.1.1 Brazil
- 14.1.2 Argentina
- 14.1.3 Rest of South America
- 15. Middle East and Africa Fumaric Acid Market Analysis, Insights and Forecast, 2019-2031
- 15.1. Market Analysis, Insights and Forecast - By Country/Sub-region
- 15.1.1 South Africa
- 15.1.2 Saudi Arabia
- 15.1.3 Rest of Middle East and Africa
- 16. Competitive Analysis
- 16.1. Global Market Share Analysis 2024
- 16.2. Company Profiles
- 16.2.1 Fuso Chemical Co Ltd
- 16.2.1.1. Overview
- 16.2.1.2. Products
- 16.2.1.3. SWOT Analysis
- 16.2.1.4. Recent Developments
- 16.2.1.5. Financials (Based on Availability)
- 16.2.2 Bartek Ingredients Inc
- 16.2.2.1. Overview
- 16.2.2.2. Products
- 16.2.2.3. SWOT Analysis
- 16.2.2.4. Recent Developments
- 16.2.2.5. Financials (Based on Availability)
- 16.2.3 Anmol Chemicals
- 16.2.3.1. Overview
- 16.2.3.2. Products
- 16.2.3.3. SWOT Analysis
- 16.2.3.4. Recent Developments
- 16.2.3.5. Financials (Based on Availability)
- 16.2.4 Merck KGaA
- 16.2.4.1. Overview
- 16.2.4.2. Products
- 16.2.4.3. SWOT Analysis
- 16.2.4.4. Recent Developments
- 16.2.4.5. Financials (Based on Availability)
- 16.2.5 Polynt
- 16.2.5.1. Overview
- 16.2.5.2. Products
- 16.2.5.3. SWOT Analysis
- 16.2.5.4. Recent Developments
- 16.2.5.5. Financials (Based on Availability)
- 16.2.6 Yongsan Chemicals Inc
- 16.2.6.1. Overview
- 16.2.6.2. Products
- 16.2.6.3. SWOT Analysis
- 16.2.6.4. Recent Developments
- 16.2.6.5. Financials (Based on Availability)
- 16.2.7 Changmao Biochem
- 16.2.7.1. Overview
- 16.2.7.2. Products
- 16.2.7.3. SWOT Analysis
- 16.2.7.4. Recent Developments
- 16.2.7.5. Financials (Based on Availability)
- 16.2.8 UPC Group
- 16.2.8.1. Overview
- 16.2.8.2. Products
- 16.2.8.3. SWOT Analysis
- 16.2.8.4. Recent Developments
- 16.2.8.5. Financials (Based on Availability)
- 16.2.9 XST Biological Co Ltd*List Not Exhaustive
- 16.2.9.1. Overview
- 16.2.9.2. Products
- 16.2.9.3. SWOT Analysis
- 16.2.9.4. Recent Developments
- 16.2.9.5. Financials (Based on Availability)
- 16.2.10 Thirumalai Chemicals Ltd
- 16.2.10.1. Overview
- 16.2.10.2. Products
- 16.2.10.3. SWOT Analysis
- 16.2.10.4. Recent Developments
- 16.2.10.5. Financials (Based on Availability)
- 16.2.11 ESIM Chemicals
- 16.2.11.1. Overview
- 16.2.11.2. Products
- 16.2.11.3. SWOT Analysis
- 16.2.11.4. Recent Developments
- 16.2.11.5. Financials (Based on Availability)
- 16.2.1 Fuso Chemical Co Ltd
List of Figures
- Figure 1: Global Fumaric Acid Market Revenue Breakdown (Million, %) by Region 2024 & 2032
- Figure 2: Global Fumaric Acid Market Volume Breakdown (kilotons, %) by Region 2024 & 2032
- Figure 3: Asia Pacific Fumaric Acid Market Revenue (Million), by Country 2024 & 2032
- Figure 4: Asia Pacific Fumaric Acid Market Volume (kilotons), by Country 2024 & 2032
- Figure 5: Asia Pacific Fumaric Acid Market Revenue Share (%), by Country 2024 & 2032
- Figure 6: Asia Pacific Fumaric Acid Market Volume Share (%), by Country 2024 & 2032
- Figure 7: North America Fumaric Acid Market Revenue (Million), by Country 2024 & 2032
- Figure 8: North America Fumaric Acid Market Volume (kilotons), by Country 2024 & 2032
- Figure 9: North America Fumaric Acid Market Revenue Share (%), by Country 2024 & 2032
- Figure 10: North America Fumaric Acid Market Volume Share (%), by Country 2024 & 2032
- Figure 11: Europe Fumaric Acid Market Revenue (Million), by Country 2024 & 2032
- Figure 12: Europe Fumaric Acid Market Volume (kilotons), by Country 2024 & 2032
- Figure 13: Europe Fumaric Acid Market Revenue Share (%), by Country 2024 & 2032
- Figure 14: Europe Fumaric Acid Market Volume Share (%), by Country 2024 & 2032
- Figure 15: South America Fumaric Acid Market Revenue (Million), by Country 2024 & 2032
- Figure 16: South America Fumaric Acid Market Volume (kilotons), by Country 2024 & 2032
- Figure 17: South America Fumaric Acid Market Revenue Share (%), by Country 2024 & 2032
- Figure 18: South America Fumaric Acid Market Volume Share (%), by Country 2024 & 2032
- Figure 19: Middle East and Africa Fumaric Acid Market Revenue (Million), by Country 2024 & 2032
- Figure 20: Middle East and Africa Fumaric Acid Market Volume (kilotons), by Country 2024 & 2032
- Figure 21: Middle East and Africa Fumaric Acid Market Revenue Share (%), by Country 2024 & 2032
- Figure 22: Middle East and Africa Fumaric Acid Market Volume Share (%), by Country 2024 & 2032
- Figure 23: Asia Pacific Fumaric Acid Market Revenue (Million), by Type 2024 & 2032
- Figure 24: Asia Pacific Fumaric Acid Market Volume (kilotons), by Type 2024 & 2032
- Figure 25: Asia Pacific Fumaric Acid Market Revenue Share (%), by Type 2024 & 2032
- Figure 26: Asia Pacific Fumaric Acid Market Volume Share (%), by Type 2024 & 2032
- Figure 27: Asia Pacific Fumaric Acid Market Revenue (Million), by Application 2024 & 2032
- Figure 28: Asia Pacific Fumaric Acid Market Volume (kilotons), by Application 2024 & 2032
- Figure 29: Asia Pacific Fumaric Acid Market Revenue Share (%), by Application 2024 & 2032
- Figure 30: Asia Pacific Fumaric Acid Market Volume Share (%), by Application 2024 & 2032
- Figure 31: Asia Pacific Fumaric Acid Market Revenue (Million), by End-user Industry 2024 & 2032
- Figure 32: Asia Pacific Fumaric Acid Market Volume (kilotons), by End-user Industry 2024 & 2032
- Figure 33: Asia Pacific Fumaric Acid Market Revenue Share (%), by End-user Industry 2024 & 2032
- Figure 34: Asia Pacific Fumaric Acid Market Volume Share (%), by End-user Industry 2024 & 2032
- Figure 35: Asia Pacific Fumaric Acid Market Revenue (Million), by Country 2024 & 2032
- Figure 36: Asia Pacific Fumaric Acid Market Volume (kilotons), by Country 2024 & 2032
- Figure 37: Asia Pacific Fumaric Acid Market Revenue Share (%), by Country 2024 & 2032
- Figure 38: Asia Pacific Fumaric Acid Market Volume Share (%), by Country 2024 & 2032
- Figure 39: North America Fumaric Acid Market Revenue (Million), by Type 2024 & 2032
- Figure 40: North America Fumaric Acid Market Volume (kilotons), by Type 2024 & 2032
- Figure 41: North America Fumaric Acid Market Revenue Share (%), by Type 2024 & 2032
- Figure 42: North America Fumaric Acid Market Volume Share (%), by Type 2024 & 2032
- Figure 43: North America Fumaric Acid Market Revenue (Million), by Application 2024 & 2032
- Figure 44: North America Fumaric Acid Market Volume (kilotons), by Application 2024 & 2032
- Figure 45: North America Fumaric Acid Market Revenue Share (%), by Application 2024 & 2032
- Figure 46: North America Fumaric Acid Market Volume Share (%), by Application 2024 & 2032
- Figure 47: North America Fumaric Acid Market Revenue (Million), by End-user Industry 2024 & 2032
- Figure 48: North America Fumaric Acid Market Volume (kilotons), by End-user Industry 2024 & 2032
- Figure 49: North America Fumaric Acid Market Revenue Share (%), by End-user Industry 2024 & 2032
- Figure 50: North America Fumaric Acid Market Volume Share (%), by End-user Industry 2024 & 2032
- Figure 51: North America Fumaric Acid Market Revenue (Million), by Country 2024 & 2032
- Figure 52: North America Fumaric Acid Market Volume (kilotons), by Country 2024 & 2032
- Figure 53: North America Fumaric Acid Market Revenue Share (%), by Country 2024 & 2032
- Figure 54: North America Fumaric Acid Market Volume Share (%), by Country 2024 & 2032
- Figure 55: Europe Fumaric Acid Market Revenue (Million), by Type 2024 & 2032
- Figure 56: Europe Fumaric Acid Market Volume (kilotons), by Type 2024 & 2032
- Figure 57: Europe Fumaric Acid Market Revenue Share (%), by Type 2024 & 2032
- Figure 58: Europe Fumaric Acid Market Volume Share (%), by Type 2024 & 2032
- Figure 59: Europe Fumaric Acid Market Revenue (Million), by Application 2024 & 2032
- Figure 60: Europe Fumaric Acid Market Volume (kilotons), by Application 2024 & 2032
- Figure 61: Europe Fumaric Acid Market Revenue Share (%), by Application 2024 & 2032
- Figure 62: Europe Fumaric Acid Market Volume Share (%), by Application 2024 & 2032
- Figure 63: Europe Fumaric Acid Market Revenue (Million), by End-user Industry 2024 & 2032
- Figure 64: Europe Fumaric Acid Market Volume (kilotons), by End-user Industry 2024 & 2032
- Figure 65: Europe Fumaric Acid Market Revenue Share (%), by End-user Industry 2024 & 2032
- Figure 66: Europe Fumaric Acid Market Volume Share (%), by End-user Industry 2024 & 2032
- Figure 67: Europe Fumaric Acid Market Revenue (Million), by Country 2024 & 2032
- Figure 68: Europe Fumaric Acid Market Volume (kilotons), by Country 2024 & 2032
- Figure 69: Europe Fumaric Acid Market Revenue Share (%), by Country 2024 & 2032
- Figure 70: Europe Fumaric Acid Market Volume Share (%), by Country 2024 & 2032
- Figure 71: South America Fumaric Acid Market Revenue (Million), by Type 2024 & 2032
- Figure 72: South America Fumaric Acid Market Volume (kilotons), by Type 2024 & 2032
- Figure 73: South America Fumaric Acid Market Revenue Share (%), by Type 2024 & 2032
- Figure 74: South America Fumaric Acid Market Volume Share (%), by Type 2024 & 2032
- Figure 75: South America Fumaric Acid Market Revenue (Million), by Application 2024 & 2032
- Figure 76: South America Fumaric Acid Market Volume (kilotons), by Application 2024 & 2032
- Figure 77: South America Fumaric Acid Market Revenue Share (%), by Application 2024 & 2032
- Figure 78: South America Fumaric Acid Market Volume Share (%), by Application 2024 & 2032
- Figure 79: South America Fumaric Acid Market Revenue (Million), by End-user Industry 2024 & 2032
- Figure 80: South America Fumaric Acid Market Volume (kilotons), by End-user Industry 2024 & 2032
- Figure 81: South America Fumaric Acid Market Revenue Share (%), by End-user Industry 2024 & 2032
- Figure 82: South America Fumaric Acid Market Volume Share (%), by End-user Industry 2024 & 2032
- Figure 83: South America Fumaric Acid Market Revenue (Million), by Country 2024 & 2032
- Figure 84: South America Fumaric Acid Market Volume (kilotons), by Country 2024 & 2032
- Figure 85: South America Fumaric Acid Market Revenue Share (%), by Country 2024 & 2032
- Figure 86: South America Fumaric Acid Market Volume Share (%), by Country 2024 & 2032
- Figure 87: Middle East and Africa Fumaric Acid Market Revenue (Million), by Type 2024 & 2032
- Figure 88: Middle East and Africa Fumaric Acid Market Volume (kilotons), by Type 2024 & 2032
- Figure 89: Middle East and Africa Fumaric Acid Market Revenue Share (%), by Type 2024 & 2032
- Figure 90: Middle East and Africa Fumaric Acid Market Volume Share (%), by Type 2024 & 2032
- Figure 91: Middle East and Africa Fumaric Acid Market Revenue (Million), by Application 2024 & 2032
- Figure 92: Middle East and Africa Fumaric Acid Market Volume (kilotons), by Application 2024 & 2032
- Figure 93: Middle East and Africa Fumaric Acid Market Revenue Share (%), by Application 2024 & 2032
- Figure 94: Middle East and Africa Fumaric Acid Market Volume Share (%), by Application 2024 & 2032
- Figure 95: Middle East and Africa Fumaric Acid Market Revenue (Million), by End-user Industry 2024 & 2032
- Figure 96: Middle East and Africa Fumaric Acid Market Volume (kilotons), by End-user Industry 2024 & 2032
- Figure 97: Middle East and Africa Fumaric Acid Market Revenue Share (%), by End-user Industry 2024 & 2032
- Figure 98: Middle East and Africa Fumaric Acid Market Volume Share (%), by End-user Industry 2024 & 2032
- Figure 99: Middle East and Africa Fumaric Acid Market Revenue (Million), by Country 2024 & 2032
- Figure 100: Middle East and Africa Fumaric Acid Market Volume (kilotons), by Country 2024 & 2032
- Figure 101: Middle East and Africa Fumaric Acid Market Revenue Share (%), by Country 2024 & 2032
- Figure 102: Middle East and Africa Fumaric Acid Market Volume Share (%), by Country 2024 & 2032
List of Tables
- Table 1: Global Fumaric Acid Market Revenue Million Forecast, by Region 2019 & 2032
- Table 2: Global Fumaric Acid Market Volume kilotons Forecast, by Region 2019 & 2032
- Table 3: Global Fumaric Acid Market Revenue Million Forecast, by Type 2019 & 2032
- Table 4: Global Fumaric Acid Market Volume kilotons Forecast, by Type 2019 & 2032
- Table 5: Global Fumaric Acid Market Revenue Million Forecast, by Application 2019 & 2032
- Table 6: Global Fumaric Acid Market Volume kilotons Forecast, by Application 2019 & 2032
- Table 7: Global Fumaric Acid Market Revenue Million Forecast, by End-user Industry 2019 & 2032
- Table 8: Global Fumaric Acid Market Volume kilotons Forecast, by End-user Industry 2019 & 2032
- Table 9: Global Fumaric Acid Market Revenue Million Forecast, by Region 2019 & 2032
- Table 10: Global Fumaric Acid Market Volume kilotons Forecast, by Region 2019 & 2032
- Table 11: Global Fumaric Acid Market Revenue Million Forecast, by Country 2019 & 2032
- Table 12: Global Fumaric Acid Market Volume kilotons Forecast, by Country 2019 & 2032
- Table 13: China Fumaric Acid Market Revenue (Million) Forecast, by Application 2019 & 2032
- Table 14: China Fumaric Acid Market Volume (kilotons) Forecast, by Application 2019 & 2032
- Table 15: India Fumaric Acid Market Revenue (Million) Forecast, by Application 2019 & 2032
- Table 16: India Fumaric Acid Market Volume (kilotons) Forecast, by Application 2019 & 2032
- Table 17: Japan Fumaric Acid Market Revenue (Million) Forecast, by Application 2019 & 2032
- Table 18: Japan Fumaric Acid Market Volume (kilotons) Forecast, by Application 2019 & 2032
- Table 19: South Korea Fumaric Acid Market Revenue (Million) Forecast, by Application 2019 & 2032
- Table 20: South Korea Fumaric Acid Market Volume (kilotons) Forecast, by Application 2019 & 2032
- Table 21: Rest of Asia Pacific Fumaric Acid Market Revenue (Million) Forecast, by Application 2019 & 2032
- Table 22: Rest of Asia Pacific Fumaric Acid Market Volume (kilotons) Forecast, by Application 2019 & 2032
- Table 23: Global Fumaric Acid Market Revenue Million Forecast, by Country 2019 & 2032
- Table 24: Global Fumaric Acid Market Volume kilotons Forecast, by Country 2019 & 2032
- Table 25: United States Fumaric Acid Market Revenue (Million) Forecast, by Application 2019 & 2032
- Table 26: United States Fumaric Acid Market Volume (kilotons) Forecast, by Application 2019 & 2032
- Table 27: Canada Fumaric Acid Market Revenue (Million) Forecast, by Application 2019 & 2032
- Table 28: Canada Fumaric Acid Market Volume (kilotons) Forecast, by Application 2019 & 2032
- Table 29: Mexico Fumaric Acid Market Revenue (Million) Forecast, by Application 2019 & 2032
- Table 30: Mexico Fumaric Acid Market Volume (kilotons) Forecast, by Application 2019 & 2032
- Table 31: Global Fumaric Acid Market Revenue Million Forecast, by Country 2019 & 2032
- Table 32: Global Fumaric Acid Market Volume kilotons Forecast, by Country 2019 & 2032
- Table 33: Germany Fumaric Acid Market Revenue (Million) Forecast, by Application 2019 & 2032
- Table 34: Germany Fumaric Acid Market Volume (kilotons) Forecast, by Application 2019 & 2032
- Table 35: United Kingdom Fumaric Acid Market Revenue (Million) Forecast, by Application 2019 & 2032
- Table 36: United Kingdom Fumaric Acid Market Volume (kilotons) Forecast, by Application 2019 & 2032
- Table 37: France Fumaric Acid Market Revenue (Million) Forecast, by Application 2019 & 2032
- Table 38: France Fumaric Acid Market Volume (kilotons) Forecast, by Application 2019 & 2032
- Table 39: Italy Fumaric Acid Market Revenue (Million) Forecast, by Application 2019 & 2032
- Table 40: Italy Fumaric Acid Market Volume (kilotons) Forecast, by Application 2019 & 2032
- Table 41: Rest of Europe Fumaric Acid Market Revenue (Million) Forecast, by Application 2019 & 2032
- Table 42: Rest of Europe Fumaric Acid Market Volume (kilotons) Forecast, by Application 2019 & 2032
- Table 43: Global Fumaric Acid Market Revenue Million Forecast, by Country 2019 & 2032
- Table 44: Global Fumaric Acid Market Volume kilotons Forecast, by Country 2019 & 2032
- Table 45: Brazil Fumaric Acid Market Revenue (Million) Forecast, by Application 2019 & 2032
- Table 46: Brazil Fumaric Acid Market Volume (kilotons) Forecast, by Application 2019 & 2032
- Table 47: Argentina Fumaric Acid Market Revenue (Million) Forecast, by Application 2019 & 2032
- Table 48: Argentina Fumaric Acid Market Volume (kilotons) Forecast, by Application 2019 & 2032
- Table 49: Rest of South America Fumaric Acid Market Revenue (Million) Forecast, by Application 2019 & 2032
- Table 50: Rest of South America Fumaric Acid Market Volume (kilotons) Forecast, by Application 2019 & 2032
- Table 51: Global Fumaric Acid Market Revenue Million Forecast, by Country 2019 & 2032
- Table 52: Global Fumaric Acid Market Volume kilotons Forecast, by Country 2019 & 2032
- Table 53: South Africa Fumaric Acid Market Revenue (Million) Forecast, by Application 2019 & 2032
- Table 54: South Africa Fumaric Acid Market Volume (kilotons) Forecast, by Application 2019 & 2032
- Table 55: Saudi Arabia Fumaric Acid Market Revenue (Million) Forecast, by Application 2019 & 2032
- Table 56: Saudi Arabia Fumaric Acid Market Volume (kilotons) Forecast, by Application 2019 & 2032
- Table 57: Rest of Middle East and Africa Fumaric Acid Market Revenue (Million) Forecast, by Application 2019 & 2032
- Table 58: Rest of Middle East and Africa Fumaric Acid Market Volume (kilotons) Forecast, by Application 2019 & 2032
- Table 59: Global Fumaric Acid Market Revenue Million Forecast, by Type 2019 & 2032
- Table 60: Global Fumaric Acid Market Volume kilotons Forecast, by Type 2019 & 2032
- Table 61: Global Fumaric Acid Market Revenue Million Forecast, by Application 2019 & 2032
- Table 62: Global Fumaric Acid Market Volume kilotons Forecast, by Application 2019 & 2032
- Table 63: Global Fumaric Acid Market Revenue Million Forecast, by End-user Industry 2019 & 2032
- Table 64: Global Fumaric Acid Market Volume kilotons Forecast, by End-user Industry 2019 & 2032
- Table 65: Global Fumaric Acid Market Revenue Million Forecast, by Country 2019 & 2032
- Table 66: Global Fumaric Acid Market Volume kilotons Forecast, by Country 2019 & 2032
- Table 67: China Fumaric Acid Market Revenue (Million) Forecast, by Application 2019 & 2032
- Table 68: China Fumaric Acid Market Volume (kilotons) Forecast, by Application 2019 & 2032
- Table 69: India Fumaric Acid Market Revenue (Million) Forecast, by Application 2019 & 2032
- Table 70: India Fumaric Acid Market Volume (kilotons) Forecast, by Application 2019 & 2032
- Table 71: Japan Fumaric Acid Market Revenue (Million) Forecast, by Application 2019 & 2032
- Table 72: Japan Fumaric Acid Market Volume (kilotons) Forecast, by Application 2019 & 2032
- Table 73: South Korea Fumaric Acid Market Revenue (Million) Forecast, by Application 2019 & 2032
- Table 74: South Korea Fumaric Acid Market Volume (kilotons) Forecast, by Application 2019 & 2032
- Table 75: Rest of Asia Pacific Fumaric Acid Market Revenue (Million) Forecast, by Application 2019 & 2032
- Table 76: Rest of Asia Pacific Fumaric Acid Market Volume (kilotons) Forecast, by Application 2019 & 2032
- Table 77: Global Fumaric Acid Market Revenue Million Forecast, by Type 2019 & 2032
- Table 78: Global Fumaric Acid Market Volume kilotons Forecast, by Type 2019 & 2032
- Table 79: Global Fumaric Acid Market Revenue Million Forecast, by Application 2019 & 2032
- Table 80: Global Fumaric Acid Market Volume kilotons Forecast, by Application 2019 & 2032
- Table 81: Global Fumaric Acid Market Revenue Million Forecast, by End-user Industry 2019 & 2032
- Table 82: Global Fumaric Acid Market Volume kilotons Forecast, by End-user Industry 2019 & 2032
- Table 83: Global Fumaric Acid Market Revenue Million Forecast, by Country 2019 & 2032
- Table 84: Global Fumaric Acid Market Volume kilotons Forecast, by Country 2019 & 2032
- Table 85: United States Fumaric Acid Market Revenue (Million) Forecast, by Application 2019 & 2032
- Table 86: United States Fumaric Acid Market Volume (kilotons) Forecast, by Application 2019 & 2032
- Table 87: Canada Fumaric Acid Market Revenue (Million) Forecast, by Application 2019 & 2032
- Table 88: Canada Fumaric Acid Market Volume (kilotons) Forecast, by Application 2019 & 2032
- Table 89: Mexico Fumaric Acid Market Revenue (Million) Forecast, by Application 2019 & 2032
- Table 90: Mexico Fumaric Acid Market Volume (kilotons) Forecast, by Application 2019 & 2032
- Table 91: Global Fumaric Acid Market Revenue Million Forecast, by Type 2019 & 2032
- Table 92: Global Fumaric Acid Market Volume kilotons Forecast, by Type 2019 & 2032
- Table 93: Global Fumaric Acid Market Revenue Million Forecast, by Application 2019 & 2032
- Table 94: Global Fumaric Acid Market Volume kilotons Forecast, by Application 2019 & 2032
- Table 95: Global Fumaric Acid Market Revenue Million Forecast, by End-user Industry 2019 & 2032
- Table 96: Global Fumaric Acid Market Volume kilotons Forecast, by End-user Industry 2019 & 2032
- Table 97: Global Fumaric Acid Market Revenue Million Forecast, by Country 2019 & 2032
- Table 98: Global Fumaric Acid Market Volume kilotons Forecast, by Country 2019 & 2032
- Table 99: Germany Fumaric Acid Market Revenue (Million) Forecast, by Application 2019 & 2032
- Table 100: Germany Fumaric Acid Market Volume (kilotons) Forecast, by Application 2019 & 2032
- Table 101: United Kingdom Fumaric Acid Market Revenue (Million) Forecast, by Application 2019 & 2032
- Table 102: United Kingdom Fumaric Acid Market Volume (kilotons) Forecast, by Application 2019 & 2032
- Table 103: France Fumaric Acid Market Revenue (Million) Forecast, by Application 2019 & 2032
- Table 104: France Fumaric Acid Market Volume (kilotons) Forecast, by Application 2019 & 2032
- Table 105: Italy Fumaric Acid Market Revenue (Million) Forecast, by Application 2019 & 2032
- Table 106: Italy Fumaric Acid Market Volume (kilotons) Forecast, by Application 2019 & 2032
- Table 107: Rest of Europe Fumaric Acid Market Revenue (Million) Forecast, by Application 2019 & 2032
- Table 108: Rest of Europe Fumaric Acid Market Volume (kilotons) Forecast, by Application 2019 & 2032
- Table 109: Global Fumaric Acid Market Revenue Million Forecast, by Type 2019 & 2032
- Table 110: Global Fumaric Acid Market Volume kilotons Forecast, by Type 2019 & 2032
- Table 111: Global Fumaric Acid Market Revenue Million Forecast, by Application 2019 & 2032
- Table 112: Global Fumaric Acid Market Volume kilotons Forecast, by Application 2019 & 2032
- Table 113: Global Fumaric Acid Market Revenue Million Forecast, by End-user Industry 2019 & 2032
- Table 114: Global Fumaric Acid Market Volume kilotons Forecast, by End-user Industry 2019 & 2032
- Table 115: Global Fumaric Acid Market Revenue Million Forecast, by Country 2019 & 2032
- Table 116: Global Fumaric Acid Market Volume kilotons Forecast, by Country 2019 & 2032
- Table 117: Brazil Fumaric Acid Market Revenue (Million) Forecast, by Application 2019 & 2032
- Table 118: Brazil Fumaric Acid Market Volume (kilotons) Forecast, by Application 2019 & 2032
- Table 119: Argentina Fumaric Acid Market Revenue (Million) Forecast, by Application 2019 & 2032
- Table 120: Argentina Fumaric Acid Market Volume (kilotons) Forecast, by Application 2019 & 2032
- Table 121: Rest of South America Fumaric Acid Market Revenue (Million) Forecast, by Application 2019 & 2032
- Table 122: Rest of South America Fumaric Acid Market Volume (kilotons) Forecast, by Application 2019 & 2032
- Table 123: Global Fumaric Acid Market Revenue Million Forecast, by Type 2019 & 2032
- Table 124: Global Fumaric Acid Market Volume kilotons Forecast, by Type 2019 & 2032
- Table 125: Global Fumaric Acid Market Revenue Million Forecast, by Application 2019 & 2032
- Table 126: Global Fumaric Acid Market Volume kilotons Forecast, by Application 2019 & 2032
- Table 127: Global Fumaric Acid Market Revenue Million Forecast, by End-user Industry 2019 & 2032
- Table 128: Global Fumaric Acid Market Volume kilotons Forecast, by End-user Industry 2019 & 2032
- Table 129: Global Fumaric Acid Market Revenue Million Forecast, by Country 2019 & 2032
- Table 130: Global Fumaric Acid Market Volume kilotons Forecast, by Country 2019 & 2032
- Table 131: South Africa Fumaric Acid Market Revenue (Million) Forecast, by Application 2019 & 2032
- Table 132: South Africa Fumaric Acid Market Volume (kilotons) Forecast, by Application 2019 & 2032
- Table 133: Saudi Arabia Fumaric Acid Market Revenue (Million) Forecast, by Application 2019 & 2032
- Table 134: Saudi Arabia Fumaric Acid Market Volume (kilotons) Forecast, by Application 2019 & 2032
- Table 135: Rest of Middle East and Africa Fumaric Acid Market Revenue (Million) Forecast, by Application 2019 & 2032
- Table 136: Rest of Middle East and Africa Fumaric Acid Market Volume (kilotons) Forecast, by Application 2019 & 2032
Frequently Asked Questions
1. What is the projected Compound Annual Growth Rate (CAGR) of the Fumaric Acid Market?
The projected CAGR is approximately 3.95%.
2. Which companies are prominent players in the Fumaric Acid Market?
Key companies in the market include Fuso Chemical Co Ltd, Bartek Ingredients Inc, Anmol Chemicals, Merck KGaA, Polynt, Yongsan Chemicals Inc, Changmao Biochem, UPC Group, XST Biological Co Ltd*List Not Exhaustive, Thirumalai Chemicals Ltd, ESIM Chemicals.
3. What are the main segments of the Fumaric Acid Market?
The market segments include Type, Application, End-user Industry.
4. Can you provide details about the market size?
The market size is estimated to be USD XX Million as of 2022.
5. What are some drivers contributing to market growth?
Growing Application in the Food and Beverage Industry; Other Drivers.
6. What are the notable trends driving market growth?
Food and Beverage to Dominate the Demand.
7. Are there any restraints impacting market growth?
Health Hazard Related to Fumaric Acid.
8. Can you provide examples of recent developments in the market?
N/A
9. What pricing options are available for accessing the report?
Pricing options include single-user, multi-user, and enterprise licenses priced at USD 4750, USD 5250, and USD 8750 respectively.
10. Is the market size provided in terms of value or volume?
The market size is provided in terms of value, measured in Million and volume, measured in kilotons.
11. Are there any specific market keywords associated with the report?
Yes, the market keyword associated with the report is "Fumaric Acid Market," which aids in identifying and referencing the specific market segment covered.
12. How do I determine which pricing option suits my needs best?
The pricing options vary based on user requirements and access needs. Individual users may opt for single-user licenses, while businesses requiring broader access may choose multi-user or enterprise licenses for cost-effective access to the report.
13. Are there any additional resources or data provided in the Fumaric Acid Market report?
While the report offers comprehensive insights, it's advisable to review the specific contents or supplementary materials provided to ascertain if additional resources or data are available.
14. How can I stay updated on further developments or reports in the Fumaric Acid Market?
To stay informed about further developments, trends, and reports in the Fumaric Acid Market, consider subscribing to industry newsletters, following relevant companies and organizations, or regularly checking reputable industry news sources and publications.
Methodology
Step 1 - Identification of Relevant Samples Size from Population Database


Step 2 - Approaches for Defining Global Market Size (Value, Volume* & Price*)

Note*: In applicable scenarios
Step 3 - Data Sources
Primary Research
- Web Analytics
- Survey Reports
- Research Institute
- Latest Research Reports
- Opinion Leaders
Secondary Research
- Annual Reports
- White Paper
- Latest Press Release
- Industry Association
- Paid Database
- Investor Presentations

Step 4 - Data Triangulation
Involves using different sources of information in order to increase the validity of a study
These sources are likely to be stakeholders in a program - participants, other researchers, program staff, other community members, and so on.
Then we put all data in single framework & apply various statistical tools to find out the dynamic on the market.
During the analysis stage, feedback from the stakeholder groups would be compared to determine areas of agreement as well as areas of divergence


