
Key Insights
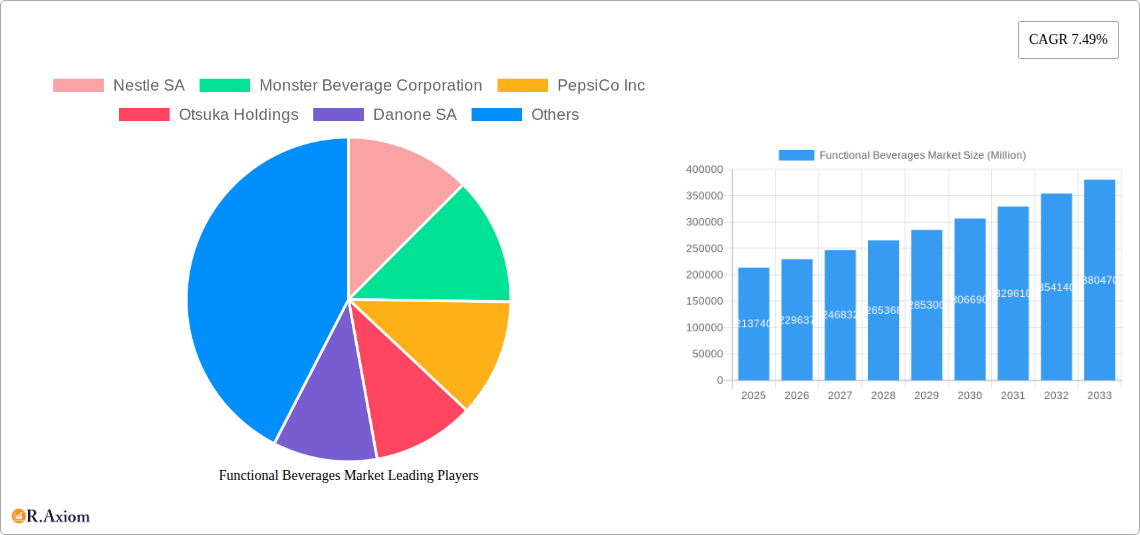
The global functional beverage market, valued at $213.74 billion in 2025, is projected to experience robust growth, driven by increasing health consciousness among consumers and the rising prevalence of lifestyle diseases. This expanding market encompasses a diverse range of products, including energy drinks, sports drinks, fortified juices, dairy and dairy alternative beverages, and functional/fortified waters. Key drivers include the growing demand for convenient and nutritious options, the increasing popularity of plant-based alternatives, and the rising adoption of active lifestyles. Consumer preference for natural ingredients and clean labels is also fueling market expansion. Distribution channels are diversifying, with online retail experiencing significant growth alongside traditional supermarkets, pharmacies, and convenience stores. While pricing pressures and intense competition among established players like Nestle, PepsiCo, and Red Bull pose challenges, the market's growth trajectory remains positive, fueled by ongoing innovation in product development and targeted marketing strategies towards health-conscious consumers.
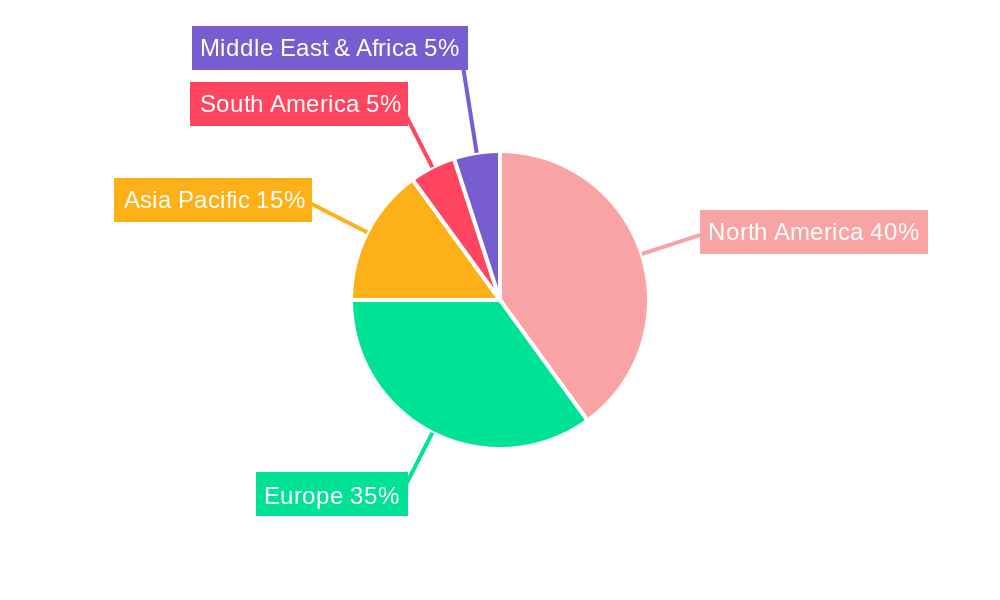
The market's segmentation reveals significant opportunities. The energy drink segment benefits from a strong existing consumer base, although concerns over sugar content necessitate reformulation. Sports drinks, while established, will continue to leverage advancements in hydration and electrolyte replenishment. Fortified juices and dairy/dairy alternatives see growth driven by health-conscious consumers seeking added nutritional value and plant-based options. Functional water, in particular, presents significant future potential due to its convenience and growing awareness of the importance of hydration. Geographic variations exist, with North America and Europe currently dominating the market; however, the Asia-Pacific region exhibits substantial growth potential due to increasing disposable incomes and a burgeoning middle class. Sustained expansion throughout the forecast period (2025-2033) will depend on consistent product innovation, effective marketing highlighting health benefits, and navigating the complexities of international regulations and consumer preferences across various regions.
This detailed report provides a comprehensive analysis of the global functional beverages market, encompassing market size, growth projections, segment analysis, competitive landscape, and key industry trends from 2019 to 2033. The report leverages extensive primary and secondary research to offer actionable insights for stakeholders, including manufacturers, distributors, investors, and market entrants. The study period covers 2019-2033, with 2025 as the base year and estimated year. The forecast period is 2025-2033, and the historical period is 2019-2024.
Functional Beverages Market Concentration & Innovation
This section analyzes the competitive intensity of the functional beverages market, examining market concentration, innovation drivers, regulatory frameworks, product substitutes, end-user trends, and merger & acquisition (M&A) activities.
The market exhibits a moderately concentrated structure with key players like Nestle SA, Monster Beverage Corporation, PepsiCo Inc., and Red Bull GmbH holding significant market share. However, the presence of numerous smaller players, particularly in niche segments, suggests a dynamic competitive environment. The market share of the top 5 players is estimated to be xx% in 2025. Innovation is a key driver, with companies constantly developing new product formulations, flavors, and packaging to cater to evolving consumer preferences and health concerns. Regulatory frameworks concerning labeling, ingredients, and health claims significantly impact market dynamics. The increasing demand for healthier alternatives, such as plant-based beverages, is driving the growth of substitutes. Consumer trends are focused on natural ingredients, sustainability, and convenience. The M&A activity in the sector has been significant, with deal values exceeding xx Million in the past five years. Notable deals have involved [Insert details of specific M&A deals if available, otherwise indicate "Data not available"].
- Key Metrics:
- Market share of top 5 players: xx% (2025)
- Total M&A deal value (2019-2024): xx Million
- Average deal size: xx Million
Functional Beverages Market Industry Trends & Insights
This section delves into the key trends shaping the functional beverages market, focusing on growth drivers, technological disruptions, evolving consumer preferences, and the competitive landscape.
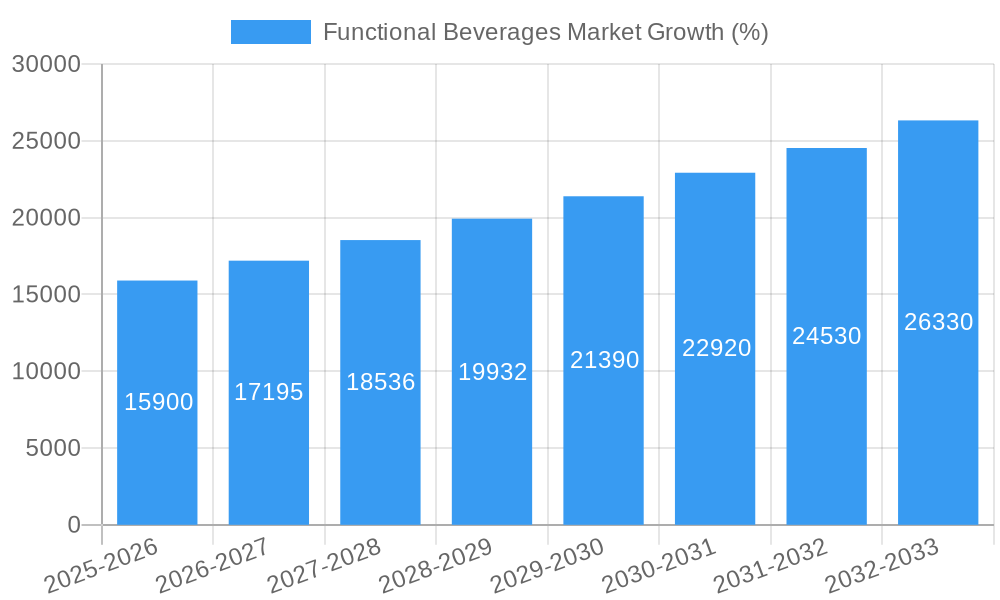
The global functional beverages market is experiencing robust growth, driven by rising health consciousness among consumers, increasing disposable incomes in emerging economies, and the proliferation of innovative products. The market's compound annual growth rate (CAGR) is projected to be xx% during the forecast period (2025-2033). Technological advancements in areas such as packaging, ingredient sourcing, and product formulation are revolutionizing the market. Consumers are increasingly demanding natural, organic, and ethically sourced ingredients, while seeking convenience and portability. The competitive landscape is highly dynamic, with both established players and new entrants constantly vying for market share through product innovation, strategic partnerships, and aggressive marketing campaigns. Market penetration of functional beverages is expected to reach xx% by 2033.
Dominant Markets & Segments in Functional Beverages Market
This section identifies the leading regions, countries, and segments within the functional beverages market, based on Type (Energy Drinks, Sports Drinks, Fortified Juice, Dairy and Dairy Alternative Beverage, Functional/Fortified Water) and Distribution Channel (Supermarkets/Hypermarkets, Pharmacies/Health Stores, Convenience Stores, Online Retail Stores, Other Distribution Channels).
Dominant Segments:
- By Type: Energy drinks currently hold the largest market share due to high demand and wide distribution. The Dairy and Dairy Alternative Beverage segment is expected to witness significant growth due to rising health consciousness.
- By Distribution Channel: Supermarkets/Hypermarkets remain the dominant distribution channel, due to high consumer reach. However, online retail stores are experiencing rapid growth, driven by e-commerce expansion.
Key Drivers of Dominance:
North America & Europe: High disposable incomes, strong health awareness, and established distribution networks contribute to their dominance.
Asia-Pacific: Rapid economic growth, rising middle class, and increasing health consciousness are driving market expansion.
Bullet Points (Key Drivers):
- Economic Growth: Rising disposable incomes in emerging markets fuel demand for premium functional beverages.
- Health & Wellness Trends: Growing awareness of health and wellness benefits drives consumption.
- Product Innovation: Continuous introduction of new flavors, ingredients, and formats caters to evolving consumer preferences.
- Effective Marketing: Aggressive marketing campaigns increase brand awareness and drive sales.
- Infrastructure Development: Improved logistics and distribution networks facilitate market expansion.
Functional Beverages Market Product Developments
Recent years have witnessed significant product innovation in the functional beverages market, with a focus on natural ingredients, enhanced nutritional value, and convenient formats. Companies are leveraging technological advancements to create healthier, more appealing products. For instance, the increasing use of plant-based ingredients, such as almond milk and oat milk, in dairy alternatives is a significant trend. The development of innovative packaging solutions, such as shelf-stable pouches and recyclable containers, addresses sustainability concerns and consumer preferences. These developments enhance product appeal and provide competitive advantages, driving market growth.
Report Scope & Segmentation Analysis
This report segments the functional beverages market by type and distribution channel.
By Type: The market is segmented into Energy Drinks, Sports Drinks, Fortified Juice, Dairy and Dairy Alternative Beverages, and Functional/Fortified Water. Each segment exhibits distinct growth trajectories and competitive dynamics. For example, the energy drinks segment is characterized by intense competition, while the dairy and dairy alternative beverages segment showcases strong growth potential.
By Distribution Channel: The market is segmented into Supermarkets/Hypermarkets, Pharmacies/Health Stores, Convenience Stores, Online Retail Stores, and Other Distribution Channels. Each channel's growth rate and market share vary, with supermarkets/hypermarkets maintaining the highest market share, while online channels show rapid growth.
Key Drivers of Functional Beverages Market Growth
The functional beverages market is fueled by several key drivers, including the growing health-conscious consumer base, rising demand for convenient and nutritious beverages, and ongoing product innovation. Economic factors, such as rising disposable incomes, particularly in emerging economies, also contribute to market expansion. Furthermore, favorable government regulations and supportive policies aimed at promoting healthier food and beverage options bolster market growth. Technological advancements in food processing and packaging also play a crucial role in creating innovative products that meet evolving consumer needs.
Challenges in the Functional Beverages Market Sector
The functional beverages market faces several challenges, including intense competition, fluctuating raw material prices, and stringent regulatory requirements concerning labeling and ingredient claims. Supply chain disruptions can impact production and distribution, leading to price volatility. Maintaining a balance between product innovation and cost-effectiveness is crucial for sustained growth. These challenges require companies to adopt robust strategies for supply chain management, product diversification, and regulatory compliance.
Emerging Opportunities in Functional Beverages Market
Emerging opportunities in the functional beverages market include the growing demand for personalized and customized beverages, the rise of plant-based and organic options, and the increasing adoption of sustainable packaging solutions. Expansion into new and underserved markets presents significant growth potential. The integration of technology, such as smart packaging and personalized nutrition recommendations, can enhance the consumer experience and drive innovation.
Leading Players in the Functional Beverages Market Market
- Nestle SA (Nestle SA)
- Monster Beverage Corporation (Monster Beverage Corporation)
- PepsiCo Inc. (PepsiCo Inc.)
- Otsuka Holdings (Otsuka Holdings)
- Danone SA (Danone SA)
- Suntory Holdings Limited (Suntory Holdings Limited)
- Red Bull GmbH (Red Bull GmbH)
- Blue Diamond Growers (Blue Diamond Growers)
- The Coca-Cola Company (The Coca-Cola Company)
- Oatly Group AB (Oatly Group AB) *List Not Exhaustive
Key Developments in Functional Beverages Market Industry
- October 2023: Tropicana launched two new smoothie flavors (Pineapple & Mango, Strawberry & Banana) with Vitamin C in India, across all distribution channels.
- August 2023: Brisk partnered with TikTok influencers to launch new iced tea products in Canada and other regions.
- March 2023: Dole launched new functional beverage products (100% Pineapple Juice, Pineapple Mango Juice, Dole Digestive Bliss Fruit Juice) claiming 100% fruit content.
Strategic Outlook for Functional Beverages Market Market
The functional beverages market is poised for continued growth, driven by evolving consumer preferences, technological advancements, and favorable regulatory environments. The market's future potential lies in tapping into emerging trends such as personalization, sustainability, and the increasing demand for convenient, healthy, and functional beverages. Companies that effectively adapt to these trends and leverage technological innovations will be well-positioned for success in this dynamic market.
Functional Beverages Market Segmentation
-
1. Type
- 1.1. Energy Drinks
- 1.2. Sports Drinks
- 1.3. Fortified Juice
- 1.4. Dairy and Dairy Alternative Beverage
- 1.5. Functional/Fortified Water
-
2. Distribution Channel
- 2.1. Supermarkets/Hypermarkets
- 2.2. Pharmacies/Health Stores
- 2.3. Convenience Stores
- 2.4. Online Retail Stores
- 2.5. Other Distribution Channels
Functional Beverages Market Segmentation By Geography
-
1. North America
- 1.1. United States
- 1.2. Canada
- 1.3. Mexico
- 1.4. Rest of North America
-
2. Europe
- 2.1. United Kingdom
- 2.2. Germany
- 2.3. France
- 2.4. Russia
- 2.5. Italy
- 2.6. Spain
- 2.7. Rest of Europe
-
3. Asia Pacific
- 3.1. India
- 3.2. China
- 3.3. Japan
- 3.4. Australia
- 3.5. Rest of Asia Pacific
-
4. South America
- 4.1. Brazil
- 4.2. Argentina
- 4.3. Rest of South America
- 5. Middle East
-
6. South Africa
- 6.1. Saudi Arabia
- 6.2. Rest of Middle East
Functional Beverages Market REPORT HIGHLIGHTS
| Aspects | Details |
|---|---|
| Study Period | 2019-2033 |
| Base Year | 2024 |
| Estimated Year | 2025 |
| Forecast Period | 2025-2033 |
| Historical Period | 2019-2024 |
| Growth Rate | CAGR of 7.49% from 2019-2033 |
| Segmentation |
|
Table of Contents
- 1. Introduction
- 1.1. Research Scope
- 1.2. Market Segmentation
- 1.3. Research Methodology
- 1.4. Definitions and Assumptions
- 2. Executive Summary
- 2.1. Introduction
- 3. Market Dynamics
- 3.1. Introduction
- 3.2. Market Drivers
- 3.2.1. Growing Consumer Inclination Toward Low-sugar/Sugar-free Beverages; Expenditure on Advertisement and Promotional Activities
- 3.3. Market Restrains
- 3.3.1. Concerns Over Health Issues Associated with Functional Beverages
- 3.4. Market Trends
- 3.4.1. Inclination Toward Dairy and Dairy Alternative Beverages
- 4. Market Factor Analysis
- 4.1. Porters Five Forces
- 4.2. Supply/Value Chain
- 4.3. PESTEL analysis
- 4.4. Market Entropy
- 4.5. Patent/Trademark Analysis
- 5. Global Functional Beverages Market Analysis, Insights and Forecast, 2019-2031
- 5.1. Market Analysis, Insights and Forecast - by Type
- 5.1.1. Energy Drinks
- 5.1.2. Sports Drinks
- 5.1.3. Fortified Juice
- 5.1.4. Dairy and Dairy Alternative Beverage
- 5.1.5. Functional/Fortified Water
- 5.2. Market Analysis, Insights and Forecast - by Distribution Channel
- 5.2.1. Supermarkets/Hypermarkets
- 5.2.2. Pharmacies/Health Stores
- 5.2.3. Convenience Stores
- 5.2.4. Online Retail Stores
- 5.2.5. Other Distribution Channels
- 5.3. Market Analysis, Insights and Forecast - by Region
- 5.3.1. North America
- 5.3.2. Europe
- 5.3.3. Asia Pacific
- 5.3.4. South America
- 5.3.5. Middle East
- 5.3.6. South Africa
- 5.1. Market Analysis, Insights and Forecast - by Type
- 6. North America Functional Beverages Market Analysis, Insights and Forecast, 2019-2031
- 6.1. Market Analysis, Insights and Forecast - by Type
- 6.1.1. Energy Drinks
- 6.1.2. Sports Drinks
- 6.1.3. Fortified Juice
- 6.1.4. Dairy and Dairy Alternative Beverage
- 6.1.5. Functional/Fortified Water
- 6.2. Market Analysis, Insights and Forecast - by Distribution Channel
- 6.2.1. Supermarkets/Hypermarkets
- 6.2.2. Pharmacies/Health Stores
- 6.2.3. Convenience Stores
- 6.2.4. Online Retail Stores
- 6.2.5. Other Distribution Channels
- 6.1. Market Analysis, Insights and Forecast - by Type
- 7. Europe Functional Beverages Market Analysis, Insights and Forecast, 2019-2031
- 7.1. Market Analysis, Insights and Forecast - by Type
- 7.1.1. Energy Drinks
- 7.1.2. Sports Drinks
- 7.1.3. Fortified Juice
- 7.1.4. Dairy and Dairy Alternative Beverage
- 7.1.5. Functional/Fortified Water
- 7.2. Market Analysis, Insights and Forecast - by Distribution Channel
- 7.2.1. Supermarkets/Hypermarkets
- 7.2.2. Pharmacies/Health Stores
- 7.2.3. Convenience Stores
- 7.2.4. Online Retail Stores
- 7.2.5. Other Distribution Channels
- 7.1. Market Analysis, Insights and Forecast - by Type
- 8. Asia Pacific Functional Beverages Market Analysis, Insights and Forecast, 2019-2031
- 8.1. Market Analysis, Insights and Forecast - by Type
- 8.1.1. Energy Drinks
- 8.1.2. Sports Drinks
- 8.1.3. Fortified Juice
- 8.1.4. Dairy and Dairy Alternative Beverage
- 8.1.5. Functional/Fortified Water
- 8.2. Market Analysis, Insights and Forecast - by Distribution Channel
- 8.2.1. Supermarkets/Hypermarkets
- 8.2.2. Pharmacies/Health Stores
- 8.2.3. Convenience Stores
- 8.2.4. Online Retail Stores
- 8.2.5. Other Distribution Channels
- 8.1. Market Analysis, Insights and Forecast - by Type
- 9. South America Functional Beverages Market Analysis, Insights and Forecast, 2019-2031
- 9.1. Market Analysis, Insights and Forecast - by Type
- 9.1.1. Energy Drinks
- 9.1.2. Sports Drinks
- 9.1.3. Fortified Juice
- 9.1.4. Dairy and Dairy Alternative Beverage
- 9.1.5. Functional/Fortified Water
- 9.2. Market Analysis, Insights and Forecast - by Distribution Channel
- 9.2.1. Supermarkets/Hypermarkets
- 9.2.2. Pharmacies/Health Stores
- 9.2.3. Convenience Stores
- 9.2.4. Online Retail Stores
- 9.2.5. Other Distribution Channels
- 9.1. Market Analysis, Insights and Forecast - by Type
- 10. Middle East Functional Beverages Market Analysis, Insights and Forecast, 2019-2031
- 10.1. Market Analysis, Insights and Forecast - by Type
- 10.1.1. Energy Drinks
- 10.1.2. Sports Drinks
- 10.1.3. Fortified Juice
- 10.1.4. Dairy and Dairy Alternative Beverage
- 10.1.5. Functional/Fortified Water
- 10.2. Market Analysis, Insights and Forecast - by Distribution Channel
- 10.2.1. Supermarkets/Hypermarkets
- 10.2.2. Pharmacies/Health Stores
- 10.2.3. Convenience Stores
- 10.2.4. Online Retail Stores
- 10.2.5. Other Distribution Channels
- 10.1. Market Analysis, Insights and Forecast - by Type
- 11. South Africa Functional Beverages Market Analysis, Insights and Forecast, 2019-2031
- 11.1. Market Analysis, Insights and Forecast - by Type
- 11.1.1. Energy Drinks
- 11.1.2. Sports Drinks
- 11.1.3. Fortified Juice
- 11.1.4. Dairy and Dairy Alternative Beverage
- 11.1.5. Functional/Fortified Water
- 11.2. Market Analysis, Insights and Forecast - by Distribution Channel
- 11.2.1. Supermarkets/Hypermarkets
- 11.2.2. Pharmacies/Health Stores
- 11.2.3. Convenience Stores
- 11.2.4. Online Retail Stores
- 11.2.5. Other Distribution Channels
- 11.1. Market Analysis, Insights and Forecast - by Type
- 12. North America Functional Beverages Market Analysis, Insights and Forecast, 2019-2031
- 12.1. Market Analysis, Insights and Forecast - By Country/Sub-region
- 12.1.1 United States
- 12.1.2 Canada
- 12.1.3 Mexico
- 12.1.4 Rest of North America
- 13. Europe Functional Beverages Market Analysis, Insights and Forecast, 2019-2031
- 13.1. Market Analysis, Insights and Forecast - By Country/Sub-region
- 13.1.1 United Kingdom
- 13.1.2 Germany
- 13.1.3 France
- 13.1.4 Russia
- 13.1.5 Italy
- 13.1.6 Spain
- 13.1.7 Rest of Europe
- 14. Asia Pacific Functional Beverages Market Analysis, Insights and Forecast, 2019-2031
- 14.1. Market Analysis, Insights and Forecast - By Country/Sub-region
- 14.1.1 India
- 14.1.2 China
- 14.1.3 Japan
- 14.1.4 Australia
- 14.1.5 Rest of Asia Pacific
- 15. South America Functional Beverages Market Analysis, Insights and Forecast, 2019-2031
- 15.1. Market Analysis, Insights and Forecast - By Country/Sub-region
- 15.1.1 Brazil
- 15.1.2 Argentina
- 15.1.3 Rest of South America
- 16. Middle East Functional Beverages Market Analysis, Insights and Forecast, 2019-2031
- 16.1. Market Analysis, Insights and Forecast - By Country/Sub-region
- 16.1.1.
- 17. South Africa Functional Beverages Market Analysis, Insights and Forecast, 2019-2031
- 17.1. Market Analysis, Insights and Forecast - By Country/Sub-region
- 17.1.1 Saudi Arabia
- 17.1.2 Rest of Middle East
- 18. Competitive Analysis
- 18.1. Global Market Share Analysis 2024
- 18.2. Company Profiles
- 18.2.1 Nestle SA
- 18.2.1.1. Overview
- 18.2.1.2. Products
- 18.2.1.3. SWOT Analysis
- 18.2.1.4. Recent Developments
- 18.2.1.5. Financials (Based on Availability)
- 18.2.2 Monster Beverage Corporation
- 18.2.2.1. Overview
- 18.2.2.2. Products
- 18.2.2.3. SWOT Analysis
- 18.2.2.4. Recent Developments
- 18.2.2.5. Financials (Based on Availability)
- 18.2.3 PepsiCo Inc
- 18.2.3.1. Overview
- 18.2.3.2. Products
- 18.2.3.3. SWOT Analysis
- 18.2.3.4. Recent Developments
- 18.2.3.5. Financials (Based on Availability)
- 18.2.4 Otsuka Holdings
- 18.2.4.1. Overview
- 18.2.4.2. Products
- 18.2.4.3. SWOT Analysis
- 18.2.4.4. Recent Developments
- 18.2.4.5. Financials (Based on Availability)
- 18.2.5 Danone SA
- 18.2.5.1. Overview
- 18.2.5.2. Products
- 18.2.5.3. SWOT Analysis
- 18.2.5.4. Recent Developments
- 18.2.5.5. Financials (Based on Availability)
- 18.2.6 Suntory Holdings Limited
- 18.2.6.1. Overview
- 18.2.6.2. Products
- 18.2.6.3. SWOT Analysis
- 18.2.6.4. Recent Developments
- 18.2.6.5. Financials (Based on Availability)
- 18.2.7 Red Bull GmbH
- 18.2.7.1. Overview
- 18.2.7.2. Products
- 18.2.7.3. SWOT Analysis
- 18.2.7.4. Recent Developments
- 18.2.7.5. Financials (Based on Availability)
- 18.2.8 Blue Diamond Growers
- 18.2.8.1. Overview
- 18.2.8.2. Products
- 18.2.8.3. SWOT Analysis
- 18.2.8.4. Recent Developments
- 18.2.8.5. Financials (Based on Availability)
- 18.2.9 The Coca-Cola Company
- 18.2.9.1. Overview
- 18.2.9.2. Products
- 18.2.9.3. SWOT Analysis
- 18.2.9.4. Recent Developments
- 18.2.9.5. Financials (Based on Availability)
- 18.2.10 Oatly Group AB *List Not Exhaustive
- 18.2.10.1. Overview
- 18.2.10.2. Products
- 18.2.10.3. SWOT Analysis
- 18.2.10.4. Recent Developments
- 18.2.10.5. Financials (Based on Availability)
- 18.2.1 Nestle SA
List of Figures
- Figure 1: Global Functional Beverages Market Revenue Breakdown (Million, %) by Region 2024 & 2032
- Figure 2: North America Functional Beverages Market Revenue (Million), by Country 2024 & 2032
- Figure 3: North America Functional Beverages Market Revenue Share (%), by Country 2024 & 2032
- Figure 4: Europe Functional Beverages Market Revenue (Million), by Country 2024 & 2032
- Figure 5: Europe Functional Beverages Market Revenue Share (%), by Country 2024 & 2032
- Figure 6: Asia Pacific Functional Beverages Market Revenue (Million), by Country 2024 & 2032
- Figure 7: Asia Pacific Functional Beverages Market Revenue Share (%), by Country 2024 & 2032
- Figure 8: South America Functional Beverages Market Revenue (Million), by Country 2024 & 2032
- Figure 9: South America Functional Beverages Market Revenue Share (%), by Country 2024 & 2032
- Figure 10: Middle East Functional Beverages Market Revenue (Million), by Country 2024 & 2032
- Figure 11: Middle East Functional Beverages Market Revenue Share (%), by Country 2024 & 2032
- Figure 12: South Africa Functional Beverages Market Revenue (Million), by Country 2024 & 2032
- Figure 13: South Africa Functional Beverages Market Revenue Share (%), by Country 2024 & 2032
- Figure 14: North America Functional Beverages Market Revenue (Million), by Type 2024 & 2032
- Figure 15: North America Functional Beverages Market Revenue Share (%), by Type 2024 & 2032
- Figure 16: North America Functional Beverages Market Revenue (Million), by Distribution Channel 2024 & 2032
- Figure 17: North America Functional Beverages Market Revenue Share (%), by Distribution Channel 2024 & 2032
- Figure 18: North America Functional Beverages Market Revenue (Million), by Country 2024 & 2032
- Figure 19: North America Functional Beverages Market Revenue Share (%), by Country 2024 & 2032
- Figure 20: Europe Functional Beverages Market Revenue (Million), by Type 2024 & 2032
- Figure 21: Europe Functional Beverages Market Revenue Share (%), by Type 2024 & 2032
- Figure 22: Europe Functional Beverages Market Revenue (Million), by Distribution Channel 2024 & 2032
- Figure 23: Europe Functional Beverages Market Revenue Share (%), by Distribution Channel 2024 & 2032
- Figure 24: Europe Functional Beverages Market Revenue (Million), by Country 2024 & 2032
- Figure 25: Europe Functional Beverages Market Revenue Share (%), by Country 2024 & 2032
- Figure 26: Asia Pacific Functional Beverages Market Revenue (Million), by Type 2024 & 2032
- Figure 27: Asia Pacific Functional Beverages Market Revenue Share (%), by Type 2024 & 2032
- Figure 28: Asia Pacific Functional Beverages Market Revenue (Million), by Distribution Channel 2024 & 2032
- Figure 29: Asia Pacific Functional Beverages Market Revenue Share (%), by Distribution Channel 2024 & 2032
- Figure 30: Asia Pacific Functional Beverages Market Revenue (Million), by Country 2024 & 2032
- Figure 31: Asia Pacific Functional Beverages Market Revenue Share (%), by Country 2024 & 2032
- Figure 32: South America Functional Beverages Market Revenue (Million), by Type 2024 & 2032
- Figure 33: South America Functional Beverages Market Revenue Share (%), by Type 2024 & 2032
- Figure 34: South America Functional Beverages Market Revenue (Million), by Distribution Channel 2024 & 2032
- Figure 35: South America Functional Beverages Market Revenue Share (%), by Distribution Channel 2024 & 2032
- Figure 36: South America Functional Beverages Market Revenue (Million), by Country 2024 & 2032
- Figure 37: South America Functional Beverages Market Revenue Share (%), by Country 2024 & 2032
- Figure 38: Middle East Functional Beverages Market Revenue (Million), by Type 2024 & 2032
- Figure 39: Middle East Functional Beverages Market Revenue Share (%), by Type 2024 & 2032
- Figure 40: Middle East Functional Beverages Market Revenue (Million), by Distribution Channel 2024 & 2032
- Figure 41: Middle East Functional Beverages Market Revenue Share (%), by Distribution Channel 2024 & 2032
- Figure 42: Middle East Functional Beverages Market Revenue (Million), by Country 2024 & 2032
- Figure 43: Middle East Functional Beverages Market Revenue Share (%), by Country 2024 & 2032
- Figure 44: South Africa Functional Beverages Market Revenue (Million), by Type 2024 & 2032
- Figure 45: South Africa Functional Beverages Market Revenue Share (%), by Type 2024 & 2032
- Figure 46: South Africa Functional Beverages Market Revenue (Million), by Distribution Channel 2024 & 2032
- Figure 47: South Africa Functional Beverages Market Revenue Share (%), by Distribution Channel 2024 & 2032
- Figure 48: South Africa Functional Beverages Market Revenue (Million), by Country 2024 & 2032
- Figure 49: South Africa Functional Beverages Market Revenue Share (%), by Country 2024 & 2032
List of Tables
- Table 1: Global Functional Beverages Market Revenue Million Forecast, by Region 2019 & 2032
- Table 2: Global Functional Beverages Market Revenue Million Forecast, by Type 2019 & 2032
- Table 3: Global Functional Beverages Market Revenue Million Forecast, by Distribution Channel 2019 & 2032
- Table 4: Global Functional Beverages Market Revenue Million Forecast, by Region 2019 & 2032
- Table 5: Global Functional Beverages Market Revenue Million Forecast, by Country 2019 & 2032
- Table 6: United States Functional Beverages Market Revenue (Million) Forecast, by Application 2019 & 2032
- Table 7: Canada Functional Beverages Market Revenue (Million) Forecast, by Application 2019 & 2032
- Table 8: Mexico Functional Beverages Market Revenue (Million) Forecast, by Application 2019 & 2032
- Table 9: Rest of North America Functional Beverages Market Revenue (Million) Forecast, by Application 2019 & 2032
- Table 10: Global Functional Beverages Market Revenue Million Forecast, by Country 2019 & 2032
- Table 11: United Kingdom Functional Beverages Market Revenue (Million) Forecast, by Application 2019 & 2032
- Table 12: Germany Functional Beverages Market Revenue (Million) Forecast, by Application 2019 & 2032
- Table 13: France Functional Beverages Market Revenue (Million) Forecast, by Application 2019 & 2032
- Table 14: Russia Functional Beverages Market Revenue (Million) Forecast, by Application 2019 & 2032
- Table 15: Italy Functional Beverages Market Revenue (Million) Forecast, by Application 2019 & 2032
- Table 16: Spain Functional Beverages Market Revenue (Million) Forecast, by Application 2019 & 2032
- Table 17: Rest of Europe Functional Beverages Market Revenue (Million) Forecast, by Application 2019 & 2032
- Table 18: Global Functional Beverages Market Revenue Million Forecast, by Country 2019 & 2032
- Table 19: India Functional Beverages Market Revenue (Million) Forecast, by Application 2019 & 2032
- Table 20: China Functional Beverages Market Revenue (Million) Forecast, by Application 2019 & 2032
- Table 21: Japan Functional Beverages Market Revenue (Million) Forecast, by Application 2019 & 2032
- Table 22: Australia Functional Beverages Market Revenue (Million) Forecast, by Application 2019 & 2032
- Table 23: Rest of Asia Pacific Functional Beverages Market Revenue (Million) Forecast, by Application 2019 & 2032
- Table 24: Global Functional Beverages Market Revenue Million Forecast, by Country 2019 & 2032
- Table 25: Brazil Functional Beverages Market Revenue (Million) Forecast, by Application 2019 & 2032
- Table 26: Argentina Functional Beverages Market Revenue (Million) Forecast, by Application 2019 & 2032
- Table 27: Rest of South America Functional Beverages Market Revenue (Million) Forecast, by Application 2019 & 2032
- Table 28: Global Functional Beverages Market Revenue Million Forecast, by Country 2019 & 2032
- Table 29: Functional Beverages Market Revenue (Million) Forecast, by Application 2019 & 2032
- Table 30: Global Functional Beverages Market Revenue Million Forecast, by Country 2019 & 2032
- Table 31: Saudi Arabia Functional Beverages Market Revenue (Million) Forecast, by Application 2019 & 2032
- Table 32: Rest of Middle East Functional Beverages Market Revenue (Million) Forecast, by Application 2019 & 2032
- Table 33: Global Functional Beverages Market Revenue Million Forecast, by Type 2019 & 2032
- Table 34: Global Functional Beverages Market Revenue Million Forecast, by Distribution Channel 2019 & 2032
- Table 35: Global Functional Beverages Market Revenue Million Forecast, by Country 2019 & 2032
- Table 36: United States Functional Beverages Market Revenue (Million) Forecast, by Application 2019 & 2032
- Table 37: Canada Functional Beverages Market Revenue (Million) Forecast, by Application 2019 & 2032
- Table 38: Mexico Functional Beverages Market Revenue (Million) Forecast, by Application 2019 & 2032
- Table 39: Rest of North America Functional Beverages Market Revenue (Million) Forecast, by Application 2019 & 2032
- Table 40: Global Functional Beverages Market Revenue Million Forecast, by Type 2019 & 2032
- Table 41: Global Functional Beverages Market Revenue Million Forecast, by Distribution Channel 2019 & 2032
- Table 42: Global Functional Beverages Market Revenue Million Forecast, by Country 2019 & 2032
- Table 43: United Kingdom Functional Beverages Market Revenue (Million) Forecast, by Application 2019 & 2032
- Table 44: Germany Functional Beverages Market Revenue (Million) Forecast, by Application 2019 & 2032
- Table 45: France Functional Beverages Market Revenue (Million) Forecast, by Application 2019 & 2032
- Table 46: Russia Functional Beverages Market Revenue (Million) Forecast, by Application 2019 & 2032
- Table 47: Italy Functional Beverages Market Revenue (Million) Forecast, by Application 2019 & 2032
- Table 48: Spain Functional Beverages Market Revenue (Million) Forecast, by Application 2019 & 2032
- Table 49: Rest of Europe Functional Beverages Market Revenue (Million) Forecast, by Application 2019 & 2032
- Table 50: Global Functional Beverages Market Revenue Million Forecast, by Type 2019 & 2032
- Table 51: Global Functional Beverages Market Revenue Million Forecast, by Distribution Channel 2019 & 2032
- Table 52: Global Functional Beverages Market Revenue Million Forecast, by Country 2019 & 2032
- Table 53: India Functional Beverages Market Revenue (Million) Forecast, by Application 2019 & 2032
- Table 54: China Functional Beverages Market Revenue (Million) Forecast, by Application 2019 & 2032
- Table 55: Japan Functional Beverages Market Revenue (Million) Forecast, by Application 2019 & 2032
- Table 56: Australia Functional Beverages Market Revenue (Million) Forecast, by Application 2019 & 2032
- Table 57: Rest of Asia Pacific Functional Beverages Market Revenue (Million) Forecast, by Application 2019 & 2032
- Table 58: Global Functional Beverages Market Revenue Million Forecast, by Type 2019 & 2032
- Table 59: Global Functional Beverages Market Revenue Million Forecast, by Distribution Channel 2019 & 2032
- Table 60: Global Functional Beverages Market Revenue Million Forecast, by Country 2019 & 2032
- Table 61: Brazil Functional Beverages Market Revenue (Million) Forecast, by Application 2019 & 2032
- Table 62: Argentina Functional Beverages Market Revenue (Million) Forecast, by Application 2019 & 2032
- Table 63: Rest of South America Functional Beverages Market Revenue (Million) Forecast, by Application 2019 & 2032
- Table 64: Global Functional Beverages Market Revenue Million Forecast, by Type 2019 & 2032
- Table 65: Global Functional Beverages Market Revenue Million Forecast, by Distribution Channel 2019 & 2032
- Table 66: Global Functional Beverages Market Revenue Million Forecast, by Country 2019 & 2032
- Table 67: Global Functional Beverages Market Revenue Million Forecast, by Type 2019 & 2032
- Table 68: Global Functional Beverages Market Revenue Million Forecast, by Distribution Channel 2019 & 2032
- Table 69: Global Functional Beverages Market Revenue Million Forecast, by Country 2019 & 2032
- Table 70: Saudi Arabia Functional Beverages Market Revenue (Million) Forecast, by Application 2019 & 2032
- Table 71: Rest of Middle East Functional Beverages Market Revenue (Million) Forecast, by Application 2019 & 2032
Frequently Asked Questions
1. What is the projected Compound Annual Growth Rate (CAGR) of the Functional Beverages Market?
The projected CAGR is approximately 7.49%.
2. Which companies are prominent players in the Functional Beverages Market?
Key companies in the market include Nestle SA, Monster Beverage Corporation, PepsiCo Inc, Otsuka Holdings, Danone SA, Suntory Holdings Limited, Red Bull GmbH, Blue Diamond Growers, The Coca-Cola Company, Oatly Group AB *List Not Exhaustive.
3. What are the main segments of the Functional Beverages Market?
The market segments include Type, Distribution Channel.
4. Can you provide details about the market size?
The market size is estimated to be USD 213.74 Million as of 2022.
5. What are some drivers contributing to market growth?
Growing Consumer Inclination Toward Low-sugar/Sugar-free Beverages; Expenditure on Advertisement and Promotional Activities.
6. What are the notable trends driving market growth?
Inclination Toward Dairy and Dairy Alternative Beverages.
7. Are there any restraints impacting market growth?
Concerns Over Health Issues Associated with Functional Beverages.
8. Can you provide examples of recent developments in the market?
October 2023: Tropicana brand launched two new smoothie flavors containing Vitamin C. The products Tropicana Smoothie Pineapple & Mango and Strawberry & Banana are to be retailed across India in all distribution channels operating in the market.
9. What pricing options are available for accessing the report?
Pricing options include single-user, multi-user, and enterprise licenses priced at USD 4750, USD 5250, and USD 8750 respectively.
10. Is the market size provided in terms of value or volume?
The market size is provided in terms of value, measured in Million.
11. Are there any specific market keywords associated with the report?
Yes, the market keyword associated with the report is "Functional Beverages Market," which aids in identifying and referencing the specific market segment covered.
12. How do I determine which pricing option suits my needs best?
The pricing options vary based on user requirements and access needs. Individual users may opt for single-user licenses, while businesses requiring broader access may choose multi-user or enterprise licenses for cost-effective access to the report.
13. Are there any additional resources or data provided in the Functional Beverages Market report?
While the report offers comprehensive insights, it's advisable to review the specific contents or supplementary materials provided to ascertain if additional resources or data are available.
14. How can I stay updated on further developments or reports in the Functional Beverages Market?
To stay informed about further developments, trends, and reports in the Functional Beverages Market, consider subscribing to industry newsletters, following relevant companies and organizations, or regularly checking reputable industry news sources and publications.
Methodology
Step 1 - Identification of Relevant Samples Size from Population Database


Step 2 - Approaches for Defining Global Market Size (Value, Volume* & Price*)

Note*: In applicable scenarios
Step 3 - Data Sources
Primary Research
- Web Analytics
- Survey Reports
- Research Institute
- Latest Research Reports
- Opinion Leaders
Secondary Research
- Annual Reports
- White Paper
- Latest Press Release
- Industry Association
- Paid Database
- Investor Presentations

Step 4 - Data Triangulation
Involves using different sources of information in order to increase the validity of a study
These sources are likely to be stakeholders in a program - participants, other researchers, program staff, other community members, and so on.
Then we put all data in single framework & apply various statistical tools to find out the dynamic on the market.
During the analysis stage, feedback from the stakeholder groups would be compared to determine areas of agreement as well as areas of divergence


