Key Insights
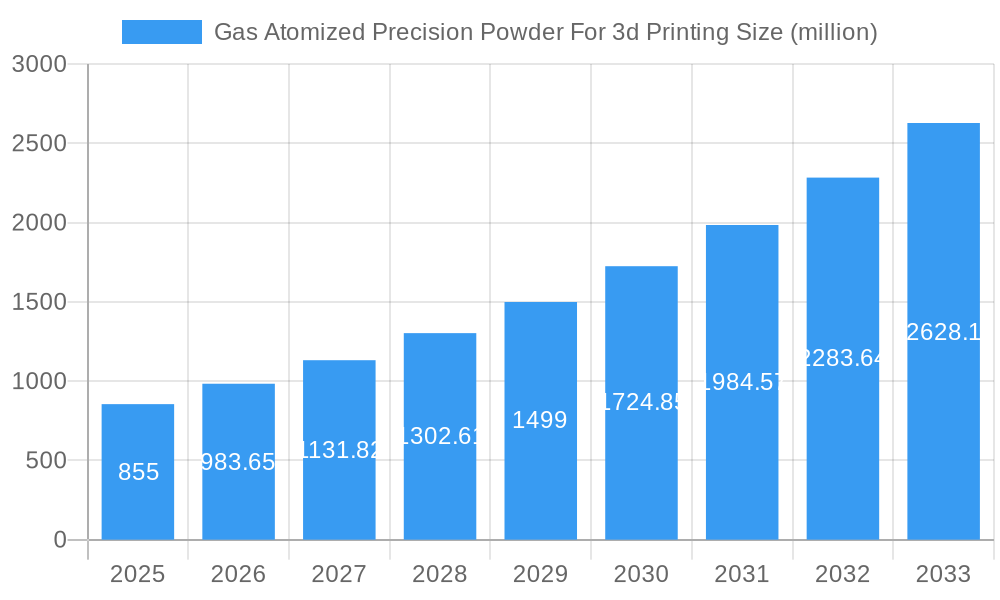
The global market for gas atomized precision powder for 3D printing is experiencing robust growth, projected to reach a value of $855 million in 2025 and maintain a Compound Annual Growth Rate (CAGR) of 15.3% from 2025 to 2033. This expansion is fueled by several key drivers. The increasing adoption of additive manufacturing across various industries, particularly aerospace, medical, and automotive, is a significant factor. These sectors require high-precision, complex parts that are cost-effectively produced using 3D printing technologies, driving demand for the specialized powders essential to these processes. Furthermore, ongoing advancements in powder metallurgy techniques, resulting in finer particle sizes and improved material properties, are enhancing the quality and application range of gas atomized powders, further stimulating market growth. The rising demand for lightweight yet high-strength components, coupled with the growing focus on customization and rapid prototyping, are also contributing to this upward trajectory. Key players like Sandvik, Linde, and Carpenter Technology are actively investing in research and development, expanding their product portfolios, and strategically acquiring smaller companies to consolidate their market positions.
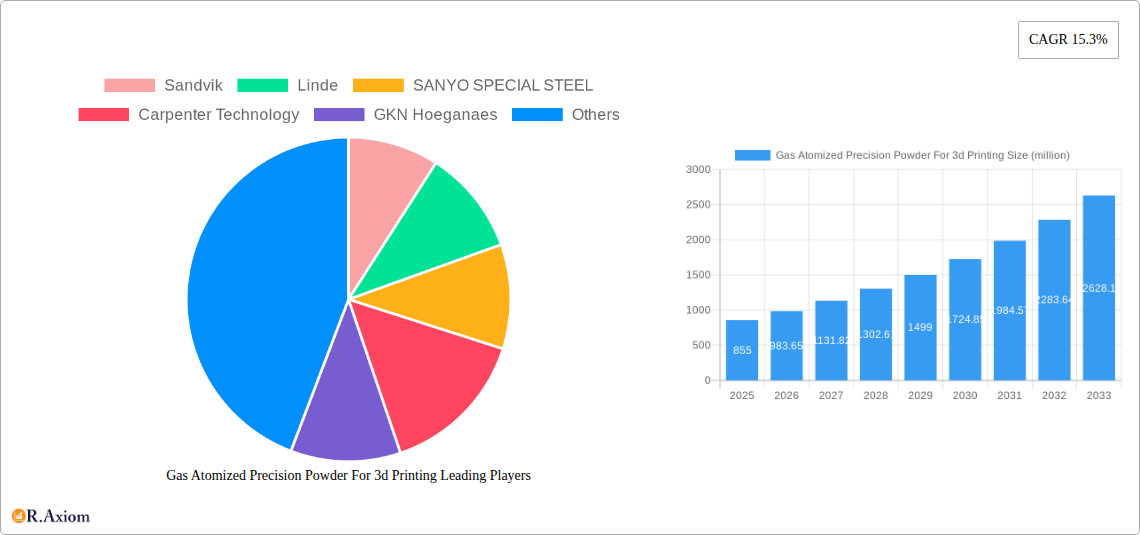
Gas Atomized Precision Powder For 3d Printing Market Size (In Million)
While the market shows strong promise, challenges remain. The high initial investment required for 3D printing equipment and the relatively high cost of gas atomized powders can hinder wider adoption, particularly amongst smaller businesses. Moreover, potential supply chain disruptions and fluctuations in raw material prices pose risks. However, ongoing innovations in powder production technologies and the development of more cost-effective 3D printing solutions are expected to mitigate these constraints over the forecast period. The segmentation of the market is likely driven by material type (e.g., stainless steel, titanium alloys, nickel-based superalloys), application (aerospace, medical, automotive), and geographical region, with North America and Europe currently holding significant market share. The competitive landscape is characterized by a mix of established industry giants and innovative startups, leading to intense competition and continuous product improvements.
Gas Atomized Precision Powder For 3d Printing Company Market Share
Gas Atomized Precision Powder for 3D Printing Market Report: 2019-2033
This comprehensive report provides an in-depth analysis of the global Gas Atomized Precision Powder for 3D Printing market, offering invaluable insights for stakeholders across the value chain. The study period covers 2019-2033, with 2025 as the base and estimated year. The forecast period spans 2025-2033, and the historical period encompasses 2019-2024. This report unveils key market trends, growth drivers, challenges, and opportunities, backed by robust data and analysis. The market is valued at $XX million in 2025 and is projected to reach $XX million by 2033, exhibiting a CAGR of XX%.
Gas Atomized Precision Powder For 3D Printing Market Concentration & Innovation
This section analyzes the market's competitive landscape, focusing on concentration, innovation, and regulatory influences. The report examines the market share held by key players such as Sandvik, Linde, SANYO SPECIAL STEEL, Carpenter Technology, GKN Hoeganaes, Jiangsu Vilory Advanced Materials Technology, Voestalpine, Oerlikon, Safina, and Höganäs, providing a detailed assessment of their strategies and competitive advantages.
- Market Concentration: The market is characterized by [Describe concentration level: highly concentrated, moderately concentrated, fragmented etc.], with the top five players holding an estimated XX% market share in 2025.
- Innovation Drivers: Key innovation drivers include advancements in powder metallurgy, the development of new alloy compositions optimized for 3D printing, and the emergence of novel additive manufacturing techniques.
- Regulatory Frameworks: Government regulations regarding material safety and environmental impact significantly influence market dynamics. [Discuss specific regulations and their impact].
- Product Substitutes: [Discuss potential substitute materials and their impact on market growth].
- End-User Trends: The increasing adoption of 3D printing across various industries, including aerospace, medical, and automotive, fuels market demand.
- M&A Activities: The report documents significant M&A activities in the sector, analyzing deal values and their impact on market consolidation. For example, [mention a specific M&A deal and its implications, e.g., a $XX million acquisition in 2022 led to increased market share for X company].
Gas Atomized Precision Powder For 3D Printing Industry Trends & Insights
This section delves into the key industry trends shaping the market's trajectory. It examines market growth drivers, technological disruptions, consumer preferences, and competitive dynamics. The report analyzes the impact of factors such as increasing demand for lightweight and high-strength components, advancements in laser powder bed fusion (LPBF) and binder jetting technologies, and the growing adoption of 3D printing in various industries. The market penetration rate for gas atomized powders in 3D printing is projected to reach XX% by 2033. This growth is primarily driven by the advantages of gas atomized powders, such as their superior sphericity, flowability and consistent particle size distribution leading to enhanced printability and part quality compared to other powder production methods. The increasing adoption of metal additive manufacturing in high-value applications further boosts the market for gas-atomized precision powders. The competitive landscape is characterized by intense competition among established players and the emergence of new entrants. [Provide further details on competitive dynamics, including pricing strategies, product differentiation, and technological advancements].
Dominant Markets & Segments in Gas Atomized Precision Powder For 3D Printing
This section identifies the leading geographical regions and market segments. [Specify the dominant region/country and segment, e.g., North America holds the largest market share due to high adoption rates in aerospace and medical industries].
- Key Drivers in the Dominant Region/Segment:
- Robust economic growth and government support for advanced manufacturing.
- Well-established supply chains and infrastructure.
- High concentration of key industry players.
- Strong R&D investments in additive manufacturing technologies.
- Favorable regulatory environment.
[Provide a detailed paragraph analyzing the dominance of this region/segment, focusing on factors contributing to its leading position. Consider factors like economic strength, infrastructure, government policies, and technological advancements.]
Gas Atomized Precision Powder For 3D Printing Product Developments
Recent innovations include the development of new alloys with enhanced properties like higher strength, corrosion resistance, and biocompatibility. These advancements cater to the specific needs of various industries, expanding the applications of gas atomized powders in 3D printing. The focus is on improving powder quality, reducing production costs, and expanding material choices to meet the diverse requirements of additive manufacturing processes. [Mention specific product innovations and their competitive advantages].
Report Scope & Segmentation Analysis
The report segments the market by material type (e.g., stainless steel, titanium, aluminum alloys), application (e.g., aerospace, medical, automotive), and region (North America, Europe, Asia Pacific, etc.). Each segment's growth projection, market size, and competitive dynamics are thoroughly analyzed. [Provide a paragraph for each segment, outlining its key characteristics and growth prospects].
Key Drivers of Gas Atomized Precision Powder For 3D Printing Growth
The market's growth is primarily driven by the increasing adoption of 3D printing technologies across various sectors, the demand for customized and complex components, and advancements in powder metallurgy techniques resulting in improved powder quality and consistency. Government initiatives promoting additive manufacturing further accelerate market growth. The rising demand for lightweight and high-strength materials, particularly in the aerospace and automotive industries, also fuels market expansion.
Challenges in the Gas Atomized Precision Powder For 3D Printing Sector
Challenges include the high cost of gas atomized powders compared to other powder production methods, potential supply chain disruptions, and the need for stringent quality control to ensure consistent powder properties. [Quantify the impact of these challenges, e.g., high powder cost limits adoption in certain price-sensitive sectors].
Emerging Opportunities in Gas Atomized Precision Powder For 3D Printing
Emerging opportunities include the development of novel alloys with enhanced properties for specialized applications, the expansion of 3D printing into new industries, and the increasing adoption of hybrid manufacturing processes combining traditional and additive manufacturing techniques. The exploration of new applications in the biomedical sector holds significant potential.
Leading Players in the Gas Atomized Precision Powder For 3D Printing Market
- Sandvik
- Linde
- SANYO SPECIAL STEEL
- Carpenter Technology
- GKN Hoeganaes
- Jiangsu Vilory Advanced Materials Technology
- Voestalpine
- Oerlikon
- Safina
- Höganäs
Key Developments in Gas Atomized Precision Powder For 3D Printing Industry
- January 2023: Company X launched a new line of titanium alloy powders optimized for LPBF.
- March 2024: Company Y announced a strategic partnership to expand its production capacity for stainless steel powders.
- June 2025: A significant M&A deal resulted in the merger of two key players, increasing market consolidation. [Add more bullet points with specific dates and details of key developments]
Strategic Outlook for Gas Atomized Precision Powder For 3D Printing Market
The market is poised for significant growth driven by continuous technological advancements, increasing demand from diverse industries, and supportive government policies. The focus on developing high-performance materials, improving powder quality, and reducing production costs will shape the future of the market. The expansion into new applications and regions presents substantial opportunities for growth.
Gas Atomized Precision Powder For 3d Printing Segmentation
-
1. Application
- 1.1. Metal-Injection Moulding
- 1.2. 3D Printing
- 1.3. Others
-
2. Type
- 2.1. Nickel Powders
- 2.2. Cobalt Powders
- 2.3. Iron Powders
- 2.4. Titanium Powders
- 2.5. Others
Gas Atomized Precision Powder For 3d Printing Segmentation By Geography
-
1. North America
- 1.1. United States
- 1.2. Canada
- 1.3. Mexico
-
2. South America
- 2.1. Brazil
- 2.2. Argentina
- 2.3. Rest of South America
-
3. Europe
- 3.1. United Kingdom
- 3.2. Germany
- 3.3. France
- 3.4. Italy
- 3.5. Spain
- 3.6. Russia
- 3.7. Benelux
- 3.8. Nordics
- 3.9. Rest of Europe
-
4. Middle East & Africa
- 4.1. Turkey
- 4.2. Israel
- 4.3. GCC
- 4.4. North Africa
- 4.5. South Africa
- 4.6. Rest of Middle East & Africa
-
5. Asia Pacific
- 5.1. China
- 5.2. India
- 5.3. Japan
- 5.4. South Korea
- 5.5. ASEAN
- 5.6. Oceania
- 5.7. Rest of Asia Pacific

Gas Atomized Precision Powder For 3d Printing Regional Market Share
Geographic Coverage of Gas Atomized Precision Powder For 3d Printing
Gas Atomized Precision Powder For 3d Printing REPORT HIGHLIGHTS
| Aspects | Details |
|---|---|
| Study Period | 2020-2034 |
| Base Year | 2025 |
| Estimated Year | 2026 |
| Forecast Period | 2026-2034 |
| Historical Period | 2020-2025 |
| Growth Rate | CAGR of 15.3% from 2020-2034 |
| Segmentation |
|
Table of Contents
- 1. Introduction
- 1.1. Research Scope
- 1.2. Market Segmentation
- 1.3. Research Objective
- 1.4. Definitions and Assumptions
- 2. Executive Summary
- 2.1. Market Snapshot
- 3. Market Dynamics
- 3.1. Market Drivers
- 3.2. Market Restrains
- 3.3. Market Trends
- 3.4. Market Opportunities
- 4. Market Factor Analysis
- 4.1. Porters Five Forces
- 4.1.1. Bargaining Power of Suppliers
- 4.1.2. Bargaining Power of Buyers
- 4.1.3. Threat of New Entrants
- 4.1.4. Threat of Substitutes
- 4.1.5. Competitive Rivalry
- 4.2. PESTEL analysis
- 4.3. BCG Analysis
- 4.3.1. Stars (High Growth, High Market Share)
- 4.3.2. Cash Cows (Low Growth, High Market Share)
- 4.3.3. Question Mark (High Growth, Low Market Share)
- 4.3.4. Dogs (Low Growth, Low Market Share)
- 4.4. Ansoff Matrix Analysis
- 4.5. Supply Chain Analysis
- 4.6. Regulatory Landscape
- 4.7. Current Market Potential and Opportunity Assessment (TAM–SAM–SOM Framework)
- 4.8. RAX Analyst Note
- 4.1. Porters Five Forces
- 5. Market Analysis, Insights and Forecast 2021-2033
- 5.1. Market Analysis, Insights and Forecast - by Application
- 5.1.1. Metal-Injection Moulding
- 5.1.2. 3D Printing
- 5.1.3. Others
- 5.2. Market Analysis, Insights and Forecast - by Type
- 5.2.1. Nickel Powders
- 5.2.2. Cobalt Powders
- 5.2.3. Iron Powders
- 5.2.4. Titanium Powders
- 5.2.5. Others
- 5.3. Market Analysis, Insights and Forecast - by Region
- 5.3.1. North America
- 5.3.2. South America
- 5.3.3. Europe
- 5.3.4. Middle East & Africa
- 5.3.5. Asia Pacific
- 5.1. Market Analysis, Insights and Forecast - by Application
- 6. Global Gas Atomized Precision Powder For 3d Printing Analysis, Insights and Forecast, 2021-2033
- 6.1. Market Analysis, Insights and Forecast - by Application
- 6.1.1. Metal-Injection Moulding
- 6.1.2. 3D Printing
- 6.1.3. Others
- 6.2. Market Analysis, Insights and Forecast - by Type
- 6.2.1. Nickel Powders
- 6.2.2. Cobalt Powders
- 6.2.3. Iron Powders
- 6.2.4. Titanium Powders
- 6.2.5. Others
- 6.1. Market Analysis, Insights and Forecast - by Application
- 7. North America Gas Atomized Precision Powder For 3d Printing Analysis, Insights and Forecast, 2020-2032
- 7.1. Market Analysis, Insights and Forecast - by Application
- 7.1.1. Metal-Injection Moulding
- 7.1.2. 3D Printing
- 7.1.3. Others
- 7.2. Market Analysis, Insights and Forecast - by Type
- 7.2.1. Nickel Powders
- 7.2.2. Cobalt Powders
- 7.2.3. Iron Powders
- 7.2.4. Titanium Powders
- 7.2.5. Others
- 7.1. Market Analysis, Insights and Forecast - by Application
- 8. South America Gas Atomized Precision Powder For 3d Printing Analysis, Insights and Forecast, 2020-2032
- 8.1. Market Analysis, Insights and Forecast - by Application
- 8.1.1. Metal-Injection Moulding
- 8.1.2. 3D Printing
- 8.1.3. Others
- 8.2. Market Analysis, Insights and Forecast - by Type
- 8.2.1. Nickel Powders
- 8.2.2. Cobalt Powders
- 8.2.3. Iron Powders
- 8.2.4. Titanium Powders
- 8.2.5. Others
- 8.1. Market Analysis, Insights and Forecast - by Application
- 9. Europe Gas Atomized Precision Powder For 3d Printing Analysis, Insights and Forecast, 2020-2032
- 9.1. Market Analysis, Insights and Forecast - by Application
- 9.1.1. Metal-Injection Moulding
- 9.1.2. 3D Printing
- 9.1.3. Others
- 9.2. Market Analysis, Insights and Forecast - by Type
- 9.2.1. Nickel Powders
- 9.2.2. Cobalt Powders
- 9.2.3. Iron Powders
- 9.2.4. Titanium Powders
- 9.2.5. Others
- 9.1. Market Analysis, Insights and Forecast - by Application
- 10. Middle East & Africa Gas Atomized Precision Powder For 3d Printing Analysis, Insights and Forecast, 2020-2032
- 10.1. Market Analysis, Insights and Forecast - by Application
- 10.1.1. Metal-Injection Moulding
- 10.1.2. 3D Printing
- 10.1.3. Others
- 10.2. Market Analysis, Insights and Forecast - by Type
- 10.2.1. Nickel Powders
- 10.2.2. Cobalt Powders
- 10.2.3. Iron Powders
- 10.2.4. Titanium Powders
- 10.2.5. Others
- 10.1. Market Analysis, Insights and Forecast - by Application
- 11. Asia Pacific Gas Atomized Precision Powder For 3d Printing Analysis, Insights and Forecast, 2020-2032
- 11.1. Market Analysis, Insights and Forecast - by Application
- 11.1.1. Metal-Injection Moulding
- 11.1.2. 3D Printing
- 11.1.3. Others
- 11.2. Market Analysis, Insights and Forecast - by Type
- 11.2.1. Nickel Powders
- 11.2.2. Cobalt Powders
- 11.2.3. Iron Powders
- 11.2.4. Titanium Powders
- 11.2.5. Others
- 11.1. Market Analysis, Insights and Forecast - by Application
- 12. Competitive Analysis
- 12.1. Company Profiles
- 12.1.1 Sandvik
- 12.1.1.1. Company Overview
- 12.1.1.2. Products
- 12.1.1.3. Company Financials
- 12.1.1.4. SWOT Analysis
- 12.1.2 Linde
- 12.1.2.1. Company Overview
- 12.1.2.2. Products
- 12.1.2.3. Company Financials
- 12.1.2.4. SWOT Analysis
- 12.1.3 SANYO SPECIAL STEEL
- 12.1.3.1. Company Overview
- 12.1.3.2. Products
- 12.1.3.3. Company Financials
- 12.1.3.4. SWOT Analysis
- 12.1.4 Carpenter Technology
- 12.1.4.1. Company Overview
- 12.1.4.2. Products
- 12.1.4.3. Company Financials
- 12.1.4.4. SWOT Analysis
- 12.1.5 GKN Hoeganaes
- 12.1.5.1. Company Overview
- 12.1.5.2. Products
- 12.1.5.3. Company Financials
- 12.1.5.4. SWOT Analysis
- 12.1.6 Jiangsu Vilory Advanced Materials Technology
- 12.1.6.1. Company Overview
- 12.1.6.2. Products
- 12.1.6.3. Company Financials
- 12.1.6.4. SWOT Analysis
- 12.1.7 Voestalpine
- 12.1.7.1. Company Overview
- 12.1.7.2. Products
- 12.1.7.3. Company Financials
- 12.1.7.4. SWOT Analysis
- 12.1.8 Oerlikon
- 12.1.8.1. Company Overview
- 12.1.8.2. Products
- 12.1.8.3. Company Financials
- 12.1.8.4. SWOT Analysis
- 12.1.9 Safina
- 12.1.9.1. Company Overview
- 12.1.9.2. Products
- 12.1.9.3. Company Financials
- 12.1.9.4. SWOT Analysis
- 12.1.10 Höganäs
- 12.1.10.1. Company Overview
- 12.1.10.2. Products
- 12.1.10.3. Company Financials
- 12.1.10.4. SWOT Analysis
- 12.1.1 Sandvik
- 12.2. Market Entropy
- 12.2.1 Company's Key Areas Served
- 12.2.2 Recent Developments
- 12.3. Company Market Share Analysis 2025
- 12.3.1 Top 5 Companies Market Share Analysis
- 12.3.2 Top 3 Companies Market Share Analysis
- 12.4. List of Potential Customers
- 13. Research Methodology
List of Figures
- Figure 1: Global Gas Atomized Precision Powder For 3d Printing Revenue Breakdown (million, %) by Region 2025 & 2033
- Figure 2: Global Gas Atomized Precision Powder For 3d Printing Volume Breakdown (K, %) by Region 2025 & 2033
- Figure 3: North America Gas Atomized Precision Powder For 3d Printing Revenue (million), by Application 2025 & 2033
- Figure 4: North America Gas Atomized Precision Powder For 3d Printing Volume (K), by Application 2025 & 2033
- Figure 5: North America Gas Atomized Precision Powder For 3d Printing Revenue Share (%), by Application 2025 & 2033
- Figure 6: North America Gas Atomized Precision Powder For 3d Printing Volume Share (%), by Application 2025 & 2033
- Figure 7: North America Gas Atomized Precision Powder For 3d Printing Revenue (million), by Type 2025 & 2033
- Figure 8: North America Gas Atomized Precision Powder For 3d Printing Volume (K), by Type 2025 & 2033
- Figure 9: North America Gas Atomized Precision Powder For 3d Printing Revenue Share (%), by Type 2025 & 2033
- Figure 10: North America Gas Atomized Precision Powder For 3d Printing Volume Share (%), by Type 2025 & 2033
- Figure 11: North America Gas Atomized Precision Powder For 3d Printing Revenue (million), by Country 2025 & 2033
- Figure 12: North America Gas Atomized Precision Powder For 3d Printing Volume (K), by Country 2025 & 2033
- Figure 13: North America Gas Atomized Precision Powder For 3d Printing Revenue Share (%), by Country 2025 & 2033
- Figure 14: North America Gas Atomized Precision Powder For 3d Printing Volume Share (%), by Country 2025 & 2033
- Figure 15: South America Gas Atomized Precision Powder For 3d Printing Revenue (million), by Application 2025 & 2033
- Figure 16: South America Gas Atomized Precision Powder For 3d Printing Volume (K), by Application 2025 & 2033
- Figure 17: South America Gas Atomized Precision Powder For 3d Printing Revenue Share (%), by Application 2025 & 2033
- Figure 18: South America Gas Atomized Precision Powder For 3d Printing Volume Share (%), by Application 2025 & 2033
- Figure 19: South America Gas Atomized Precision Powder For 3d Printing Revenue (million), by Type 2025 & 2033
- Figure 20: South America Gas Atomized Precision Powder For 3d Printing Volume (K), by Type 2025 & 2033
- Figure 21: South America Gas Atomized Precision Powder For 3d Printing Revenue Share (%), by Type 2025 & 2033
- Figure 22: South America Gas Atomized Precision Powder For 3d Printing Volume Share (%), by Type 2025 & 2033
- Figure 23: South America Gas Atomized Precision Powder For 3d Printing Revenue (million), by Country 2025 & 2033
- Figure 24: South America Gas Atomized Precision Powder For 3d Printing Volume (K), by Country 2025 & 2033
- Figure 25: South America Gas Atomized Precision Powder For 3d Printing Revenue Share (%), by Country 2025 & 2033
- Figure 26: South America Gas Atomized Precision Powder For 3d Printing Volume Share (%), by Country 2025 & 2033
- Figure 27: Europe Gas Atomized Precision Powder For 3d Printing Revenue (million), by Application 2025 & 2033
- Figure 28: Europe Gas Atomized Precision Powder For 3d Printing Volume (K), by Application 2025 & 2033
- Figure 29: Europe Gas Atomized Precision Powder For 3d Printing Revenue Share (%), by Application 2025 & 2033
- Figure 30: Europe Gas Atomized Precision Powder For 3d Printing Volume Share (%), by Application 2025 & 2033
- Figure 31: Europe Gas Atomized Precision Powder For 3d Printing Revenue (million), by Type 2025 & 2033
- Figure 32: Europe Gas Atomized Precision Powder For 3d Printing Volume (K), by Type 2025 & 2033
- Figure 33: Europe Gas Atomized Precision Powder For 3d Printing Revenue Share (%), by Type 2025 & 2033
- Figure 34: Europe Gas Atomized Precision Powder For 3d Printing Volume Share (%), by Type 2025 & 2033
- Figure 35: Europe Gas Atomized Precision Powder For 3d Printing Revenue (million), by Country 2025 & 2033
- Figure 36: Europe Gas Atomized Precision Powder For 3d Printing Volume (K), by Country 2025 & 2033
- Figure 37: Europe Gas Atomized Precision Powder For 3d Printing Revenue Share (%), by Country 2025 & 2033
- Figure 38: Europe Gas Atomized Precision Powder For 3d Printing Volume Share (%), by Country 2025 & 2033
- Figure 39: Middle East & Africa Gas Atomized Precision Powder For 3d Printing Revenue (million), by Application 2025 & 2033
- Figure 40: Middle East & Africa Gas Atomized Precision Powder For 3d Printing Volume (K), by Application 2025 & 2033
- Figure 41: Middle East & Africa Gas Atomized Precision Powder For 3d Printing Revenue Share (%), by Application 2025 & 2033
- Figure 42: Middle East & Africa Gas Atomized Precision Powder For 3d Printing Volume Share (%), by Application 2025 & 2033
- Figure 43: Middle East & Africa Gas Atomized Precision Powder For 3d Printing Revenue (million), by Type 2025 & 2033
- Figure 44: Middle East & Africa Gas Atomized Precision Powder For 3d Printing Volume (K), by Type 2025 & 2033
- Figure 45: Middle East & Africa Gas Atomized Precision Powder For 3d Printing Revenue Share (%), by Type 2025 & 2033
- Figure 46: Middle East & Africa Gas Atomized Precision Powder For 3d Printing Volume Share (%), by Type 2025 & 2033
- Figure 47: Middle East & Africa Gas Atomized Precision Powder For 3d Printing Revenue (million), by Country 2025 & 2033
- Figure 48: Middle East & Africa Gas Atomized Precision Powder For 3d Printing Volume (K), by Country 2025 & 2033
- Figure 49: Middle East & Africa Gas Atomized Precision Powder For 3d Printing Revenue Share (%), by Country 2025 & 2033
- Figure 50: Middle East & Africa Gas Atomized Precision Powder For 3d Printing Volume Share (%), by Country 2025 & 2033
- Figure 51: Asia Pacific Gas Atomized Precision Powder For 3d Printing Revenue (million), by Application 2025 & 2033
- Figure 52: Asia Pacific Gas Atomized Precision Powder For 3d Printing Volume (K), by Application 2025 & 2033
- Figure 53: Asia Pacific Gas Atomized Precision Powder For 3d Printing Revenue Share (%), by Application 2025 & 2033
- Figure 54: Asia Pacific Gas Atomized Precision Powder For 3d Printing Volume Share (%), by Application 2025 & 2033
- Figure 55: Asia Pacific Gas Atomized Precision Powder For 3d Printing Revenue (million), by Type 2025 & 2033
- Figure 56: Asia Pacific Gas Atomized Precision Powder For 3d Printing Volume (K), by Type 2025 & 2033
- Figure 57: Asia Pacific Gas Atomized Precision Powder For 3d Printing Revenue Share (%), by Type 2025 & 2033
- Figure 58: Asia Pacific Gas Atomized Precision Powder For 3d Printing Volume Share (%), by Type 2025 & 2033
- Figure 59: Asia Pacific Gas Atomized Precision Powder For 3d Printing Revenue (million), by Country 2025 & 2033
- Figure 60: Asia Pacific Gas Atomized Precision Powder For 3d Printing Volume (K), by Country 2025 & 2033
- Figure 61: Asia Pacific Gas Atomized Precision Powder For 3d Printing Revenue Share (%), by Country 2025 & 2033
- Figure 62: Asia Pacific Gas Atomized Precision Powder For 3d Printing Volume Share (%), by Country 2025 & 2033
List of Tables
- Table 1: Global Gas Atomized Precision Powder For 3d Printing Revenue million Forecast, by Application 2020 & 2033
- Table 2: Global Gas Atomized Precision Powder For 3d Printing Volume K Forecast, by Application 2020 & 2033
- Table 3: Global Gas Atomized Precision Powder For 3d Printing Revenue million Forecast, by Type 2020 & 2033
- Table 4: Global Gas Atomized Precision Powder For 3d Printing Volume K Forecast, by Type 2020 & 2033
- Table 5: Global Gas Atomized Precision Powder For 3d Printing Revenue million Forecast, by Region 2020 & 2033
- Table 6: Global Gas Atomized Precision Powder For 3d Printing Volume K Forecast, by Region 2020 & 2033
- Table 7: Global Gas Atomized Precision Powder For 3d Printing Revenue million Forecast, by Application 2020 & 2033
- Table 8: Global Gas Atomized Precision Powder For 3d Printing Volume K Forecast, by Application 2020 & 2033
- Table 9: Global Gas Atomized Precision Powder For 3d Printing Revenue million Forecast, by Type 2020 & 2033
- Table 10: Global Gas Atomized Precision Powder For 3d Printing Volume K Forecast, by Type 2020 & 2033
- Table 11: Global Gas Atomized Precision Powder For 3d Printing Revenue million Forecast, by Country 2020 & 2033
- Table 12: Global Gas Atomized Precision Powder For 3d Printing Volume K Forecast, by Country 2020 & 2033
- Table 13: United States Gas Atomized Precision Powder For 3d Printing Revenue (million) Forecast, by Application 2020 & 2033
- Table 14: United States Gas Atomized Precision Powder For 3d Printing Volume (K) Forecast, by Application 2020 & 2033
- Table 15: Canada Gas Atomized Precision Powder For 3d Printing Revenue (million) Forecast, by Application 2020 & 2033
- Table 16: Canada Gas Atomized Precision Powder For 3d Printing Volume (K) Forecast, by Application 2020 & 2033
- Table 17: Mexico Gas Atomized Precision Powder For 3d Printing Revenue (million) Forecast, by Application 2020 & 2033
- Table 18: Mexico Gas Atomized Precision Powder For 3d Printing Volume (K) Forecast, by Application 2020 & 2033
- Table 19: Global Gas Atomized Precision Powder For 3d Printing Revenue million Forecast, by Application 2020 & 2033
- Table 20: Global Gas Atomized Precision Powder For 3d Printing Volume K Forecast, by Application 2020 & 2033
- Table 21: Global Gas Atomized Precision Powder For 3d Printing Revenue million Forecast, by Type 2020 & 2033
- Table 22: Global Gas Atomized Precision Powder For 3d Printing Volume K Forecast, by Type 2020 & 2033
- Table 23: Global Gas Atomized Precision Powder For 3d Printing Revenue million Forecast, by Country 2020 & 2033
- Table 24: Global Gas Atomized Precision Powder For 3d Printing Volume K Forecast, by Country 2020 & 2033
- Table 25: Brazil Gas Atomized Precision Powder For 3d Printing Revenue (million) Forecast, by Application 2020 & 2033
- Table 26: Brazil Gas Atomized Precision Powder For 3d Printing Volume (K) Forecast, by Application 2020 & 2033
- Table 27: Argentina Gas Atomized Precision Powder For 3d Printing Revenue (million) Forecast, by Application 2020 & 2033
- Table 28: Argentina Gas Atomized Precision Powder For 3d Printing Volume (K) Forecast, by Application 2020 & 2033
- Table 29: Rest of South America Gas Atomized Precision Powder For 3d Printing Revenue (million) Forecast, by Application 2020 & 2033
- Table 30: Rest of South America Gas Atomized Precision Powder For 3d Printing Volume (K) Forecast, by Application 2020 & 2033
- Table 31: Global Gas Atomized Precision Powder For 3d Printing Revenue million Forecast, by Application 2020 & 2033
- Table 32: Global Gas Atomized Precision Powder For 3d Printing Volume K Forecast, by Application 2020 & 2033
- Table 33: Global Gas Atomized Precision Powder For 3d Printing Revenue million Forecast, by Type 2020 & 2033
- Table 34: Global Gas Atomized Precision Powder For 3d Printing Volume K Forecast, by Type 2020 & 2033
- Table 35: Global Gas Atomized Precision Powder For 3d Printing Revenue million Forecast, by Country 2020 & 2033
- Table 36: Global Gas Atomized Precision Powder For 3d Printing Volume K Forecast, by Country 2020 & 2033
- Table 37: United Kingdom Gas Atomized Precision Powder For 3d Printing Revenue (million) Forecast, by Application 2020 & 2033
- Table 38: United Kingdom Gas Atomized Precision Powder For 3d Printing Volume (K) Forecast, by Application 2020 & 2033
- Table 39: Germany Gas Atomized Precision Powder For 3d Printing Revenue (million) Forecast, by Application 2020 & 2033
- Table 40: Germany Gas Atomized Precision Powder For 3d Printing Volume (K) Forecast, by Application 2020 & 2033
- Table 41: France Gas Atomized Precision Powder For 3d Printing Revenue (million) Forecast, by Application 2020 & 2033
- Table 42: France Gas Atomized Precision Powder For 3d Printing Volume (K) Forecast, by Application 2020 & 2033
- Table 43: Italy Gas Atomized Precision Powder For 3d Printing Revenue (million) Forecast, by Application 2020 & 2033
- Table 44: Italy Gas Atomized Precision Powder For 3d Printing Volume (K) Forecast, by Application 2020 & 2033
- Table 45: Spain Gas Atomized Precision Powder For 3d Printing Revenue (million) Forecast, by Application 2020 & 2033
- Table 46: Spain Gas Atomized Precision Powder For 3d Printing Volume (K) Forecast, by Application 2020 & 2033
- Table 47: Russia Gas Atomized Precision Powder For 3d Printing Revenue (million) Forecast, by Application 2020 & 2033
- Table 48: Russia Gas Atomized Precision Powder For 3d Printing Volume (K) Forecast, by Application 2020 & 2033
- Table 49: Benelux Gas Atomized Precision Powder For 3d Printing Revenue (million) Forecast, by Application 2020 & 2033
- Table 50: Benelux Gas Atomized Precision Powder For 3d Printing Volume (K) Forecast, by Application 2020 & 2033
- Table 51: Nordics Gas Atomized Precision Powder For 3d Printing Revenue (million) Forecast, by Application 2020 & 2033
- Table 52: Nordics Gas Atomized Precision Powder For 3d Printing Volume (K) Forecast, by Application 2020 & 2033
- Table 53: Rest of Europe Gas Atomized Precision Powder For 3d Printing Revenue (million) Forecast, by Application 2020 & 2033
- Table 54: Rest of Europe Gas Atomized Precision Powder For 3d Printing Volume (K) Forecast, by Application 2020 & 2033
- Table 55: Global Gas Atomized Precision Powder For 3d Printing Revenue million Forecast, by Application 2020 & 2033
- Table 56: Global Gas Atomized Precision Powder For 3d Printing Volume K Forecast, by Application 2020 & 2033
- Table 57: Global Gas Atomized Precision Powder For 3d Printing Revenue million Forecast, by Type 2020 & 2033
- Table 58: Global Gas Atomized Precision Powder For 3d Printing Volume K Forecast, by Type 2020 & 2033
- Table 59: Global Gas Atomized Precision Powder For 3d Printing Revenue million Forecast, by Country 2020 & 2033
- Table 60: Global Gas Atomized Precision Powder For 3d Printing Volume K Forecast, by Country 2020 & 2033
- Table 61: Turkey Gas Atomized Precision Powder For 3d Printing Revenue (million) Forecast, by Application 2020 & 2033
- Table 62: Turkey Gas Atomized Precision Powder For 3d Printing Volume (K) Forecast, by Application 2020 & 2033
- Table 63: Israel Gas Atomized Precision Powder For 3d Printing Revenue (million) Forecast, by Application 2020 & 2033
- Table 64: Israel Gas Atomized Precision Powder For 3d Printing Volume (K) Forecast, by Application 2020 & 2033
- Table 65: GCC Gas Atomized Precision Powder For 3d Printing Revenue (million) Forecast, by Application 2020 & 2033
- Table 66: GCC Gas Atomized Precision Powder For 3d Printing Volume (K) Forecast, by Application 2020 & 2033
- Table 67: North Africa Gas Atomized Precision Powder For 3d Printing Revenue (million) Forecast, by Application 2020 & 2033
- Table 68: North Africa Gas Atomized Precision Powder For 3d Printing Volume (K) Forecast, by Application 2020 & 2033
- Table 69: South Africa Gas Atomized Precision Powder For 3d Printing Revenue (million) Forecast, by Application 2020 & 2033
- Table 70: South Africa Gas Atomized Precision Powder For 3d Printing Volume (K) Forecast, by Application 2020 & 2033
- Table 71: Rest of Middle East & Africa Gas Atomized Precision Powder For 3d Printing Revenue (million) Forecast, by Application 2020 & 2033
- Table 72: Rest of Middle East & Africa Gas Atomized Precision Powder For 3d Printing Volume (K) Forecast, by Application 2020 & 2033
- Table 73: Global Gas Atomized Precision Powder For 3d Printing Revenue million Forecast, by Application 2020 & 2033
- Table 74: Global Gas Atomized Precision Powder For 3d Printing Volume K Forecast, by Application 2020 & 2033
- Table 75: Global Gas Atomized Precision Powder For 3d Printing Revenue million Forecast, by Type 2020 & 2033
- Table 76: Global Gas Atomized Precision Powder For 3d Printing Volume K Forecast, by Type 2020 & 2033
- Table 77: Global Gas Atomized Precision Powder For 3d Printing Revenue million Forecast, by Country 2020 & 2033
- Table 78: Global Gas Atomized Precision Powder For 3d Printing Volume K Forecast, by Country 2020 & 2033
- Table 79: China Gas Atomized Precision Powder For 3d Printing Revenue (million) Forecast, by Application 2020 & 2033
- Table 80: China Gas Atomized Precision Powder For 3d Printing Volume (K) Forecast, by Application 2020 & 2033
- Table 81: India Gas Atomized Precision Powder For 3d Printing Revenue (million) Forecast, by Application 2020 & 2033
- Table 82: India Gas Atomized Precision Powder For 3d Printing Volume (K) Forecast, by Application 2020 & 2033
- Table 83: Japan Gas Atomized Precision Powder For 3d Printing Revenue (million) Forecast, by Application 2020 & 2033
- Table 84: Japan Gas Atomized Precision Powder For 3d Printing Volume (K) Forecast, by Application 2020 & 2033
- Table 85: South Korea Gas Atomized Precision Powder For 3d Printing Revenue (million) Forecast, by Application 2020 & 2033
- Table 86: South Korea Gas Atomized Precision Powder For 3d Printing Volume (K) Forecast, by Application 2020 & 2033
- Table 87: ASEAN Gas Atomized Precision Powder For 3d Printing Revenue (million) Forecast, by Application 2020 & 2033
- Table 88: ASEAN Gas Atomized Precision Powder For 3d Printing Volume (K) Forecast, by Application 2020 & 2033
- Table 89: Oceania Gas Atomized Precision Powder For 3d Printing Revenue (million) Forecast, by Application 2020 & 2033
- Table 90: Oceania Gas Atomized Precision Powder For 3d Printing Volume (K) Forecast, by Application 2020 & 2033
- Table 91: Rest of Asia Pacific Gas Atomized Precision Powder For 3d Printing Revenue (million) Forecast, by Application 2020 & 2033
- Table 92: Rest of Asia Pacific Gas Atomized Precision Powder For 3d Printing Volume (K) Forecast, by Application 2020 & 2033
Frequently Asked Questions
1. What is the projected Compound Annual Growth Rate (CAGR) of the Gas Atomized Precision Powder For 3d Printing?
The projected CAGR is approximately 15.3%.
2. Which companies are prominent players in the Gas Atomized Precision Powder For 3d Printing?
Key companies in the market include Sandvik, Linde, SANYO SPECIAL STEEL, Carpenter Technology, GKN Hoeganaes, Jiangsu Vilory Advanced Materials Technology, Voestalpine, Oerlikon, Safina, Höganäs.
3. What are the main segments of the Gas Atomized Precision Powder For 3d Printing?
The market segments include Application, Type.
4. Can you provide details about the market size?
The market size is estimated to be USD 855 million as of 2022.
5. What are some drivers contributing to market growth?
N/A
6. What are the notable trends driving market growth?
N/A
7. Are there any restraints impacting market growth?
N/A
8. Can you provide examples of recent developments in the market?
N/A
9. What pricing options are available for accessing the report?
Pricing options include single-user, multi-user, and enterprise licenses priced at USD 3950.00, USD 5925.00, and USD 7900.00 respectively.
10. Is the market size provided in terms of value or volume?
The market size is provided in terms of value, measured in million and volume, measured in K.
11. Are there any specific market keywords associated with the report?
Yes, the market keyword associated with the report is "Gas Atomized Precision Powder For 3d Printing," which aids in identifying and referencing the specific market segment covered.
12. How do I determine which pricing option suits my needs best?
The pricing options vary based on user requirements and access needs. Individual users may opt for single-user licenses, while businesses requiring broader access may choose multi-user or enterprise licenses for cost-effective access to the report.
13. Are there any additional resources or data provided in the Gas Atomized Precision Powder For 3d Printing report?
While the report offers comprehensive insights, it's advisable to review the specific contents or supplementary materials provided to ascertain if additional resources or data are available.
14. How can I stay updated on further developments or reports in the Gas Atomized Precision Powder For 3d Printing?
To stay informed about further developments, trends, and reports in the Gas Atomized Precision Powder For 3d Printing, consider subscribing to industry newsletters, following relevant companies and organizations, or regularly checking reputable industry news sources and publications.
Methodology
Step 1 - Identification of Relevant Samples Size from Population Database


Step 2 - Approaches for Defining Global Market Size (Value, Volume* & Price*)

Note*: In applicable scenarios
Step 3 - Data Sources
Primary Research
- Web Analytics
- Survey Reports
- Research Institute
- Latest Research Reports
- Opinion Leaders
Secondary Research
- Annual Reports
- White Paper
- Latest Press Release
- Industry Association
- Paid Database
- Investor Presentations

Step 4 - Data Triangulation
Involves using different sources of information in order to increase the validity of a study
These sources are likely to be stakeholders in a program - participants, other researchers, program staff, other community members, and so on.
Then we put all data in single framework & apply various statistical tools to find out the dynamic on the market.
During the analysis stage, feedback from the stakeholder groups would be compared to determine areas of agreement as well as areas of divergence

