Key Insights
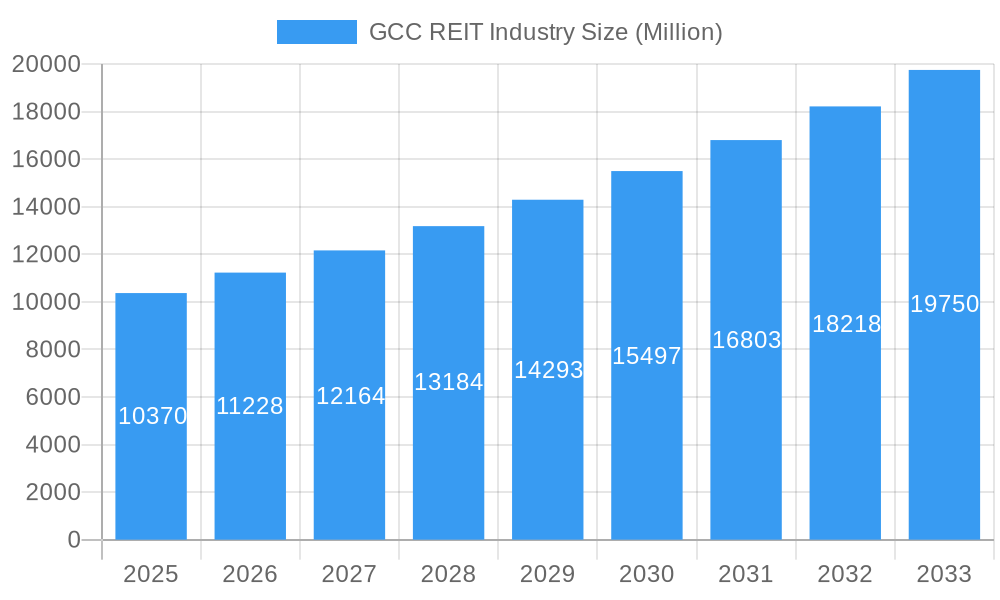
The GCC REIT (Real Estate Investment Trust) industry, valued at $10.37 billion in 2025, is poised for robust growth, projected to expand at a Compound Annual Growth Rate (CAGR) of 8.24% from 2025 to 2033. This expansion is fueled by several key factors. Firstly, increasing urbanization and a burgeoning population across the Gulf Cooperation Council (GCC) nations are driving demand for commercial, residential, and industrial spaces. Government initiatives promoting diversification away from oil dependence and fostering foreign investment are creating a favorable investment climate for REITs. The development of sophisticated infrastructure, particularly in logistics and tourism, further enhances the appeal of REIT investments. Furthermore, the increasing preference for institutional-grade real estate assets among both domestic and international investors contributes significantly to market growth. Competition is expected to remain moderate, though consolidation within the sector is likely as larger players seek to expand their portfolios.
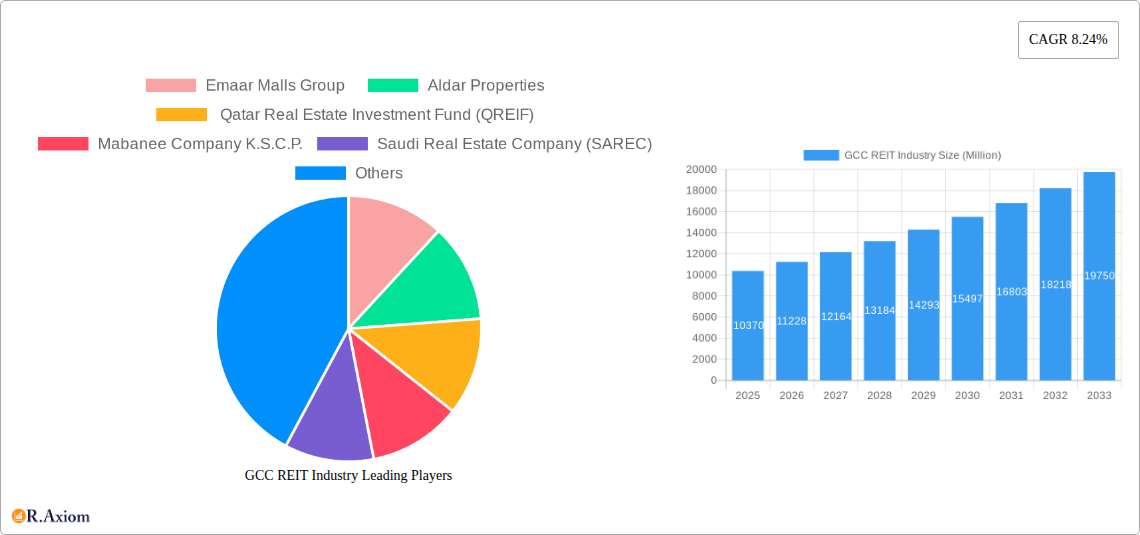
GCC REIT Industry Market Size (In Billion)
However, the GCC REIT market is not without challenges. Interest rate fluctuations and global economic uncertainties can impact investor sentiment and investment flows. Regulatory frameworks governing REIT operations, while improving, may still present some hurdles for market expansion. Furthermore, the sector's vulnerability to geopolitical risks necessitates robust risk management strategies. Nevertheless, the long-term outlook for the GCC REIT market remains positive, driven by the region's robust economic fundamentals and sustained growth in its real estate sector. The diversification of REIT offerings, including expansion into sectors like healthcare and hospitality, will likely further fuel growth and attract a wider range of investors. The presence of established players like Emaar Malls Group and Aldar Properties, alongside emerging players, contributes to the dynamism of this rapidly evolving market.
GCC REIT Industry Company Market Share
GCC REIT Industry: A Comprehensive Market Report (2019-2033)
This detailed report provides a comprehensive analysis of the GCC REIT industry, covering market trends, key players, and future growth prospects from 2019 to 2033. The report leverages extensive data analysis and expert insights to offer actionable intelligence for investors, industry stakeholders, and businesses operating within this dynamic sector. With a focus on key performance indicators (KPIs) and a detailed segmentation, this report is an indispensable resource for navigating the complexities of the GCC REIT market.
GCC REIT Industry Market Concentration & Innovation
The GCC REIT market exhibits a moderate level of concentration, with a few dominant players alongside a growing number of smaller firms. Market share data for 2024 reveals Emaar Malls Group holding approximately xx% market share, followed by Aldar Properties with xx%, and other players such as QREIF and SAREC commanding smaller, but significant percentages. Innovation is driven by technological advancements, such as proptech solutions for property management and tenant engagement, and regulatory reforms aimed at attracting foreign investment. The regulatory landscape, while evolving, presents both opportunities and challenges, particularly regarding transparency and standardization. Product substitutes, such as direct real estate investment, compete for investor attention, but REITs offer diversification benefits and liquidity advantages. End-user trends favor diversified portfolios and higher returns, prompting REITs to offer innovative products. M&A activity has been noteworthy; for example, the xx Million deal between [Company A] and [Company B] in [Year] reflects a strategic drive to consolidate market share. The average M&A deal value over the period 2019-2024 was approximately xx Million.
- Market Share (2024): Emaar Malls Group (xx%), Aldar Properties (xx%), QREIF (xx%), Others (xx%).
- M&A Deal Values (2019-2024): Average xx Million, Total xx Million.
- Key Innovation Drivers: Proptech, Regulatory Reforms, Investor Demand for Diversification.
GCC REIT Industry Industry Trends & Insights
The GCC REIT industry is experiencing robust growth, driven by increasing urbanization, burgeoning tourism, and supportive government policies. The Compound Annual Growth Rate (CAGR) from 2019 to 2024 was estimated at xx%, and is projected to reach xx% from 2025 to 2033. Technological disruptions, including the use of AI and big data analytics in property management and valuation, are transforming operational efficiency. Consumer preferences are shifting towards sustainable and technologically advanced properties, which will pressure REITs to adapt. The market is characterized by both intense competition and strategic collaborations, with a focus on differentiated product offerings and value-added services. Market penetration rates for REITs in the GCC remain relatively low compared to mature markets, indicating significant untapped potential.
Dominant Markets & Segments in GCC REIT Industry
The UAE and Saudi Arabia represent the dominant markets within the GCC REIT industry, driven by robust economic growth, significant infrastructure development, and supportive regulatory environments. Within property types, Commercial REITs maintain the largest market share, benefiting from high occupancy rates and stable rental income.
- Dominant Region: UAE and Saudi Arabia.
- Dominant Property Type: Commercial REITs.
- Dominant Investment Type: Equity REITs.
Key Drivers for UAE and Saudi Arabia:
- Strong Economic Growth: Sustained GDP growth fueled by diversification and government investment.
- Infrastructure Development: Major projects, such as Expo 2020 Dubai and NEOM, spurring demand for real estate.
- Supportive Government Policies: Initiatives designed to boost the REIT market, including tax incentives and regulatory frameworks.
Dominance Analysis: The dominance of Commercial and Equity REITs stems from their relatively lower risk profiles and consistent returns compared to other segments. However, growth in other segments, such as residential and logistics, is anticipated, driven by changing demographics and supply chain dynamics.
GCC REIT Industry Product Developments
Product innovation within the GCC REIT industry centers on enhancing portfolio diversification, incorporating sustainable practices, and leveraging technological advancements to optimize asset management. New REIT offerings are increasingly incorporating mixed-use properties, incorporating retail, residential, and hospitality components, providing greater resilience to market fluctuations. The adoption of proptech solutions for property management and tenant interaction is also improving operational efficiencies and enhancing investor transparency. This alignment with technological trends ensures market fit and competitive advantage.
Report Scope & Segmentation Analysis
This report segments the GCC REIT market based on property type and investment type.
By Property Type:
Commercial REITs: This segment comprises office buildings, retail spaces, and other commercial properties. Growth is projected at xx% CAGR during the forecast period. Competitive dynamics are shaped by tenant demand and location-based advantages.
Residential REITs: This segment involves apartment complexes, residential buildings, and other related assets. Growth is expected at xx% CAGR. Competitive dynamics are driven by population growth and affordability.
Industrial & Logistics REITs: This segment includes warehouses, distribution centers, and other logistics facilities. Growth is forecast at xx% CAGR. Competition is centered around location, infrastructure, and efficient operations.
Healthcare REITs: This sector encompasses hospitals, medical office buildings, and other healthcare properties. Growth is projected at xx% CAGR. Competition focuses on location and specialized medical facilities.
Hospitality REITs: This segment includes hotels, resorts, and other hospitality facilities. Growth is expected at xx% CAGR. Competition is based on location, brand reputation, and service offerings.
By Investment Type:
Equity REITs: These REITs own and operate real estate properties directly. Growth is projected at xx% CAGR. Competitive dynamics revolve around asset quality and management expertise.
Mortgage REITs: These REITs invest primarily in mortgages and mortgage-backed securities. Growth is expected at xx% CAGR. Competitive dynamics center around interest rate risk and credit risk assessment.
Key Drivers of GCC REIT Industry Growth
Several factors contribute to the growth of the GCC REIT industry. These include supportive government policies that incentivize REIT formation and investment; robust economic growth and rising urban populations driving demand for real estate; and infrastructure development projects creating opportunities for new developments. Technological advancements, such as proptech and data analytics, improve efficiency and transparency, enhancing market appeal.
Challenges in the GCC REIT Industry Sector
Challenges include regulatory uncertainties in some GCC countries, although this is improving. Competition from other asset classes, such as private equity, and dependence on foreign investment remain significant. Supply chain disruptions, particularly in construction materials, can impact project timelines and profitability.
Emerging Opportunities in GCC REIT Industry
Emerging opportunities include the growth of the tourism sector, creating demand for hospitality REITs; the expansion of e-commerce, driving demand for logistics REITs; and a focus on sustainable and green buildings, attracting environmentally conscious investors. Further regulatory clarity and enhanced investor education will also support market expansion.
Leading Players in the GCC REIT Industry Market
- Emaar Malls Group
- Aldar Properties
- Qatar Real Estate Investment Fund (QREIF)
- Mabanee Company K.S.C.P.
- Saudi Real Estate Company (SAREC)
- Mall of Oman
- National Real Estate Company (NREC)
Key Developments in GCC REIT Industry Industry
- September 2022: Saudi Arabia introduces a real estate investment trust (REIT) regime, significantly boosting market potential.
- November 2016: Riyad REIT becomes the first REIT listed in Saudi Arabia, paving the way for subsequent listings.
- July 2022: A total of 18 REITs are listed in Saudi Arabia following the initial listing of Riyad REIT.
- January 2021: The Dubai Financial Market (DFM) begins trading in REITs, expanding market access and liquidity.
Strategic Outlook for GCC REIT Industry Market
The GCC REIT industry is poised for continued growth, driven by supportive government policies, burgeoning demand for real estate, and technological advancements. The diversification of REIT portfolios, focus on sustainable practices, and adoption of innovative technologies will shape future market dynamics, creating opportunities for both established and emerging players. The market is expected to continue its expansion in line with the broader economic growth and infrastructure development in the region. Further regulatory developments, aimed at enhancing transparency and investor protection, will further bolster the growth trajectory.
GCC REIT Industry Segmentation
- 1. Production Analysis
- 2. Consumption Analysis
- 3. Import Market Analysis (Value & Volume)
- 4. Export Market Analysis (Value & Volume)
- 5. Price Trend Analysis
GCC REIT Industry Segmentation By Geography
-
1. North America
- 1.1. United States
- 1.2. Canada
- 1.3. Mexico
-
2. South America
- 2.1. Brazil
- 2.2. Argentina
- 2.3. Rest of South America
-
3. Europe
- 3.1. United Kingdom
- 3.2. Germany
- 3.3. France
- 3.4. Italy
- 3.5. Spain
- 3.6. Russia
- 3.7. Benelux
- 3.8. Nordics
- 3.9. Rest of Europe
-
4. Middle East & Africa
- 4.1. Turkey
- 4.2. Israel
- 4.3. GCC
- 4.4. North Africa
- 4.5. South Africa
- 4.6. Rest of Middle East & Africa
-
5. Asia Pacific
- 5.1. China
- 5.2. India
- 5.3. Japan
- 5.4. South Korea
- 5.5. ASEAN
- 5.6. Oceania
- 5.7. Rest of Asia Pacific
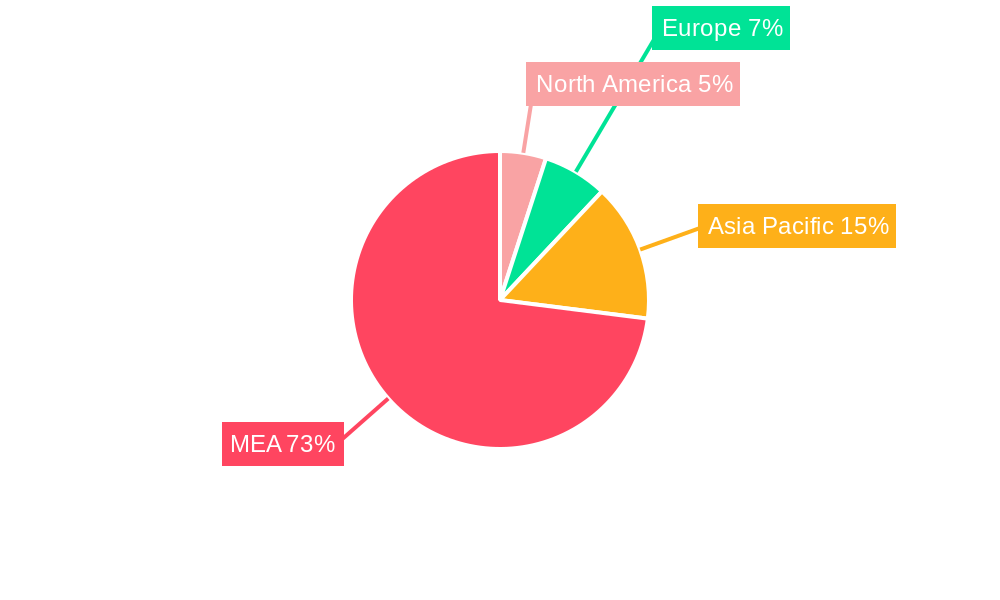
GCC REIT Industry Regional Market Share
Geographic Coverage of GCC REIT Industry
GCC REIT Industry REPORT HIGHLIGHTS
| Aspects | Details |
|---|---|
| Study Period | 2020-2034 |
| Base Year | 2025 |
| Estimated Year | 2026 |
| Forecast Period | 2026-2034 |
| Historical Period | 2020-2025 |
| Growth Rate | CAGR of 8.24% from 2020-2034 |
| Segmentation |
|
Table of Contents
- 1. Introduction
- 1.1. Research Scope
- 1.2. Market Segmentation
- 1.3. Research Objective
- 1.4. Definitions and Assumptions
- 2. Executive Summary
- 2.1. Market Snapshot
- 3. Market Dynamics
- 3.1. Market Drivers
- 3.2. Market Restrains
- 3.3. Market Trends
- 3.4. Market Opportunities
- 4. Market Factor Analysis
- 4.1. Porters Five Forces
- 4.1.1. Bargaining Power of Suppliers
- 4.1.2. Bargaining Power of Buyers
- 4.1.3. Threat of New Entrants
- 4.1.4. Threat of Substitutes
- 4.1.5. Competitive Rivalry
- 4.2. PESTEL analysis
- 4.3. BCG Analysis
- 4.3.1. Stars (High Growth, High Market Share)
- 4.3.2. Cash Cows (Low Growth, High Market Share)
- 4.3.3. Question Mark (High Growth, Low Market Share)
- 4.3.4. Dogs (Low Growth, Low Market Share)
- 4.4. Ansoff Matrix Analysis
- 4.5. Supply Chain Analysis
- 4.6. Regulatory Landscape
- 4.7. Current Market Potential and Opportunity Assessment (TAM–SAM–SOM Framework)
- 4.8. RAX Analyst Note
- 4.1. Porters Five Forces
- 5. Market Analysis, Insights and Forecast 2021-2033
- 5.1. Market Analysis, Insights and Forecast - by Production Analysis
- 5.2. Market Analysis, Insights and Forecast - by Consumption Analysis
- 5.3. Market Analysis, Insights and Forecast - by Import Market Analysis (Value & Volume)
- 5.4. Market Analysis, Insights and Forecast - by Export Market Analysis (Value & Volume)
- 5.5. Market Analysis, Insights and Forecast - by Price Trend Analysis
- 5.6. Market Analysis, Insights and Forecast - by Region
- 5.6.1. North America
- 5.6.2. South America
- 5.6.3. Europe
- 5.6.4. Middle East & Africa
- 5.6.5. Asia Pacific
- 6. Global GCC REIT Industry Analysis, Insights and Forecast, 2021-2033
- 6.1. Market Analysis, Insights and Forecast - by Production Analysis
- 6.2. Market Analysis, Insights and Forecast - by Consumption Analysis
- 6.3. Market Analysis, Insights and Forecast - by Import Market Analysis (Value & Volume)
- 6.4. Market Analysis, Insights and Forecast - by Export Market Analysis (Value & Volume)
- 6.5. Market Analysis, Insights and Forecast - by Price Trend Analysis
- 7. North America GCC REIT Industry Analysis, Insights and Forecast, 2020-2032
- 7.1. Market Analysis, Insights and Forecast - by Production Analysis
- 7.2. Market Analysis, Insights and Forecast - by Consumption Analysis
- 7.3. Market Analysis, Insights and Forecast - by Import Market Analysis (Value & Volume)
- 7.4. Market Analysis, Insights and Forecast - by Export Market Analysis (Value & Volume)
- 7.5. Market Analysis, Insights and Forecast - by Price Trend Analysis
- 8. South America GCC REIT Industry Analysis, Insights and Forecast, 2020-2032
- 8.1. Market Analysis, Insights and Forecast - by Production Analysis
- 8.2. Market Analysis, Insights and Forecast - by Consumption Analysis
- 8.3. Market Analysis, Insights and Forecast - by Import Market Analysis (Value & Volume)
- 8.4. Market Analysis, Insights and Forecast - by Export Market Analysis (Value & Volume)
- 8.5. Market Analysis, Insights and Forecast - by Price Trend Analysis
- 9. Europe GCC REIT Industry Analysis, Insights and Forecast, 2020-2032
- 9.1. Market Analysis, Insights and Forecast - by Production Analysis
- 9.2. Market Analysis, Insights and Forecast - by Consumption Analysis
- 9.3. Market Analysis, Insights and Forecast - by Import Market Analysis (Value & Volume)
- 9.4. Market Analysis, Insights and Forecast - by Export Market Analysis (Value & Volume)
- 9.5. Market Analysis, Insights and Forecast - by Price Trend Analysis
- 10. Middle East & Africa GCC REIT Industry Analysis, Insights and Forecast, 2020-2032
- 10.1. Market Analysis, Insights and Forecast - by Production Analysis
- 10.2. Market Analysis, Insights and Forecast - by Consumption Analysis
- 10.3. Market Analysis, Insights and Forecast - by Import Market Analysis (Value & Volume)
- 10.4. Market Analysis, Insights and Forecast - by Export Market Analysis (Value & Volume)
- 10.5. Market Analysis, Insights and Forecast - by Price Trend Analysis
- 11. Asia Pacific GCC REIT Industry Analysis, Insights and Forecast, 2020-2032
- 11.1. Market Analysis, Insights and Forecast - by Production Analysis
- 11.2. Market Analysis, Insights and Forecast - by Consumption Analysis
- 11.3. Market Analysis, Insights and Forecast - by Import Market Analysis (Value & Volume)
- 11.4. Market Analysis, Insights and Forecast - by Export Market Analysis (Value & Volume)
- 11.5. Market Analysis, Insights and Forecast - by Price Trend Analysis
- 12. Competitive Analysis
- 12.1. Company Profiles
- 12.1.1 Emaar Malls Group
- 12.1.1.1. Company Overview
- 12.1.1.2. Products
- 12.1.1.3. Company Financials
- 12.1.1.4. SWOT Analysis
- 12.1.2 Aldar Properties
- 12.1.2.1. Company Overview
- 12.1.2.2. Products
- 12.1.2.3. Company Financials
- 12.1.2.4. SWOT Analysis
- 12.1.3 Qatar Real Estate Investment Fund (QREIF)
- 12.1.3.1. Company Overview
- 12.1.3.2. Products
- 12.1.3.3. Company Financials
- 12.1.3.4. SWOT Analysis
- 12.1.4 Mabanee Company K.S.C.P.
- 12.1.4.1. Company Overview
- 12.1.4.2. Products
- 12.1.4.3. Company Financials
- 12.1.4.4. SWOT Analysis
- 12.1.5 Saudi Real Estate Company (SAREC)
- 12.1.5.1. Company Overview
- 12.1.5.2. Products
- 12.1.5.3. Company Financials
- 12.1.5.4. SWOT Analysis
- 12.1.6 Mall of Oman
- 12.1.6.1. Company Overview
- 12.1.6.2. Products
- 12.1.6.3. Company Financials
- 12.1.6.4. SWOT Analysis
- 12.1.7 National Real Estate Company (NREC)
- 12.1.7.1. Company Overview
- 12.1.7.2. Products
- 12.1.7.3. Company Financials
- 12.1.7.4. SWOT Analysis
- 12.1.1 Emaar Malls Group
- 12.2. Market Entropy
- 12.2.1 Company's Key Areas Served
- 12.2.2 Recent Developments
- 12.3. Company Market Share Analysis 2025
- 12.3.1 Top 5 Companies Market Share Analysis
- 12.3.2 Top 3 Companies Market Share Analysis
- 12.4. List of Potential Customers
- 13. Research Methodology
List of Figures
- Figure 1: Global GCC REIT Industry Revenue Breakdown (Million, %) by Region 2025 & 2033
- Figure 2: North America GCC REIT Industry Revenue (Million), by Production Analysis 2025 & 2033
- Figure 3: North America GCC REIT Industry Revenue Share (%), by Production Analysis 2025 & 2033
- Figure 4: North America GCC REIT Industry Revenue (Million), by Consumption Analysis 2025 & 2033
- Figure 5: North America GCC REIT Industry Revenue Share (%), by Consumption Analysis 2025 & 2033
- Figure 6: North America GCC REIT Industry Revenue (Million), by Import Market Analysis (Value & Volume) 2025 & 2033
- Figure 7: North America GCC REIT Industry Revenue Share (%), by Import Market Analysis (Value & Volume) 2025 & 2033
- Figure 8: North America GCC REIT Industry Revenue (Million), by Export Market Analysis (Value & Volume) 2025 & 2033
- Figure 9: North America GCC REIT Industry Revenue Share (%), by Export Market Analysis (Value & Volume) 2025 & 2033
- Figure 10: North America GCC REIT Industry Revenue (Million), by Price Trend Analysis 2025 & 2033
- Figure 11: North America GCC REIT Industry Revenue Share (%), by Price Trend Analysis 2025 & 2033
- Figure 12: North America GCC REIT Industry Revenue (Million), by Country 2025 & 2033
- Figure 13: North America GCC REIT Industry Revenue Share (%), by Country 2025 & 2033
- Figure 14: South America GCC REIT Industry Revenue (Million), by Production Analysis 2025 & 2033
- Figure 15: South America GCC REIT Industry Revenue Share (%), by Production Analysis 2025 & 2033
- Figure 16: South America GCC REIT Industry Revenue (Million), by Consumption Analysis 2025 & 2033
- Figure 17: South America GCC REIT Industry Revenue Share (%), by Consumption Analysis 2025 & 2033
- Figure 18: South America GCC REIT Industry Revenue (Million), by Import Market Analysis (Value & Volume) 2025 & 2033
- Figure 19: South America GCC REIT Industry Revenue Share (%), by Import Market Analysis (Value & Volume) 2025 & 2033
- Figure 20: South America GCC REIT Industry Revenue (Million), by Export Market Analysis (Value & Volume) 2025 & 2033
- Figure 21: South America GCC REIT Industry Revenue Share (%), by Export Market Analysis (Value & Volume) 2025 & 2033
- Figure 22: South America GCC REIT Industry Revenue (Million), by Price Trend Analysis 2025 & 2033
- Figure 23: South America GCC REIT Industry Revenue Share (%), by Price Trend Analysis 2025 & 2033
- Figure 24: South America GCC REIT Industry Revenue (Million), by Country 2025 & 2033
- Figure 25: South America GCC REIT Industry Revenue Share (%), by Country 2025 & 2033
- Figure 26: Europe GCC REIT Industry Revenue (Million), by Production Analysis 2025 & 2033
- Figure 27: Europe GCC REIT Industry Revenue Share (%), by Production Analysis 2025 & 2033
- Figure 28: Europe GCC REIT Industry Revenue (Million), by Consumption Analysis 2025 & 2033
- Figure 29: Europe GCC REIT Industry Revenue Share (%), by Consumption Analysis 2025 & 2033
- Figure 30: Europe GCC REIT Industry Revenue (Million), by Import Market Analysis (Value & Volume) 2025 & 2033
- Figure 31: Europe GCC REIT Industry Revenue Share (%), by Import Market Analysis (Value & Volume) 2025 & 2033
- Figure 32: Europe GCC REIT Industry Revenue (Million), by Export Market Analysis (Value & Volume) 2025 & 2033
- Figure 33: Europe GCC REIT Industry Revenue Share (%), by Export Market Analysis (Value & Volume) 2025 & 2033
- Figure 34: Europe GCC REIT Industry Revenue (Million), by Price Trend Analysis 2025 & 2033
- Figure 35: Europe GCC REIT Industry Revenue Share (%), by Price Trend Analysis 2025 & 2033
- Figure 36: Europe GCC REIT Industry Revenue (Million), by Country 2025 & 2033
- Figure 37: Europe GCC REIT Industry Revenue Share (%), by Country 2025 & 2033
- Figure 38: Middle East & Africa GCC REIT Industry Revenue (Million), by Production Analysis 2025 & 2033
- Figure 39: Middle East & Africa GCC REIT Industry Revenue Share (%), by Production Analysis 2025 & 2033
- Figure 40: Middle East & Africa GCC REIT Industry Revenue (Million), by Consumption Analysis 2025 & 2033
- Figure 41: Middle East & Africa GCC REIT Industry Revenue Share (%), by Consumption Analysis 2025 & 2033
- Figure 42: Middle East & Africa GCC REIT Industry Revenue (Million), by Import Market Analysis (Value & Volume) 2025 & 2033
- Figure 43: Middle East & Africa GCC REIT Industry Revenue Share (%), by Import Market Analysis (Value & Volume) 2025 & 2033
- Figure 44: Middle East & Africa GCC REIT Industry Revenue (Million), by Export Market Analysis (Value & Volume) 2025 & 2033
- Figure 45: Middle East & Africa GCC REIT Industry Revenue Share (%), by Export Market Analysis (Value & Volume) 2025 & 2033
- Figure 46: Middle East & Africa GCC REIT Industry Revenue (Million), by Price Trend Analysis 2025 & 2033
- Figure 47: Middle East & Africa GCC REIT Industry Revenue Share (%), by Price Trend Analysis 2025 & 2033
- Figure 48: Middle East & Africa GCC REIT Industry Revenue (Million), by Country 2025 & 2033
- Figure 49: Middle East & Africa GCC REIT Industry Revenue Share (%), by Country 2025 & 2033
- Figure 50: Asia Pacific GCC REIT Industry Revenue (Million), by Production Analysis 2025 & 2033
- Figure 51: Asia Pacific GCC REIT Industry Revenue Share (%), by Production Analysis 2025 & 2033
- Figure 52: Asia Pacific GCC REIT Industry Revenue (Million), by Consumption Analysis 2025 & 2033
- Figure 53: Asia Pacific GCC REIT Industry Revenue Share (%), by Consumption Analysis 2025 & 2033
- Figure 54: Asia Pacific GCC REIT Industry Revenue (Million), by Import Market Analysis (Value & Volume) 2025 & 2033
- Figure 55: Asia Pacific GCC REIT Industry Revenue Share (%), by Import Market Analysis (Value & Volume) 2025 & 2033
- Figure 56: Asia Pacific GCC REIT Industry Revenue (Million), by Export Market Analysis (Value & Volume) 2025 & 2033
- Figure 57: Asia Pacific GCC REIT Industry Revenue Share (%), by Export Market Analysis (Value & Volume) 2025 & 2033
- Figure 58: Asia Pacific GCC REIT Industry Revenue (Million), by Price Trend Analysis 2025 & 2033
- Figure 59: Asia Pacific GCC REIT Industry Revenue Share (%), by Price Trend Analysis 2025 & 2033
- Figure 60: Asia Pacific GCC REIT Industry Revenue (Million), by Country 2025 & 2033
- Figure 61: Asia Pacific GCC REIT Industry Revenue Share (%), by Country 2025 & 2033
List of Tables
- Table 1: Global GCC REIT Industry Revenue Million Forecast, by Production Analysis 2020 & 2033
- Table 2: Global GCC REIT Industry Revenue Million Forecast, by Consumption Analysis 2020 & 2033
- Table 3: Global GCC REIT Industry Revenue Million Forecast, by Import Market Analysis (Value & Volume) 2020 & 2033
- Table 4: Global GCC REIT Industry Revenue Million Forecast, by Export Market Analysis (Value & Volume) 2020 & 2033
- Table 5: Global GCC REIT Industry Revenue Million Forecast, by Price Trend Analysis 2020 & 2033
- Table 6: Global GCC REIT Industry Revenue Million Forecast, by Region 2020 & 2033
- Table 7: Global GCC REIT Industry Revenue Million Forecast, by Production Analysis 2020 & 2033
- Table 8: Global GCC REIT Industry Revenue Million Forecast, by Consumption Analysis 2020 & 2033
- Table 9: Global GCC REIT Industry Revenue Million Forecast, by Import Market Analysis (Value & Volume) 2020 & 2033
- Table 10: Global GCC REIT Industry Revenue Million Forecast, by Export Market Analysis (Value & Volume) 2020 & 2033
- Table 11: Global GCC REIT Industry Revenue Million Forecast, by Price Trend Analysis 2020 & 2033
- Table 12: Global GCC REIT Industry Revenue Million Forecast, by Country 2020 & 2033
- Table 13: United States GCC REIT Industry Revenue (Million) Forecast, by Application 2020 & 2033
- Table 14: Canada GCC REIT Industry Revenue (Million) Forecast, by Application 2020 & 2033
- Table 15: Mexico GCC REIT Industry Revenue (Million) Forecast, by Application 2020 & 2033
- Table 16: Global GCC REIT Industry Revenue Million Forecast, by Production Analysis 2020 & 2033
- Table 17: Global GCC REIT Industry Revenue Million Forecast, by Consumption Analysis 2020 & 2033
- Table 18: Global GCC REIT Industry Revenue Million Forecast, by Import Market Analysis (Value & Volume) 2020 & 2033
- Table 19: Global GCC REIT Industry Revenue Million Forecast, by Export Market Analysis (Value & Volume) 2020 & 2033
- Table 20: Global GCC REIT Industry Revenue Million Forecast, by Price Trend Analysis 2020 & 2033
- Table 21: Global GCC REIT Industry Revenue Million Forecast, by Country 2020 & 2033
- Table 22: Brazil GCC REIT Industry Revenue (Million) Forecast, by Application 2020 & 2033
- Table 23: Argentina GCC REIT Industry Revenue (Million) Forecast, by Application 2020 & 2033
- Table 24: Rest of South America GCC REIT Industry Revenue (Million) Forecast, by Application 2020 & 2033
- Table 25: Global GCC REIT Industry Revenue Million Forecast, by Production Analysis 2020 & 2033
- Table 26: Global GCC REIT Industry Revenue Million Forecast, by Consumption Analysis 2020 & 2033
- Table 27: Global GCC REIT Industry Revenue Million Forecast, by Import Market Analysis (Value & Volume) 2020 & 2033
- Table 28: Global GCC REIT Industry Revenue Million Forecast, by Export Market Analysis (Value & Volume) 2020 & 2033
- Table 29: Global GCC REIT Industry Revenue Million Forecast, by Price Trend Analysis 2020 & 2033
- Table 30: Global GCC REIT Industry Revenue Million Forecast, by Country 2020 & 2033
- Table 31: United Kingdom GCC REIT Industry Revenue (Million) Forecast, by Application 2020 & 2033
- Table 32: Germany GCC REIT Industry Revenue (Million) Forecast, by Application 2020 & 2033
- Table 33: France GCC REIT Industry Revenue (Million) Forecast, by Application 2020 & 2033
- Table 34: Italy GCC REIT Industry Revenue (Million) Forecast, by Application 2020 & 2033
- Table 35: Spain GCC REIT Industry Revenue (Million) Forecast, by Application 2020 & 2033
- Table 36: Russia GCC REIT Industry Revenue (Million) Forecast, by Application 2020 & 2033
- Table 37: Benelux GCC REIT Industry Revenue (Million) Forecast, by Application 2020 & 2033
- Table 38: Nordics GCC REIT Industry Revenue (Million) Forecast, by Application 2020 & 2033
- Table 39: Rest of Europe GCC REIT Industry Revenue (Million) Forecast, by Application 2020 & 2033
- Table 40: Global GCC REIT Industry Revenue Million Forecast, by Production Analysis 2020 & 2033
- Table 41: Global GCC REIT Industry Revenue Million Forecast, by Consumption Analysis 2020 & 2033
- Table 42: Global GCC REIT Industry Revenue Million Forecast, by Import Market Analysis (Value & Volume) 2020 & 2033
- Table 43: Global GCC REIT Industry Revenue Million Forecast, by Export Market Analysis (Value & Volume) 2020 & 2033
- Table 44: Global GCC REIT Industry Revenue Million Forecast, by Price Trend Analysis 2020 & 2033
- Table 45: Global GCC REIT Industry Revenue Million Forecast, by Country 2020 & 2033
- Table 46: Turkey GCC REIT Industry Revenue (Million) Forecast, by Application 2020 & 2033
- Table 47: Israel GCC REIT Industry Revenue (Million) Forecast, by Application 2020 & 2033
- Table 48: GCC GCC REIT Industry Revenue (Million) Forecast, by Application 2020 & 2033
- Table 49: North Africa GCC REIT Industry Revenue (Million) Forecast, by Application 2020 & 2033
- Table 50: South Africa GCC REIT Industry Revenue (Million) Forecast, by Application 2020 & 2033
- Table 51: Rest of Middle East & Africa GCC REIT Industry Revenue (Million) Forecast, by Application 2020 & 2033
- Table 52: Global GCC REIT Industry Revenue Million Forecast, by Production Analysis 2020 & 2033
- Table 53: Global GCC REIT Industry Revenue Million Forecast, by Consumption Analysis 2020 & 2033
- Table 54: Global GCC REIT Industry Revenue Million Forecast, by Import Market Analysis (Value & Volume) 2020 & 2033
- Table 55: Global GCC REIT Industry Revenue Million Forecast, by Export Market Analysis (Value & Volume) 2020 & 2033
- Table 56: Global GCC REIT Industry Revenue Million Forecast, by Price Trend Analysis 2020 & 2033
- Table 57: Global GCC REIT Industry Revenue Million Forecast, by Country 2020 & 2033
- Table 58: China GCC REIT Industry Revenue (Million) Forecast, by Application 2020 & 2033
- Table 59: India GCC REIT Industry Revenue (Million) Forecast, by Application 2020 & 2033
- Table 60: Japan GCC REIT Industry Revenue (Million) Forecast, by Application 2020 & 2033
- Table 61: South Korea GCC REIT Industry Revenue (Million) Forecast, by Application 2020 & 2033
- Table 62: ASEAN GCC REIT Industry Revenue (Million) Forecast, by Application 2020 & 2033
- Table 63: Oceania GCC REIT Industry Revenue (Million) Forecast, by Application 2020 & 2033
- Table 64: Rest of Asia Pacific GCC REIT Industry Revenue (Million) Forecast, by Application 2020 & 2033
Frequently Asked Questions
1. What is the projected Compound Annual Growth Rate (CAGR) of the GCC REIT Industry?
The projected CAGR is approximately 8.24%.
2. Which companies are prominent players in the GCC REIT Industry?
Key companies in the market include Emaar Malls Group , Aldar Properties , Qatar Real Estate Investment Fund (QREIF) , Mabanee Company K.S.C.P., Saudi Real Estate Company (SAREC) , Mall of Oman , National Real Estate Company (NREC) .
3. What are the main segments of the GCC REIT Industry?
The market segments include Production Analysis, Consumption Analysis, Import Market Analysis (Value & Volume), Export Market Analysis (Value & Volume), Price Trend Analysis.
4. Can you provide details about the market size?
The market size is estimated to be USD 10.37 Million as of 2022.
5. What are some drivers contributing to market growth?
Fund Inflows is Driving the ETF Market.
6. What are the notable trends driving market growth?
Growing Asset Allocation to Real Estate by Large Investors in The Region.
7. Are there any restraints impacting market growth?
Underlying Fluctuations and Risks are Restraining the Market.
8. Can you provide examples of recent developments in the market?
In September 2022, Saudi Arabia introduced a real estate investment trust (REIT) regime. In November 2016, Riyad REIT was the first REIT to be listed in Saudi Arabia (and only the second REIT to be listed in the Middle East), which was followed by another 17 REITs up to July 2022, with a number of them also increasing their capital to acquire additional assets.
9. What pricing options are available for accessing the report?
Pricing options include single-user, multi-user, and enterprise licenses priced at USD 3800, USD 4500, and USD 5800 respectively.
10. Is the market size provided in terms of value or volume?
The market size is provided in terms of value, measured in Million.
11. Are there any specific market keywords associated with the report?
Yes, the market keyword associated with the report is "GCC REIT Industry," which aids in identifying and referencing the specific market segment covered.
12. How do I determine which pricing option suits my needs best?
The pricing options vary based on user requirements and access needs. Individual users may opt for single-user licenses, while businesses requiring broader access may choose multi-user or enterprise licenses for cost-effective access to the report.
13. Are there any additional resources or data provided in the GCC REIT Industry report?
While the report offers comprehensive insights, it's advisable to review the specific contents or supplementary materials provided to ascertain if additional resources or data are available.
14. How can I stay updated on further developments or reports in the GCC REIT Industry?
To stay informed about further developments, trends, and reports in the GCC REIT Industry, consider subscribing to industry newsletters, following relevant companies and organizations, or regularly checking reputable industry news sources and publications.
Methodology
Step 1 - Identification of Relevant Samples Size from Population Database


Step 2 - Approaches for Defining Global Market Size (Value, Volume* & Price*)

Note*: In applicable scenarios
Step 3 - Data Sources
Primary Research
- Web Analytics
- Survey Reports
- Research Institute
- Latest Research Reports
- Opinion Leaders
Secondary Research
- Annual Reports
- White Paper
- Latest Press Release
- Industry Association
- Paid Database
- Investor Presentations

Step 4 - Data Triangulation
Involves using different sources of information in order to increase the validity of a study
These sources are likely to be stakeholders in a program - participants, other researchers, program staff, other community members, and so on.
Then we put all data in single framework & apply various statistical tools to find out the dynamic on the market.
During the analysis stage, feedback from the stakeholder groups would be compared to determine areas of agreement as well as areas of divergence

