
Key Insights
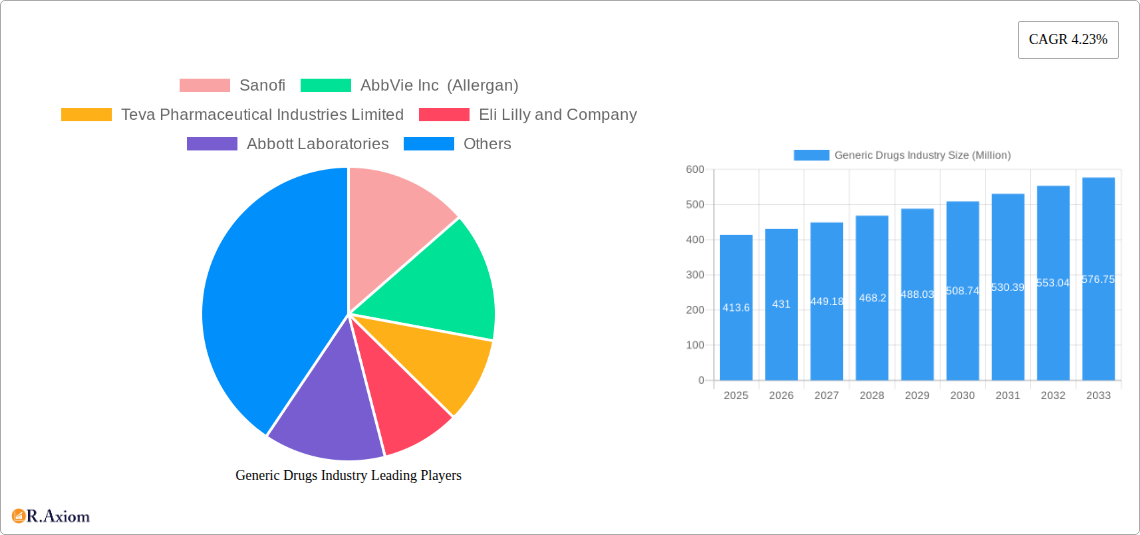
The global generic drugs market, valued at $413.60 million in 2025, is projected to experience robust growth, driven by several key factors. Increasing healthcare expenditure globally, coupled with a rising prevalence of chronic diseases like cardiovascular conditions and cancer, fuels demand for cost-effective treatment options. Generic drugs, offering bioequivalent alternatives to brand-name medications at significantly lower prices, are a crucial component in ensuring broader access to essential medicines. Furthermore, the expiration of patents on numerous blockbuster drugs is creating substantial opportunities for generic manufacturers to enter the market and capture significant market share. The market is segmented by route of administration (oral, topical, injectable, and others), application (cardiovascular, anti-infective, anti-arthritis, CNS, anti-cancer, respiratory, and others), and distribution channel (hospitals, retail pharmacies, and online/specialty pharmacies). Competition is fierce, with major players like Sanofi, AbbVie, Teva, and Pfizer vying for dominance. However, the market also faces challenges including stringent regulatory approvals, price erosion due to intense competition, and the need for robust quality control and supply chain management.
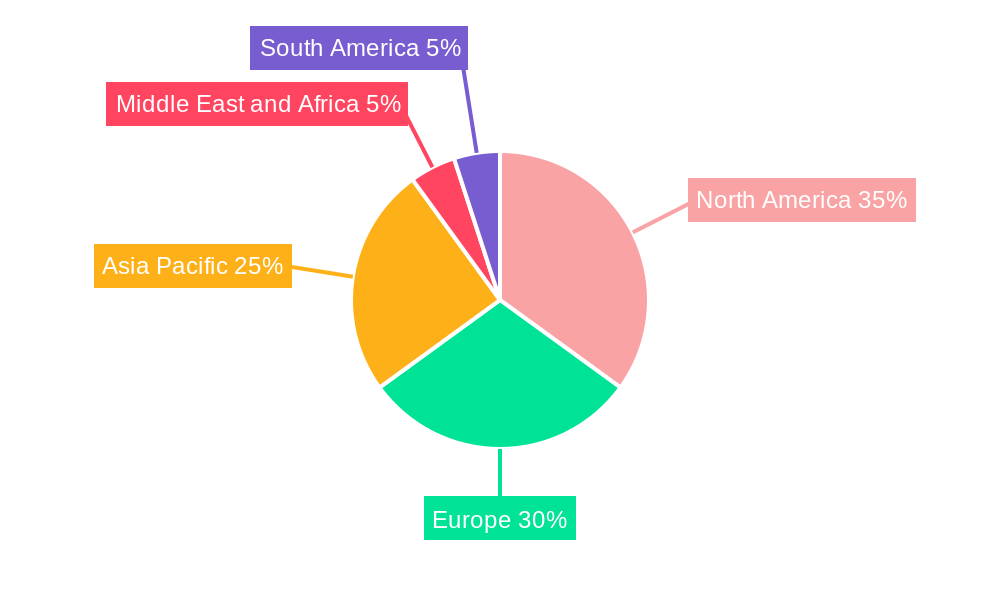
The geographical distribution of the market reflects global healthcare disparities. North America and Europe currently hold a significant share, driven by advanced healthcare infrastructure and high per capita healthcare spending. However, rapidly developing economies in Asia-Pacific, particularly India and China, are witnessing burgeoning growth in the generic drug market due to increasing affordability and rising healthcare awareness. The ongoing expansion of healthcare infrastructure in these regions, along with supportive government policies promoting access to affordable medicines, presents substantial growth opportunities. Looking ahead, the market's trajectory will likely be shaped by innovative delivery systems, the development of biosimilars (generic versions of biologics), and the increasing adoption of digital health technologies to enhance accessibility and distribution. This will necessitate strategic investments in research and development, efficient manufacturing processes, and strengthened regulatory compliance.
Generic Drugs Industry: A Comprehensive Market Report (2019-2033)
This comprehensive report provides a detailed analysis of the global generic drugs industry, covering market size, segmentation, growth drivers, challenges, and key players. With a study period spanning 2019-2033, a base year of 2025, and a forecast period of 2025-2033, this report offers valuable insights for industry stakeholders, investors, and researchers. The report incorporates data from the historical period (2019-2024) and leverages rigorous methodology to project future market trends. The estimated market size in 2025 is xx Million.
Generic Drugs Industry Market Concentration & Innovation
The generic drug market exhibits a moderately concentrated landscape, with several large multinational pharmaceutical companies holding significant market share. Top players such as Sanofi, AbbVie Inc (Allergan), Teva Pharmaceutical Industries Limited, and Pfizer Inc., command substantial portions of the global market. However, a considerable number of smaller, regional players also contribute to the overall market volume, creating a dynamic competitive environment.
Market concentration is influenced by factors such as economies of scale in manufacturing, access to capital for research and development, and successful navigation of regulatory hurdles. Furthermore, mergers and acquisitions (M&A) activity plays a significant role in shaping market structure, with recent M&A deal values averaging approximately xx Million. Innovation within the generic drug industry focuses primarily on improving manufacturing processes, reducing costs, and developing novel delivery systems to enhance bioavailability and patient compliance. Regulatory frameworks, such as those established by the FDA in the US and the EMA in Europe, heavily influence market access and drive innovation by setting standards for quality, safety, and efficacy. The availability of biosimilar drugs further enhances competition and drives innovation. End-user trends, including increased demand for cost-effective medications and a growing preference for convenient delivery methods, are also driving innovation in the sector.
- Key Players Market Share: Sanofi (xx%), AbbVie Inc (Allergan) (xx%), Teva Pharmaceutical Industries Limited (xx%), Pfizer Inc. (xx%) (These percentages are estimates).
- Recent M&A Activity: While specific recent M&A deal values are not publicly available, the average deal value for the last 3 years is estimated at xx Million.
Generic Drugs Industry Industry Trends & Insights
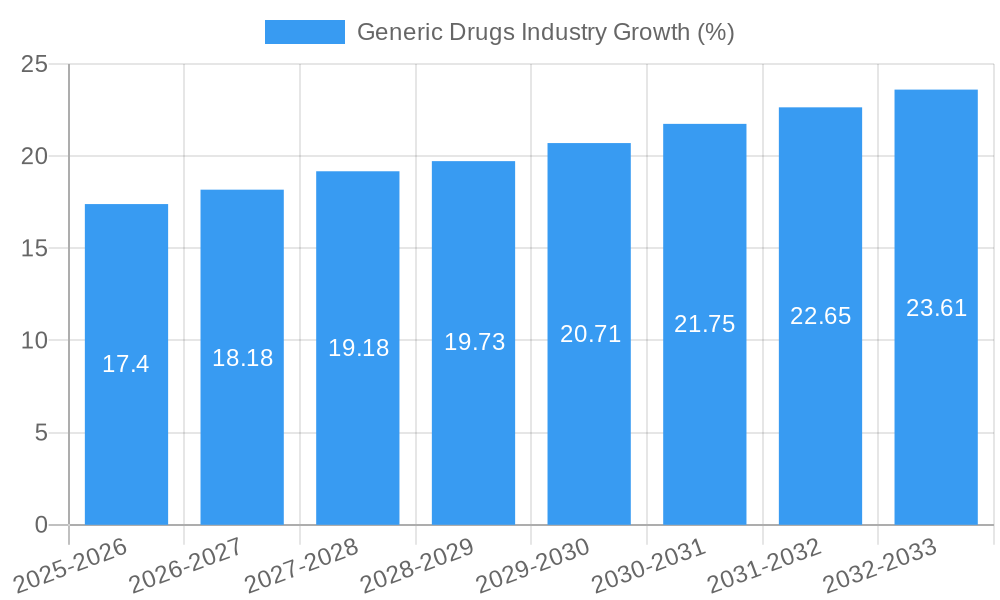
The generic drugs industry is experiencing robust growth, driven by factors such as increasing healthcare expenditure, rising prevalence of chronic diseases, and a global push for affordable healthcare solutions. The Compound Annual Growth Rate (CAGR) for the forecast period (2025-2033) is estimated to be xx%. Market penetration is steadily increasing, particularly in emerging economies, as healthcare systems prioritize cost-effective treatments. Technological disruptions, such as advancements in manufacturing processes and analytical techniques, are enhancing efficiency and reducing production costs. The rise of biosimilars is a significant trend, representing a growing segment of the generic drugs market. Consumer preferences are shifting towards convenient dosage forms and personalized medicine approaches, influencing product development. Competitive dynamics are fierce, characterized by price competition, product differentiation, and strategic partnerships. The continuous emergence of new generic drugs, driven by patent expirations of branded drugs, fuels the intense competition.
Dominant Markets & Segments in Generic Drugs Industry
The global generic drug market is geographically diverse, with significant variations in market size and growth rates across regions. While specific market dominance data isn't available, we can analyze the main segments:
By Route of Administration:
- Oral: The oral route remains the dominant segment due to ease of administration and cost-effectiveness. Key drivers include large patient populations requiring oral medication and well-established manufacturing processes.
- Topical: This segment is growing steadily driven by the increasing prevalence of skin conditions and the development of advanced topical formulations.
- Injectable: This segment shows slower growth compared to oral, due to the complexities associated with sterile manufacturing and administration.
- Other Routes of Administration (Sublingual, Rectal): These niche segments show promising growth potentials for specific therapeutic areas.
By Application:
- Cardiovascular Products: This is a large and mature segment with substantial market size, driven by the high prevalence of cardiovascular diseases globally.
- Anti-infective Drugs: This segment demonstrates significant growth owing to the continuous emergence of drug-resistant infections.
- Other Applications (Gastrointestinal, Hormonal Drug): These segments exhibit substantial growth potential due to the increasing prevalence of related health issues.
By Distribution Channel:
- Retail Pharmacies: This remains the dominant channel, owing to widespread accessibility and patient familiarity.
- Hospitals/Clinics: This segment shows consistent growth due to the increasing demand for cost-effective medicines in healthcare facilities.
- Other Distribution Channels (Online Pharmacy, Specialty Drug Stores): This segment is expanding rapidly, facilitated by technological advancements and changing consumer preferences.
Generic Drugs Industry Product Developments
Recent product innovations in the generic drug industry focus on improving drug delivery systems, such as developing extended-release formulations for enhanced patient compliance, and creating more bioavailable versions to enhance therapeutic effectiveness. The focus is also on leveraging technological advancements in manufacturing to reduce costs and improve quality, while addressing unmet medical needs through the development of novel generic alternatives. This focus on technological advancements ensures that the products are competitive in the market while effectively meeting the demands of the market.
Report Scope & Segmentation Analysis
This report comprehensively analyzes the generic drugs market across various segments:
By Route of Administration: Oral, Topical, Injectable, Other Routes of Administration (Sublingual, Rectal). Growth projections vary significantly across these segments; Oral is expected to maintain the largest market share, while other routes may show faster growth rates. Competitive dynamics are shaped by factors such as manufacturing complexity and ease of administration.
By Application: Cardiovascular Products, Anti-infective Drugs, Anti-arthritis Drugs, Central Nervous System Drugs, Anti-cancer Drugs, Respiratory Products, Other Applications (Gastrointestinal, Hormonal Drug). Market sizes vary drastically depending on disease prevalence and treatment requirements. The competitive landscape is influenced by the level of innovation and the number of available generic options.
By Distribution Channel: Hospitals/Clinics, Retail Pharmacies, Other Distribution Channels (Online Pharmacy, Specialty Drug Stores). Market sizes and growth projections differ across channels based on healthcare infrastructure and consumer behavior. Competitive pressures vary; online pharmacies and specialty drug stores face unique challenges regarding logistical aspects and consumer trust.
Key Drivers of Generic Drugs Industry Growth
The growth of the generic drug industry is primarily driven by several factors: increasing prevalence of chronic diseases globally leading to higher demand for affordable medications, stringent regulatory approvals driving the introduction of higher-quality generic drugs, and government initiatives promoting the adoption of cost-effective healthcare solutions, such as the implementation of generic substitution policies. Furthermore, continuous technological advancements in manufacturing and analytical techniques are significantly reducing production costs and improving efficiency.
Challenges in the Generic Drugs Industry Sector
The generic drug industry faces several challenges, including intense price competition, increasing regulatory scrutiny, and complex supply chain management. Price erosion is a major concern, often driven by intense competition among manufacturers. Regulatory hurdles, including stringent approval processes and variations in regulatory frameworks across countries, add to complexity. Ensuring a stable and reliable supply chain for raw materials and finished goods presents an ongoing challenge, particularly in the face of geopolitical instability and disruptions. These challenges often impact profitability and market competitiveness.
Emerging Opportunities in Generic Drugs Industry
Emerging opportunities exist in the generic drug industry through the development of complex generic drugs such as biosimilars, expanding into emerging markets with growing healthcare needs, and adopting advanced manufacturing technologies to enhance efficiency and reduce costs. There is also potential for growth in personalized medicine by developing tailored generic formulations to address specific patient needs. These trends are transforming the industry's dynamics and presenting attractive growth potentials.
Leading Players in the Generic Drugs Industry Market
- Sanofi
- AbbVie Inc (Allergan)
- Teva Pharmaceutical Industries Limited
- Eli Lilly and Company
- Abbott Laboratories
- STADA Arzneimittel AG
- Sun Pharmaceutical Industries Ltd
- Baxter International Inc
- GlaxoSmithKline PLC
- Pfizer Inc
- Mylan (Viatris Inc)
Key Developments in Generic Drugs Industry Industry
May 2024: Dr. Reddy's Laboratories launched Doxycycline Capsules (40 mg) in the US market, a generic alternative to Oracea capsules (40 mg). This launch intensifies competition in the antibiotic segment and potentially impacts market share of existing players.
January 2024: SinoT received Health Canada approval for its generic Posaconazole delayed-release tablets. This approval expands market access for this antifungal medication in Canada and could influence treatment choices for fungal infections.
Strategic Outlook for Generic Drugs Industry Market
The future of the generic drugs industry is characterized by strong growth potential, driven by continued demand for affordable healthcare solutions and the emergence of novel generic products. Strategic focus will be on enhancing manufacturing efficiency, developing complex generic drugs such as biosimilars, and expanding market reach in emerging economies. Companies adopting innovative strategies and effectively navigating regulatory landscapes will be best positioned to capitalize on this growth.
Generic Drugs Industry Segmentation
-
1. Route of Administration
- 1.1. Oral
- 1.2. Topical
- 1.3. Injectable
- 1.4. Other Ro
-
2. Application
- 2.1. Cardiovascular Products
- 2.2. Anti-infective Drugs
- 2.3. Anti-arthritis Drugs
- 2.4. Central Nervous System Drugs
- 2.5. Anti-cancer Drugs
- 2.6. Respiratory Products
- 2.7. Other Ap
-
3. Distribution Channel
- 3.1. Hospitals/Clinics
- 3.2. Retail Pharmacies
- 3.3. Other Di
Generic Drugs Industry Segmentation By Geography
-
1. North America
- 1.1. United States
- 1.2. Canada
- 1.3. Mexico
-
2. Europe
- 2.1. United Kingdom
- 2.2. Germany
- 2.3. France
- 2.4. Italy
- 2.5. Spain
- 2.6. Rest of Europe
-
3. Asia Pacific
- 3.1. China
- 3.2. Japan
- 3.3. India
- 3.4. Australia
- 3.5. South Korea
- 3.6. Rest of Asia Pacific
-
4. Middle East and Africa
- 4.1. GCC
- 4.2. South Africa
- 4.3. Rest of Middle East and Africa
-
5. South America
- 5.1. Brazil
- 5.2. Argentina
- 5.3. Rest of South America
Generic Drugs Industry REPORT HIGHLIGHTS
| Aspects | Details |
|---|---|
| Study Period | 2019-2033 |
| Base Year | 2024 |
| Estimated Year | 2025 |
| Forecast Period | 2025-2033 |
| Historical Period | 2019-2024 |
| Growth Rate | CAGR of 4.23% from 2019-2033 |
| Segmentation |
|
Table of Contents
- 1. Introduction
- 1.1. Research Scope
- 1.2. Market Segmentation
- 1.3. Research Methodology
- 1.4. Definitions and Assumptions
- 2. Executive Summary
- 2.1. Introduction
- 3. Market Dynamics
- 3.1. Introduction
- 3.2. Market Drivers
- 3.2.1. Increasing Prevalence of Chronic Diseases; Rise in Geriatric Population; Increase in Healthcare Expenditure
- 3.3. Market Restrains
- 3.3.1. Stringent Government Regulations; Adverse Effects Associated With the Drugs
- 3.4. Market Trends
- 3.4.1. Oral Segment is Expected to Hold Significant Share in the Market Over the Forecast Period
- 4. Market Factor Analysis
- 4.1. Porters Five Forces
- 4.2. Supply/Value Chain
- 4.3. PESTEL analysis
- 4.4. Market Entropy
- 4.5. Patent/Trademark Analysis
- 5. Global Generic Drugs Industry Analysis, Insights and Forecast, 2019-2031
- 5.1. Market Analysis, Insights and Forecast - by Route of Administration
- 5.1.1. Oral
- 5.1.2. Topical
- 5.1.3. Injectable
- 5.1.4. Other Ro
- 5.2. Market Analysis, Insights and Forecast - by Application
- 5.2.1. Cardiovascular Products
- 5.2.2. Anti-infective Drugs
- 5.2.3. Anti-arthritis Drugs
- 5.2.4. Central Nervous System Drugs
- 5.2.5. Anti-cancer Drugs
- 5.2.6. Respiratory Products
- 5.2.7. Other Ap
- 5.3. Market Analysis, Insights and Forecast - by Distribution Channel
- 5.3.1. Hospitals/Clinics
- 5.3.2. Retail Pharmacies
- 5.3.3. Other Di
- 5.4. Market Analysis, Insights and Forecast - by Region
- 5.4.1. North America
- 5.4.2. Europe
- 5.4.3. Asia Pacific
- 5.4.4. Middle East and Africa
- 5.4.5. South America
- 5.1. Market Analysis, Insights and Forecast - by Route of Administration
- 6. North America Generic Drugs Industry Analysis, Insights and Forecast, 2019-2031
- 6.1. Market Analysis, Insights and Forecast - by Route of Administration
- 6.1.1. Oral
- 6.1.2. Topical
- 6.1.3. Injectable
- 6.1.4. Other Ro
- 6.2. Market Analysis, Insights and Forecast - by Application
- 6.2.1. Cardiovascular Products
- 6.2.2. Anti-infective Drugs
- 6.2.3. Anti-arthritis Drugs
- 6.2.4. Central Nervous System Drugs
- 6.2.5. Anti-cancer Drugs
- 6.2.6. Respiratory Products
- 6.2.7. Other Ap
- 6.3. Market Analysis, Insights and Forecast - by Distribution Channel
- 6.3.1. Hospitals/Clinics
- 6.3.2. Retail Pharmacies
- 6.3.3. Other Di
- 6.1. Market Analysis, Insights and Forecast - by Route of Administration
- 7. Europe Generic Drugs Industry Analysis, Insights and Forecast, 2019-2031
- 7.1. Market Analysis, Insights and Forecast - by Route of Administration
- 7.1.1. Oral
- 7.1.2. Topical
- 7.1.3. Injectable
- 7.1.4. Other Ro
- 7.2. Market Analysis, Insights and Forecast - by Application
- 7.2.1. Cardiovascular Products
- 7.2.2. Anti-infective Drugs
- 7.2.3. Anti-arthritis Drugs
- 7.2.4. Central Nervous System Drugs
- 7.2.5. Anti-cancer Drugs
- 7.2.6. Respiratory Products
- 7.2.7. Other Ap
- 7.3. Market Analysis, Insights and Forecast - by Distribution Channel
- 7.3.1. Hospitals/Clinics
- 7.3.2. Retail Pharmacies
- 7.3.3. Other Di
- 7.1. Market Analysis, Insights and Forecast - by Route of Administration
- 8. Asia Pacific Generic Drugs Industry Analysis, Insights and Forecast, 2019-2031
- 8.1. Market Analysis, Insights and Forecast - by Route of Administration
- 8.1.1. Oral
- 8.1.2. Topical
- 8.1.3. Injectable
- 8.1.4. Other Ro
- 8.2. Market Analysis, Insights and Forecast - by Application
- 8.2.1. Cardiovascular Products
- 8.2.2. Anti-infective Drugs
- 8.2.3. Anti-arthritis Drugs
- 8.2.4. Central Nervous System Drugs
- 8.2.5. Anti-cancer Drugs
- 8.2.6. Respiratory Products
- 8.2.7. Other Ap
- 8.3. Market Analysis, Insights and Forecast - by Distribution Channel
- 8.3.1. Hospitals/Clinics
- 8.3.2. Retail Pharmacies
- 8.3.3. Other Di
- 8.1. Market Analysis, Insights and Forecast - by Route of Administration
- 9. Middle East and Africa Generic Drugs Industry Analysis, Insights and Forecast, 2019-2031
- 9.1. Market Analysis, Insights and Forecast - by Route of Administration
- 9.1.1. Oral
- 9.1.2. Topical
- 9.1.3. Injectable
- 9.1.4. Other Ro
- 9.2. Market Analysis, Insights and Forecast - by Application
- 9.2.1. Cardiovascular Products
- 9.2.2. Anti-infective Drugs
- 9.2.3. Anti-arthritis Drugs
- 9.2.4. Central Nervous System Drugs
- 9.2.5. Anti-cancer Drugs
- 9.2.6. Respiratory Products
- 9.2.7. Other Ap
- 9.3. Market Analysis, Insights and Forecast - by Distribution Channel
- 9.3.1. Hospitals/Clinics
- 9.3.2. Retail Pharmacies
- 9.3.3. Other Di
- 9.1. Market Analysis, Insights and Forecast - by Route of Administration
- 10. South America Generic Drugs Industry Analysis, Insights and Forecast, 2019-2031
- 10.1. Market Analysis, Insights and Forecast - by Route of Administration
- 10.1.1. Oral
- 10.1.2. Topical
- 10.1.3. Injectable
- 10.1.4. Other Ro
- 10.2. Market Analysis, Insights and Forecast - by Application
- 10.2.1. Cardiovascular Products
- 10.2.2. Anti-infective Drugs
- 10.2.3. Anti-arthritis Drugs
- 10.2.4. Central Nervous System Drugs
- 10.2.5. Anti-cancer Drugs
- 10.2.6. Respiratory Products
- 10.2.7. Other Ap
- 10.3. Market Analysis, Insights and Forecast - by Distribution Channel
- 10.3.1. Hospitals/Clinics
- 10.3.2. Retail Pharmacies
- 10.3.3. Other Di
- 10.1. Market Analysis, Insights and Forecast - by Route of Administration
- 11. North America Generic Drugs Industry Analysis, Insights and Forecast, 2019-2031
- 11.1. Market Analysis, Insights and Forecast - By Country/Sub-region
- 11.1.1 United States
- 11.1.2 Canada
- 11.1.3 Mexico
- 12. Europe Generic Drugs Industry Analysis, Insights and Forecast, 2019-2031
- 12.1. Market Analysis, Insights and Forecast - By Country/Sub-region
- 12.1.1 United Kingdom
- 12.1.2 Germany
- 12.1.3 France
- 12.1.4 Italy
- 12.1.5 Spain
- 12.1.6 Rest of Europe
- 13. Asia Pacific Generic Drugs Industry Analysis, Insights and Forecast, 2019-2031
- 13.1. Market Analysis, Insights and Forecast - By Country/Sub-region
- 13.1.1 China
- 13.1.2 Japan
- 13.1.3 India
- 13.1.4 Australia
- 13.1.5 South Korea
- 13.1.6 Rest of Asia Pacific
- 14. Middle East and Africa Generic Drugs Industry Analysis, Insights and Forecast, 2019-2031
- 14.1. Market Analysis, Insights and Forecast - By Country/Sub-region
- 14.1.1 GCC
- 14.1.2 South Africa
- 14.1.3 Rest of Middle East and Africa
- 15. South America Generic Drugs Industry Analysis, Insights and Forecast, 2019-2031
- 15.1. Market Analysis, Insights and Forecast - By Country/Sub-region
- 15.1.1 Brazil
- 15.1.2 Argentina
- 15.1.3 Rest of South America
- 16. Competitive Analysis
- 16.1. Global Market Share Analysis 2024
- 16.2. Company Profiles
- 16.2.1 Sanofi
- 16.2.1.1. Overview
- 16.2.1.2. Products
- 16.2.1.3. SWOT Analysis
- 16.2.1.4. Recent Developments
- 16.2.1.5. Financials (Based on Availability)
- 16.2.2 AbbVie Inc (Allergan)
- 16.2.2.1. Overview
- 16.2.2.2. Products
- 16.2.2.3. SWOT Analysis
- 16.2.2.4. Recent Developments
- 16.2.2.5. Financials (Based on Availability)
- 16.2.3 Teva Pharmaceutical Industries Limited
- 16.2.3.1. Overview
- 16.2.3.2. Products
- 16.2.3.3. SWOT Analysis
- 16.2.3.4. Recent Developments
- 16.2.3.5. Financials (Based on Availability)
- 16.2.4 Eli Lilly and Company
- 16.2.4.1. Overview
- 16.2.4.2. Products
- 16.2.4.3. SWOT Analysis
- 16.2.4.4. Recent Developments
- 16.2.4.5. Financials (Based on Availability)
- 16.2.5 Abbott Laboratories
- 16.2.5.1. Overview
- 16.2.5.2. Products
- 16.2.5.3. SWOT Analysis
- 16.2.5.4. Recent Developments
- 16.2.5.5. Financials (Based on Availability)
- 16.2.6 STADA Arzneimittel AG
- 16.2.6.1. Overview
- 16.2.6.2. Products
- 16.2.6.3. SWOT Analysis
- 16.2.6.4. Recent Developments
- 16.2.6.5. Financials (Based on Availability)
- 16.2.7 Sun Pharmaceutical Industries Ltd
- 16.2.7.1. Overview
- 16.2.7.2. Products
- 16.2.7.3. SWOT Analysis
- 16.2.7.4. Recent Developments
- 16.2.7.5. Financials (Based on Availability)
- 16.2.8 Baxter International Inc
- 16.2.8.1. Overview
- 16.2.8.2. Products
- 16.2.8.3. SWOT Analysis
- 16.2.8.4. Recent Developments
- 16.2.8.5. Financials (Based on Availability)
- 16.2.9 GlaxoSmithKline PLC
- 16.2.9.1. Overview
- 16.2.9.2. Products
- 16.2.9.3. SWOT Analysis
- 16.2.9.4. Recent Developments
- 16.2.9.5. Financials (Based on Availability)
- 16.2.10 Pfizer Inc
- 16.2.10.1. Overview
- 16.2.10.2. Products
- 16.2.10.3. SWOT Analysis
- 16.2.10.4. Recent Developments
- 16.2.10.5. Financials (Based on Availability)
- 16.2.11 Mylan (Viatris Inc )
- 16.2.11.1. Overview
- 16.2.11.2. Products
- 16.2.11.3. SWOT Analysis
- 16.2.11.4. Recent Developments
- 16.2.11.5. Financials (Based on Availability)
- 16.2.1 Sanofi
List of Figures
- Figure 1: Global Generic Drugs Industry Revenue Breakdown (Million, %) by Region 2024 & 2032
- Figure 2: Global Generic Drugs Industry Volume Breakdown (K Unit, %) by Region 2024 & 2032
- Figure 3: North America Generic Drugs Industry Revenue (Million), by Country 2024 & 2032
- Figure 4: North America Generic Drugs Industry Volume (K Unit), by Country 2024 & 2032
- Figure 5: North America Generic Drugs Industry Revenue Share (%), by Country 2024 & 2032
- Figure 6: North America Generic Drugs Industry Volume Share (%), by Country 2024 & 2032
- Figure 7: Europe Generic Drugs Industry Revenue (Million), by Country 2024 & 2032
- Figure 8: Europe Generic Drugs Industry Volume (K Unit), by Country 2024 & 2032
- Figure 9: Europe Generic Drugs Industry Revenue Share (%), by Country 2024 & 2032
- Figure 10: Europe Generic Drugs Industry Volume Share (%), by Country 2024 & 2032
- Figure 11: Asia Pacific Generic Drugs Industry Revenue (Million), by Country 2024 & 2032
- Figure 12: Asia Pacific Generic Drugs Industry Volume (K Unit), by Country 2024 & 2032
- Figure 13: Asia Pacific Generic Drugs Industry Revenue Share (%), by Country 2024 & 2032
- Figure 14: Asia Pacific Generic Drugs Industry Volume Share (%), by Country 2024 & 2032
- Figure 15: Middle East and Africa Generic Drugs Industry Revenue (Million), by Country 2024 & 2032
- Figure 16: Middle East and Africa Generic Drugs Industry Volume (K Unit), by Country 2024 & 2032
- Figure 17: Middle East and Africa Generic Drugs Industry Revenue Share (%), by Country 2024 & 2032
- Figure 18: Middle East and Africa Generic Drugs Industry Volume Share (%), by Country 2024 & 2032
- Figure 19: South America Generic Drugs Industry Revenue (Million), by Country 2024 & 2032
- Figure 20: South America Generic Drugs Industry Volume (K Unit), by Country 2024 & 2032
- Figure 21: South America Generic Drugs Industry Revenue Share (%), by Country 2024 & 2032
- Figure 22: South America Generic Drugs Industry Volume Share (%), by Country 2024 & 2032
- Figure 23: North America Generic Drugs Industry Revenue (Million), by Route of Administration 2024 & 2032
- Figure 24: North America Generic Drugs Industry Volume (K Unit), by Route of Administration 2024 & 2032
- Figure 25: North America Generic Drugs Industry Revenue Share (%), by Route of Administration 2024 & 2032
- Figure 26: North America Generic Drugs Industry Volume Share (%), by Route of Administration 2024 & 2032
- Figure 27: North America Generic Drugs Industry Revenue (Million), by Application 2024 & 2032
- Figure 28: North America Generic Drugs Industry Volume (K Unit), by Application 2024 & 2032
- Figure 29: North America Generic Drugs Industry Revenue Share (%), by Application 2024 & 2032
- Figure 30: North America Generic Drugs Industry Volume Share (%), by Application 2024 & 2032
- Figure 31: North America Generic Drugs Industry Revenue (Million), by Distribution Channel 2024 & 2032
- Figure 32: North America Generic Drugs Industry Volume (K Unit), by Distribution Channel 2024 & 2032
- Figure 33: North America Generic Drugs Industry Revenue Share (%), by Distribution Channel 2024 & 2032
- Figure 34: North America Generic Drugs Industry Volume Share (%), by Distribution Channel 2024 & 2032
- Figure 35: North America Generic Drugs Industry Revenue (Million), by Country 2024 & 2032
- Figure 36: North America Generic Drugs Industry Volume (K Unit), by Country 2024 & 2032
- Figure 37: North America Generic Drugs Industry Revenue Share (%), by Country 2024 & 2032
- Figure 38: North America Generic Drugs Industry Volume Share (%), by Country 2024 & 2032
- Figure 39: Europe Generic Drugs Industry Revenue (Million), by Route of Administration 2024 & 2032
- Figure 40: Europe Generic Drugs Industry Volume (K Unit), by Route of Administration 2024 & 2032
- Figure 41: Europe Generic Drugs Industry Revenue Share (%), by Route of Administration 2024 & 2032
- Figure 42: Europe Generic Drugs Industry Volume Share (%), by Route of Administration 2024 & 2032
- Figure 43: Europe Generic Drugs Industry Revenue (Million), by Application 2024 & 2032
- Figure 44: Europe Generic Drugs Industry Volume (K Unit), by Application 2024 & 2032
- Figure 45: Europe Generic Drugs Industry Revenue Share (%), by Application 2024 & 2032
- Figure 46: Europe Generic Drugs Industry Volume Share (%), by Application 2024 & 2032
- Figure 47: Europe Generic Drugs Industry Revenue (Million), by Distribution Channel 2024 & 2032
- Figure 48: Europe Generic Drugs Industry Volume (K Unit), by Distribution Channel 2024 & 2032
- Figure 49: Europe Generic Drugs Industry Revenue Share (%), by Distribution Channel 2024 & 2032
- Figure 50: Europe Generic Drugs Industry Volume Share (%), by Distribution Channel 2024 & 2032
- Figure 51: Europe Generic Drugs Industry Revenue (Million), by Country 2024 & 2032
- Figure 52: Europe Generic Drugs Industry Volume (K Unit), by Country 2024 & 2032
- Figure 53: Europe Generic Drugs Industry Revenue Share (%), by Country 2024 & 2032
- Figure 54: Europe Generic Drugs Industry Volume Share (%), by Country 2024 & 2032
- Figure 55: Asia Pacific Generic Drugs Industry Revenue (Million), by Route of Administration 2024 & 2032
- Figure 56: Asia Pacific Generic Drugs Industry Volume (K Unit), by Route of Administration 2024 & 2032
- Figure 57: Asia Pacific Generic Drugs Industry Revenue Share (%), by Route of Administration 2024 & 2032
- Figure 58: Asia Pacific Generic Drugs Industry Volume Share (%), by Route of Administration 2024 & 2032
- Figure 59: Asia Pacific Generic Drugs Industry Revenue (Million), by Application 2024 & 2032
- Figure 60: Asia Pacific Generic Drugs Industry Volume (K Unit), by Application 2024 & 2032
- Figure 61: Asia Pacific Generic Drugs Industry Revenue Share (%), by Application 2024 & 2032
- Figure 62: Asia Pacific Generic Drugs Industry Volume Share (%), by Application 2024 & 2032
- Figure 63: Asia Pacific Generic Drugs Industry Revenue (Million), by Distribution Channel 2024 & 2032
- Figure 64: Asia Pacific Generic Drugs Industry Volume (K Unit), by Distribution Channel 2024 & 2032
- Figure 65: Asia Pacific Generic Drugs Industry Revenue Share (%), by Distribution Channel 2024 & 2032
- Figure 66: Asia Pacific Generic Drugs Industry Volume Share (%), by Distribution Channel 2024 & 2032
- Figure 67: Asia Pacific Generic Drugs Industry Revenue (Million), by Country 2024 & 2032
- Figure 68: Asia Pacific Generic Drugs Industry Volume (K Unit), by Country 2024 & 2032
- Figure 69: Asia Pacific Generic Drugs Industry Revenue Share (%), by Country 2024 & 2032
- Figure 70: Asia Pacific Generic Drugs Industry Volume Share (%), by Country 2024 & 2032
- Figure 71: Middle East and Africa Generic Drugs Industry Revenue (Million), by Route of Administration 2024 & 2032
- Figure 72: Middle East and Africa Generic Drugs Industry Volume (K Unit), by Route of Administration 2024 & 2032
- Figure 73: Middle East and Africa Generic Drugs Industry Revenue Share (%), by Route of Administration 2024 & 2032
- Figure 74: Middle East and Africa Generic Drugs Industry Volume Share (%), by Route of Administration 2024 & 2032
- Figure 75: Middle East and Africa Generic Drugs Industry Revenue (Million), by Application 2024 & 2032
- Figure 76: Middle East and Africa Generic Drugs Industry Volume (K Unit), by Application 2024 & 2032
- Figure 77: Middle East and Africa Generic Drugs Industry Revenue Share (%), by Application 2024 & 2032
- Figure 78: Middle East and Africa Generic Drugs Industry Volume Share (%), by Application 2024 & 2032
- Figure 79: Middle East and Africa Generic Drugs Industry Revenue (Million), by Distribution Channel 2024 & 2032
- Figure 80: Middle East and Africa Generic Drugs Industry Volume (K Unit), by Distribution Channel 2024 & 2032
- Figure 81: Middle East and Africa Generic Drugs Industry Revenue Share (%), by Distribution Channel 2024 & 2032
- Figure 82: Middle East and Africa Generic Drugs Industry Volume Share (%), by Distribution Channel 2024 & 2032
- Figure 83: Middle East and Africa Generic Drugs Industry Revenue (Million), by Country 2024 & 2032
- Figure 84: Middle East and Africa Generic Drugs Industry Volume (K Unit), by Country 2024 & 2032
- Figure 85: Middle East and Africa Generic Drugs Industry Revenue Share (%), by Country 2024 & 2032
- Figure 86: Middle East and Africa Generic Drugs Industry Volume Share (%), by Country 2024 & 2032
- Figure 87: South America Generic Drugs Industry Revenue (Million), by Route of Administration 2024 & 2032
- Figure 88: South America Generic Drugs Industry Volume (K Unit), by Route of Administration 2024 & 2032
- Figure 89: South America Generic Drugs Industry Revenue Share (%), by Route of Administration 2024 & 2032
- Figure 90: South America Generic Drugs Industry Volume Share (%), by Route of Administration 2024 & 2032
- Figure 91: South America Generic Drugs Industry Revenue (Million), by Application 2024 & 2032
- Figure 92: South America Generic Drugs Industry Volume (K Unit), by Application 2024 & 2032
- Figure 93: South America Generic Drugs Industry Revenue Share (%), by Application 2024 & 2032
- Figure 94: South America Generic Drugs Industry Volume Share (%), by Application 2024 & 2032
- Figure 95: South America Generic Drugs Industry Revenue (Million), by Distribution Channel 2024 & 2032
- Figure 96: South America Generic Drugs Industry Volume (K Unit), by Distribution Channel 2024 & 2032
- Figure 97: South America Generic Drugs Industry Revenue Share (%), by Distribution Channel 2024 & 2032
- Figure 98: South America Generic Drugs Industry Volume Share (%), by Distribution Channel 2024 & 2032
- Figure 99: South America Generic Drugs Industry Revenue (Million), by Country 2024 & 2032
- Figure 100: South America Generic Drugs Industry Volume (K Unit), by Country 2024 & 2032
- Figure 101: South America Generic Drugs Industry Revenue Share (%), by Country 2024 & 2032
- Figure 102: South America Generic Drugs Industry Volume Share (%), by Country 2024 & 2032
List of Tables
- Table 1: Global Generic Drugs Industry Revenue Million Forecast, by Region 2019 & 2032
- Table 2: Global Generic Drugs Industry Volume K Unit Forecast, by Region 2019 & 2032
- Table 3: Global Generic Drugs Industry Revenue Million Forecast, by Route of Administration 2019 & 2032
- Table 4: Global Generic Drugs Industry Volume K Unit Forecast, by Route of Administration 2019 & 2032
- Table 5: Global Generic Drugs Industry Revenue Million Forecast, by Application 2019 & 2032
- Table 6: Global Generic Drugs Industry Volume K Unit Forecast, by Application 2019 & 2032
- Table 7: Global Generic Drugs Industry Revenue Million Forecast, by Distribution Channel 2019 & 2032
- Table 8: Global Generic Drugs Industry Volume K Unit Forecast, by Distribution Channel 2019 & 2032
- Table 9: Global Generic Drugs Industry Revenue Million Forecast, by Region 2019 & 2032
- Table 10: Global Generic Drugs Industry Volume K Unit Forecast, by Region 2019 & 2032
- Table 11: Global Generic Drugs Industry Revenue Million Forecast, by Country 2019 & 2032
- Table 12: Global Generic Drugs Industry Volume K Unit Forecast, by Country 2019 & 2032
- Table 13: United States Generic Drugs Industry Revenue (Million) Forecast, by Application 2019 & 2032
- Table 14: United States Generic Drugs Industry Volume (K Unit) Forecast, by Application 2019 & 2032
- Table 15: Canada Generic Drugs Industry Revenue (Million) Forecast, by Application 2019 & 2032
- Table 16: Canada Generic Drugs Industry Volume (K Unit) Forecast, by Application 2019 & 2032
- Table 17: Mexico Generic Drugs Industry Revenue (Million) Forecast, by Application 2019 & 2032
- Table 18: Mexico Generic Drugs Industry Volume (K Unit) Forecast, by Application 2019 & 2032
- Table 19: Global Generic Drugs Industry Revenue Million Forecast, by Country 2019 & 2032
- Table 20: Global Generic Drugs Industry Volume K Unit Forecast, by Country 2019 & 2032
- Table 21: United Kingdom Generic Drugs Industry Revenue (Million) Forecast, by Application 2019 & 2032
- Table 22: United Kingdom Generic Drugs Industry Volume (K Unit) Forecast, by Application 2019 & 2032
- Table 23: Germany Generic Drugs Industry Revenue (Million) Forecast, by Application 2019 & 2032
- Table 24: Germany Generic Drugs Industry Volume (K Unit) Forecast, by Application 2019 & 2032
- Table 25: France Generic Drugs Industry Revenue (Million) Forecast, by Application 2019 & 2032
- Table 26: France Generic Drugs Industry Volume (K Unit) Forecast, by Application 2019 & 2032
- Table 27: Italy Generic Drugs Industry Revenue (Million) Forecast, by Application 2019 & 2032
- Table 28: Italy Generic Drugs Industry Volume (K Unit) Forecast, by Application 2019 & 2032
- Table 29: Spain Generic Drugs Industry Revenue (Million) Forecast, by Application 2019 & 2032
- Table 30: Spain Generic Drugs Industry Volume (K Unit) Forecast, by Application 2019 & 2032
- Table 31: Rest of Europe Generic Drugs Industry Revenue (Million) Forecast, by Application 2019 & 2032
- Table 32: Rest of Europe Generic Drugs Industry Volume (K Unit) Forecast, by Application 2019 & 2032
- Table 33: Global Generic Drugs Industry Revenue Million Forecast, by Country 2019 & 2032
- Table 34: Global Generic Drugs Industry Volume K Unit Forecast, by Country 2019 & 2032
- Table 35: China Generic Drugs Industry Revenue (Million) Forecast, by Application 2019 & 2032
- Table 36: China Generic Drugs Industry Volume (K Unit) Forecast, by Application 2019 & 2032
- Table 37: Japan Generic Drugs Industry Revenue (Million) Forecast, by Application 2019 & 2032
- Table 38: Japan Generic Drugs Industry Volume (K Unit) Forecast, by Application 2019 & 2032
- Table 39: India Generic Drugs Industry Revenue (Million) Forecast, by Application 2019 & 2032
- Table 40: India Generic Drugs Industry Volume (K Unit) Forecast, by Application 2019 & 2032
- Table 41: Australia Generic Drugs Industry Revenue (Million) Forecast, by Application 2019 & 2032
- Table 42: Australia Generic Drugs Industry Volume (K Unit) Forecast, by Application 2019 & 2032
- Table 43: South Korea Generic Drugs Industry Revenue (Million) Forecast, by Application 2019 & 2032
- Table 44: South Korea Generic Drugs Industry Volume (K Unit) Forecast, by Application 2019 & 2032
- Table 45: Rest of Asia Pacific Generic Drugs Industry Revenue (Million) Forecast, by Application 2019 & 2032
- Table 46: Rest of Asia Pacific Generic Drugs Industry Volume (K Unit) Forecast, by Application 2019 & 2032
- Table 47: Global Generic Drugs Industry Revenue Million Forecast, by Country 2019 & 2032
- Table 48: Global Generic Drugs Industry Volume K Unit Forecast, by Country 2019 & 2032
- Table 49: GCC Generic Drugs Industry Revenue (Million) Forecast, by Application 2019 & 2032
- Table 50: GCC Generic Drugs Industry Volume (K Unit) Forecast, by Application 2019 & 2032
- Table 51: South Africa Generic Drugs Industry Revenue (Million) Forecast, by Application 2019 & 2032
- Table 52: South Africa Generic Drugs Industry Volume (K Unit) Forecast, by Application 2019 & 2032
- Table 53: Rest of Middle East and Africa Generic Drugs Industry Revenue (Million) Forecast, by Application 2019 & 2032
- Table 54: Rest of Middle East and Africa Generic Drugs Industry Volume (K Unit) Forecast, by Application 2019 & 2032
- Table 55: Global Generic Drugs Industry Revenue Million Forecast, by Country 2019 & 2032
- Table 56: Global Generic Drugs Industry Volume K Unit Forecast, by Country 2019 & 2032
- Table 57: Brazil Generic Drugs Industry Revenue (Million) Forecast, by Application 2019 & 2032
- Table 58: Brazil Generic Drugs Industry Volume (K Unit) Forecast, by Application 2019 & 2032
- Table 59: Argentina Generic Drugs Industry Revenue (Million) Forecast, by Application 2019 & 2032
- Table 60: Argentina Generic Drugs Industry Volume (K Unit) Forecast, by Application 2019 & 2032
- Table 61: Rest of South America Generic Drugs Industry Revenue (Million) Forecast, by Application 2019 & 2032
- Table 62: Rest of South America Generic Drugs Industry Volume (K Unit) Forecast, by Application 2019 & 2032
- Table 63: Global Generic Drugs Industry Revenue Million Forecast, by Route of Administration 2019 & 2032
- Table 64: Global Generic Drugs Industry Volume K Unit Forecast, by Route of Administration 2019 & 2032
- Table 65: Global Generic Drugs Industry Revenue Million Forecast, by Application 2019 & 2032
- Table 66: Global Generic Drugs Industry Volume K Unit Forecast, by Application 2019 & 2032
- Table 67: Global Generic Drugs Industry Revenue Million Forecast, by Distribution Channel 2019 & 2032
- Table 68: Global Generic Drugs Industry Volume K Unit Forecast, by Distribution Channel 2019 & 2032
- Table 69: Global Generic Drugs Industry Revenue Million Forecast, by Country 2019 & 2032
- Table 70: Global Generic Drugs Industry Volume K Unit Forecast, by Country 2019 & 2032
- Table 71: United States Generic Drugs Industry Revenue (Million) Forecast, by Application 2019 & 2032
- Table 72: United States Generic Drugs Industry Volume (K Unit) Forecast, by Application 2019 & 2032
- Table 73: Canada Generic Drugs Industry Revenue (Million) Forecast, by Application 2019 & 2032
- Table 74: Canada Generic Drugs Industry Volume (K Unit) Forecast, by Application 2019 & 2032
- Table 75: Mexico Generic Drugs Industry Revenue (Million) Forecast, by Application 2019 & 2032
- Table 76: Mexico Generic Drugs Industry Volume (K Unit) Forecast, by Application 2019 & 2032
- Table 77: Global Generic Drugs Industry Revenue Million Forecast, by Route of Administration 2019 & 2032
- Table 78: Global Generic Drugs Industry Volume K Unit Forecast, by Route of Administration 2019 & 2032
- Table 79: Global Generic Drugs Industry Revenue Million Forecast, by Application 2019 & 2032
- Table 80: Global Generic Drugs Industry Volume K Unit Forecast, by Application 2019 & 2032
- Table 81: Global Generic Drugs Industry Revenue Million Forecast, by Distribution Channel 2019 & 2032
- Table 82: Global Generic Drugs Industry Volume K Unit Forecast, by Distribution Channel 2019 & 2032
- Table 83: Global Generic Drugs Industry Revenue Million Forecast, by Country 2019 & 2032
- Table 84: Global Generic Drugs Industry Volume K Unit Forecast, by Country 2019 & 2032
- Table 85: United Kingdom Generic Drugs Industry Revenue (Million) Forecast, by Application 2019 & 2032
- Table 86: United Kingdom Generic Drugs Industry Volume (K Unit) Forecast, by Application 2019 & 2032
- Table 87: Germany Generic Drugs Industry Revenue (Million) Forecast, by Application 2019 & 2032
- Table 88: Germany Generic Drugs Industry Volume (K Unit) Forecast, by Application 2019 & 2032
- Table 89: France Generic Drugs Industry Revenue (Million) Forecast, by Application 2019 & 2032
- Table 90: France Generic Drugs Industry Volume (K Unit) Forecast, by Application 2019 & 2032
- Table 91: Italy Generic Drugs Industry Revenue (Million) Forecast, by Application 2019 & 2032
- Table 92: Italy Generic Drugs Industry Volume (K Unit) Forecast, by Application 2019 & 2032
- Table 93: Spain Generic Drugs Industry Revenue (Million) Forecast, by Application 2019 & 2032
- Table 94: Spain Generic Drugs Industry Volume (K Unit) Forecast, by Application 2019 & 2032
- Table 95: Rest of Europe Generic Drugs Industry Revenue (Million) Forecast, by Application 2019 & 2032
- Table 96: Rest of Europe Generic Drugs Industry Volume (K Unit) Forecast, by Application 2019 & 2032
- Table 97: Global Generic Drugs Industry Revenue Million Forecast, by Route of Administration 2019 & 2032
- Table 98: Global Generic Drugs Industry Volume K Unit Forecast, by Route of Administration 2019 & 2032
- Table 99: Global Generic Drugs Industry Revenue Million Forecast, by Application 2019 & 2032
- Table 100: Global Generic Drugs Industry Volume K Unit Forecast, by Application 2019 & 2032
- Table 101: Global Generic Drugs Industry Revenue Million Forecast, by Distribution Channel 2019 & 2032
- Table 102: Global Generic Drugs Industry Volume K Unit Forecast, by Distribution Channel 2019 & 2032
- Table 103: Global Generic Drugs Industry Revenue Million Forecast, by Country 2019 & 2032
- Table 104: Global Generic Drugs Industry Volume K Unit Forecast, by Country 2019 & 2032
- Table 105: China Generic Drugs Industry Revenue (Million) Forecast, by Application 2019 & 2032
- Table 106: China Generic Drugs Industry Volume (K Unit) Forecast, by Application 2019 & 2032
- Table 107: Japan Generic Drugs Industry Revenue (Million) Forecast, by Application 2019 & 2032
- Table 108: Japan Generic Drugs Industry Volume (K Unit) Forecast, by Application 2019 & 2032
- Table 109: India Generic Drugs Industry Revenue (Million) Forecast, by Application 2019 & 2032
- Table 110: India Generic Drugs Industry Volume (K Unit) Forecast, by Application 2019 & 2032
- Table 111: Australia Generic Drugs Industry Revenue (Million) Forecast, by Application 2019 & 2032
- Table 112: Australia Generic Drugs Industry Volume (K Unit) Forecast, by Application 2019 & 2032
- Table 113: South Korea Generic Drugs Industry Revenue (Million) Forecast, by Application 2019 & 2032
- Table 114: South Korea Generic Drugs Industry Volume (K Unit) Forecast, by Application 2019 & 2032
- Table 115: Rest of Asia Pacific Generic Drugs Industry Revenue (Million) Forecast, by Application 2019 & 2032
- Table 116: Rest of Asia Pacific Generic Drugs Industry Volume (K Unit) Forecast, by Application 2019 & 2032
- Table 117: Global Generic Drugs Industry Revenue Million Forecast, by Route of Administration 2019 & 2032
- Table 118: Global Generic Drugs Industry Volume K Unit Forecast, by Route of Administration 2019 & 2032
- Table 119: Global Generic Drugs Industry Revenue Million Forecast, by Application 2019 & 2032
- Table 120: Global Generic Drugs Industry Volume K Unit Forecast, by Application 2019 & 2032
- Table 121: Global Generic Drugs Industry Revenue Million Forecast, by Distribution Channel 2019 & 2032
- Table 122: Global Generic Drugs Industry Volume K Unit Forecast, by Distribution Channel 2019 & 2032
- Table 123: Global Generic Drugs Industry Revenue Million Forecast, by Country 2019 & 2032
- Table 124: Global Generic Drugs Industry Volume K Unit Forecast, by Country 2019 & 2032
- Table 125: GCC Generic Drugs Industry Revenue (Million) Forecast, by Application 2019 & 2032
- Table 126: GCC Generic Drugs Industry Volume (K Unit) Forecast, by Application 2019 & 2032
- Table 127: South Africa Generic Drugs Industry Revenue (Million) Forecast, by Application 2019 & 2032
- Table 128: South Africa Generic Drugs Industry Volume (K Unit) Forecast, by Application 2019 & 2032
- Table 129: Rest of Middle East and Africa Generic Drugs Industry Revenue (Million) Forecast, by Application 2019 & 2032
- Table 130: Rest of Middle East and Africa Generic Drugs Industry Volume (K Unit) Forecast, by Application 2019 & 2032
- Table 131: Global Generic Drugs Industry Revenue Million Forecast, by Route of Administration 2019 & 2032
- Table 132: Global Generic Drugs Industry Volume K Unit Forecast, by Route of Administration 2019 & 2032
- Table 133: Global Generic Drugs Industry Revenue Million Forecast, by Application 2019 & 2032
- Table 134: Global Generic Drugs Industry Volume K Unit Forecast, by Application 2019 & 2032
- Table 135: Global Generic Drugs Industry Revenue Million Forecast, by Distribution Channel 2019 & 2032
- Table 136: Global Generic Drugs Industry Volume K Unit Forecast, by Distribution Channel 2019 & 2032
- Table 137: Global Generic Drugs Industry Revenue Million Forecast, by Country 2019 & 2032
- Table 138: Global Generic Drugs Industry Volume K Unit Forecast, by Country 2019 & 2032
- Table 139: Brazil Generic Drugs Industry Revenue (Million) Forecast, by Application 2019 & 2032
- Table 140: Brazil Generic Drugs Industry Volume (K Unit) Forecast, by Application 2019 & 2032
- Table 141: Argentina Generic Drugs Industry Revenue (Million) Forecast, by Application 2019 & 2032
- Table 142: Argentina Generic Drugs Industry Volume (K Unit) Forecast, by Application 2019 & 2032
- Table 143: Rest of South America Generic Drugs Industry Revenue (Million) Forecast, by Application 2019 & 2032
- Table 144: Rest of South America Generic Drugs Industry Volume (K Unit) Forecast, by Application 2019 & 2032
Frequently Asked Questions
1. What is the projected Compound Annual Growth Rate (CAGR) of the Generic Drugs Industry?
The projected CAGR is approximately 4.23%.
2. Which companies are prominent players in the Generic Drugs Industry?
Key companies in the market include Sanofi, AbbVie Inc (Allergan), Teva Pharmaceutical Industries Limited, Eli Lilly and Company, Abbott Laboratories, STADA Arzneimittel AG, Sun Pharmaceutical Industries Ltd, Baxter International Inc, GlaxoSmithKline PLC, Pfizer Inc, Mylan (Viatris Inc ).
3. What are the main segments of the Generic Drugs Industry?
The market segments include Route of Administration, Application, Distribution Channel.
4. Can you provide details about the market size?
The market size is estimated to be USD 413.60 Million as of 2022.
5. What are some drivers contributing to market growth?
Increasing Prevalence of Chronic Diseases; Rise in Geriatric Population; Increase in Healthcare Expenditure.
6. What are the notable trends driving market growth?
Oral Segment is Expected to Hold Significant Share in the Market Over the Forecast Period.
7. Are there any restraints impacting market growth?
Stringent Government Regulations; Adverse Effects Associated With the Drugs.
8. Can you provide examples of recent developments in the market?
May 2024: Dr. Reddy's Laboratories introduced a generic medication, Doxycycline Capsules (40 mg), to the US market. This medication is designed to combat a broad spectrum of bacterial infections. Notably, the product serves as a therapeutic generic alternative to the USFDA-approved Oracea capsules (40 mg).
9. What pricing options are available for accessing the report?
Pricing options include single-user, multi-user, and enterprise licenses priced at USD 4750, USD 5250, and USD 8750 respectively.
10. Is the market size provided in terms of value or volume?
The market size is provided in terms of value, measured in Million and volume, measured in K Unit.
11. Are there any specific market keywords associated with the report?
Yes, the market keyword associated with the report is "Generic Drugs Industry," which aids in identifying and referencing the specific market segment covered.
12. How do I determine which pricing option suits my needs best?
The pricing options vary based on user requirements and access needs. Individual users may opt for single-user licenses, while businesses requiring broader access may choose multi-user or enterprise licenses for cost-effective access to the report.
13. Are there any additional resources or data provided in the Generic Drugs Industry report?
While the report offers comprehensive insights, it's advisable to review the specific contents or supplementary materials provided to ascertain if additional resources or data are available.
14. How can I stay updated on further developments or reports in the Generic Drugs Industry?
To stay informed about further developments, trends, and reports in the Generic Drugs Industry, consider subscribing to industry newsletters, following relevant companies and organizations, or regularly checking reputable industry news sources and publications.
Methodology
Step 1 - Identification of Relevant Samples Size from Population Database


Step 2 - Approaches for Defining Global Market Size (Value, Volume* & Price*)

Note*: In applicable scenarios
Step 3 - Data Sources
Primary Research
- Web Analytics
- Survey Reports
- Research Institute
- Latest Research Reports
- Opinion Leaders
Secondary Research
- Annual Reports
- White Paper
- Latest Press Release
- Industry Association
- Paid Database
- Investor Presentations

Step 4 - Data Triangulation
Involves using different sources of information in order to increase the validity of a study
These sources are likely to be stakeholders in a program - participants, other researchers, program staff, other community members, and so on.
Then we put all data in single framework & apply various statistical tools to find out the dynamic on the market.
During the analysis stage, feedback from the stakeholder groups would be compared to determine areas of agreement as well as areas of divergence


