
Key Insights
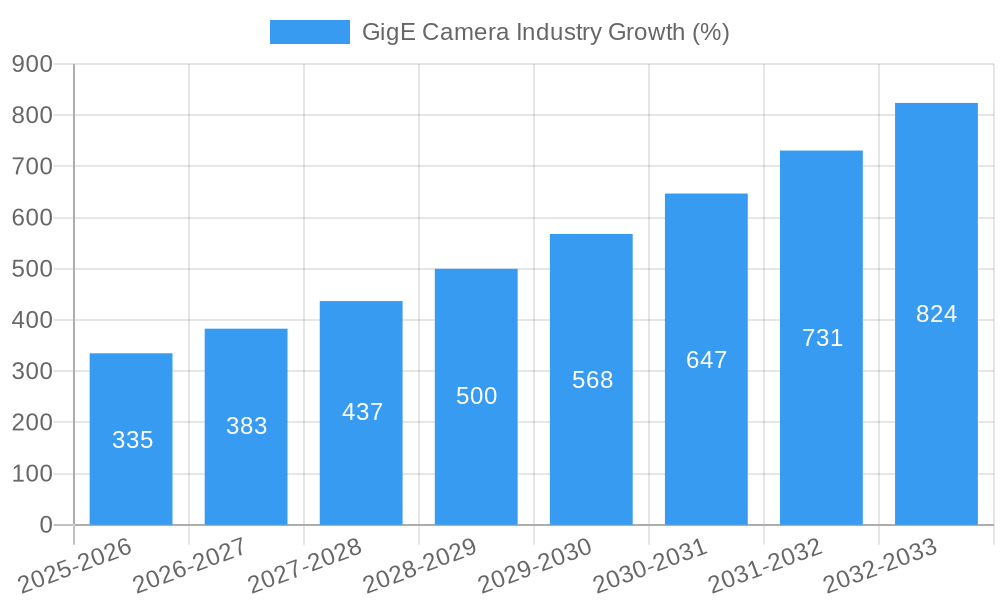
The GigE Vision camera market is experiencing robust growth, driven by increasing demand across diverse sectors. The market's 13.60% CAGR indicates a significant expansion, projected to reach substantial value by 2033. Several factors contribute to this growth. The rise of automation in industrial settings, particularly in manufacturing and logistics, fuels a strong need for high-speed, high-resolution imaging solutions offered by GigE cameras. Furthermore, advancements in CMOS technology are leading to smaller, more efficient, and cost-effective cameras, broadening their accessibility across applications. The medical and life sciences sectors are also key adopters, leveraging GigE cameras for advanced microscopy, diagnostic imaging, and surgical guidance. Security and surveillance applications further contribute to market expansion, with the need for high-quality video monitoring and real-time analysis driving adoption. While the initial investment in infrastructure can be a restraint for some businesses, the long-term benefits in terms of efficiency and data quality outweigh this initial hurdle. Market segmentation reveals strong growth across various camera types, including area scan and line scan, and color sensor types. Geographical distribution indicates significant market presence across North America and Europe, followed by rapidly growing markets in the Asia-Pacific region fueled by industrial expansion and technological advancements in China, Japan, and India. Competition among leading manufacturers is intense, fostering innovation and driving down costs. The continued integration of AI and machine learning capabilities within GigE camera systems is poised to propel market growth further in the coming years, pushing the boundaries of what's possible in various applications.
The future of the GigE Vision camera market is bright, with consistent growth expected throughout the forecast period. The continuous improvement in image quality, resolution, and data transfer speeds is driving adoption in new applications. Furthermore, the decreasing cost of GigE cameras makes them more accessible to a broader range of users and industries. The development of compact and robust cameras is especially significant for mobile robotics and embedded vision systems, furthering market expansion. While challenges remain in terms of standardization and interoperability, the market's overall momentum is strong, driven by technological advancements and sustained demand across core and emerging applications. The evolution of the market will likely be characterized by increasing sophistication of image processing capabilities within the cameras themselves, leading to a reduction in the need for powerful external processing units.
This comprehensive report provides a detailed analysis of the GigE Camera industry, covering market size, segmentation, growth drivers, challenges, and future outlook. The study period spans from 2019 to 2033, with 2025 as the base and estimated year. The report offers actionable insights for industry stakeholders, including manufacturers, investors, and researchers. The global GigE camera market is projected to reach xx Million by 2033, exhibiting a CAGR of xx% during the forecast period (2025-2033).
GigE Camera Industry Market Concentration & Innovation
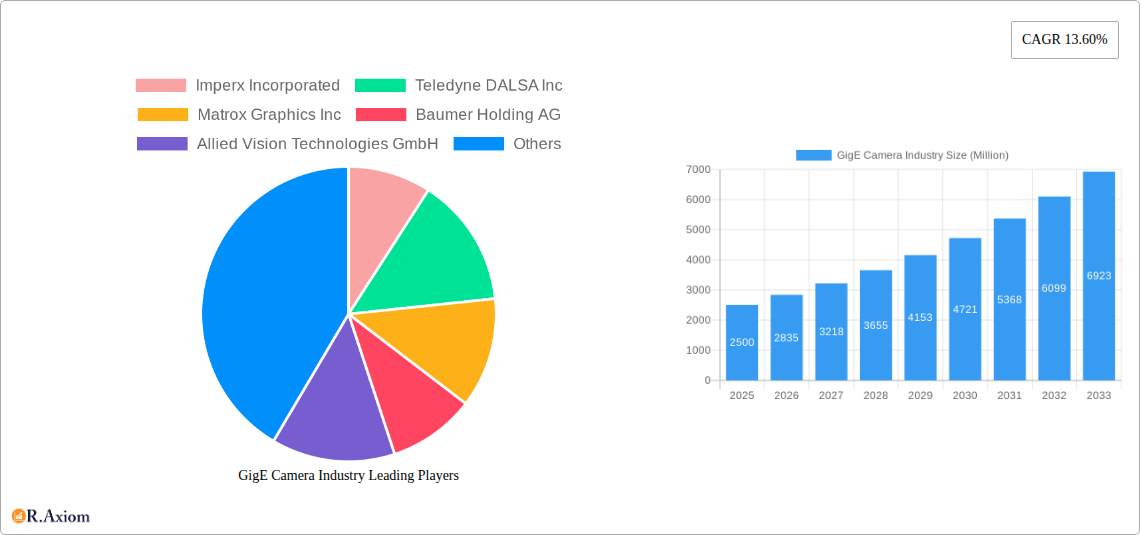
The GigE camera market exhibits a moderately concentrated landscape, with several key players holding significant market share. Imperx Incorporated, Teledyne DALSA Inc, Matrox Graphics Inc, Baumer Holding AG, and Basler AG are among the leading companies, collectively accounting for an estimated xx% of the global market in 2025. Market share is dynamic, influenced by continuous innovation, strategic acquisitions, and evolving end-user demands.
Innovation Drivers:
- Advancements in CMOS sensor technology, driving higher resolution, faster frame rates, and improved image quality.
- Development of advanced features like embedded processing and intelligent imaging capabilities.
- Growing demand for compact and robust GigE cameras for diverse applications.
Regulatory Frameworks & Product Substitutes:
Regulatory compliance varies by region, impacting the adoption of GigE cameras in specific sectors. Competition arises from alternative technologies, such as USB3 Vision and other industrial camera interfaces, although GigE Vision remains a dominant standard due to its high bandwidth and long-distance capabilities.
End-User Trends & M&A Activities:
The increasing adoption of automation and machine vision in industries such as automotive, manufacturing, and healthcare fuels market growth. M&A activities play a crucial role in market consolidation. While precise deal values are confidential, several significant acquisitions have occurred in recent years, further consolidating the market and driving innovation. For example, the xx Million acquisition of Company X by Company Y in 2022 demonstrated a trend towards vertical integration within the industry.
GigE Camera Industry Industry Trends & Insights
The GigE camera market is experiencing robust growth driven by several factors. The increasing adoption of automation and machine vision in various industries, coupled with advancements in sensor technology and image processing algorithms, are key drivers. The global market size reached an estimated xx Million in 2024 and is projected to reach xx Million by 2033, exhibiting a CAGR of xx%.
Several technological disruptions are shaping the market landscape. The transition from CCD to CMOS technology is ongoing, with CMOS sensors gaining popularity due to their lower power consumption, higher sensitivity, and cost-effectiveness. The integration of artificial intelligence (AI) and machine learning (ML) algorithms is enhancing image analysis capabilities, leading to the development of intelligent vision systems.
Consumer preferences are shifting towards higher resolution, faster frame rates, and improved image quality. There is also increasing demand for compact, robust, and cost-effective GigE cameras that can be easily integrated into various systems. Competitive dynamics are characterized by ongoing innovation, strategic partnerships, and acquisitions.
Dominant Markets & Segments in GigE Camera Industry
Leading Regions & Countries:
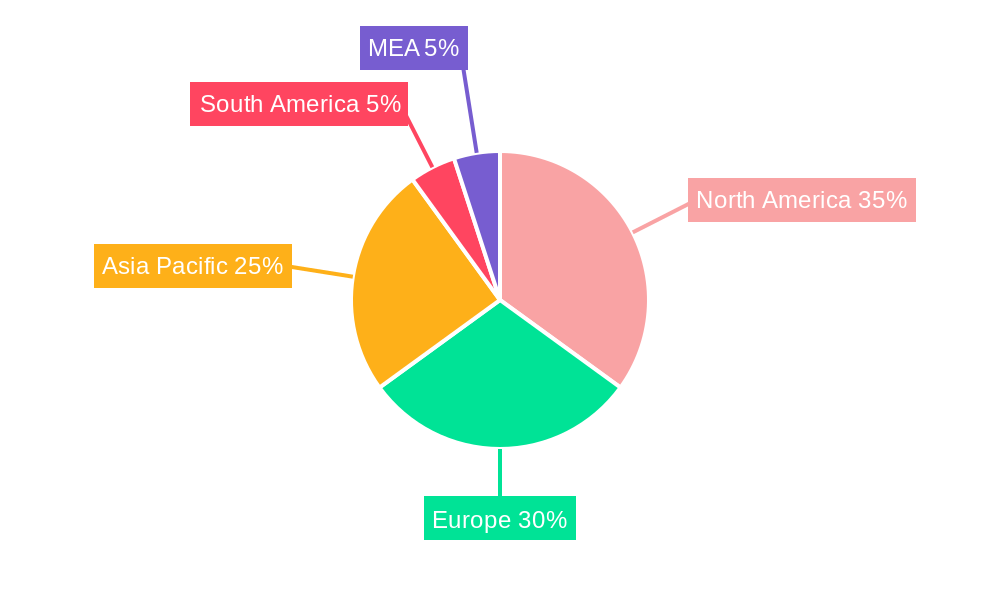
The North American and European markets currently hold dominant positions, driven by strong industrial automation and advanced technology adoption. However, the Asia-Pacific region exhibits substantial growth potential due to its expanding manufacturing sector and rising demand for machine vision solutions.
Dominant Segments:
- By Technology: CMOS technology dominates the market due to its advantages in cost, performance, and power consumption.
- By Type: Area scan cameras are widely used across various applications, while line scan cameras are prevalent in high-speed inspection scenarios.
- By Colour Sensor Type: Monochrome cameras are more commonly used for industrial automation applications requiring high sensitivity and speed, while color cameras find applications in various other fields such as medical imaging and security.
- By End-user Vertical: The industrial sector currently accounts for the largest share, with strong growth predicted in medical/life sciences, security & surveillance, and pharmaceutical sectors driven by automation and quality control needs.
Key Drivers:
- Industrial Automation: Increased adoption of automation and robotics across various industries is a significant driver.
- Technological Advancements: Continuous improvement in sensor technology, processing power, and image analysis capabilities fuel market growth.
- Government Initiatives: Government initiatives promoting automation and digitalization are further enhancing market prospects.
GigE Camera Industry Product Developments
Recent product innovations focus on increasing resolution, frame rates, and dynamic range while simultaneously reducing size and power consumption. The integration of AI and ML capabilities allows for sophisticated image processing and analysis, enabling intelligent automation in various applications. These features enhance the competitive advantage of GigE cameras by offering improved efficiency, accuracy, and ease of integration.
Report Scope & Segmentation Analysis
The report segments the GigE camera market by technology (CCD, CMOS), type (area scan, line scan), color sensor type (monochrome, color), and end-user vertical (industrial, medical/life sciences, traffic, security & surveillance, pharmaceutical, military & defense, other). Each segment's growth projections, market size, and competitive dynamics are analyzed in detail. For instance, the CMOS segment is projected to experience substantial growth due to its superior performance characteristics, while the industrial sector will remain the dominant end-user segment.
Key Drivers of GigE Camera Industry Growth
Several factors contribute to the growth of the GigE camera industry. Technological advancements, particularly in CMOS sensor technology and image processing algorithms, play a crucial role. Economic factors, such as increased investments in automation and machine vision across various industries, also drive demand. Furthermore, supportive government regulations and initiatives aimed at promoting automation and digitalization in different sectors contribute to the market's expansion.
Challenges in the GigE Camera Industry Sector
The GigE camera industry faces several challenges. Intense competition among established players and new entrants creates pressure on pricing and margins. Supply chain disruptions and fluctuations in raw material prices can impact production costs and availability. Furthermore, stringent regulatory requirements and compliance standards can increase the cost of product development and market entry. These factors combined can hinder market growth by an estimated xx%.
Emerging Opportunities in GigE Camera Industry
Emerging trends and opportunities include the integration of AI and ML for advanced image analysis, the development of specialized GigE cameras for specific applications (e.g., medical imaging, autonomous vehicles), and the expansion into new and emerging markets in developing economies. These opportunities will drive market expansion and innovation in the years to come.
Leading Players in the GigE Camera Industry Market
- Imperx Incorporated
- Teledyne DALSA Inc
- Matrox Graphics Inc
- Baumer Holding AG
- Allied Vision Technologies GmbH
- Pleora Technologies Inc
- FLIR Integrated Imaging Solutions Inc
- JAI A/S
- Sensor Technologies America Inc
- Basler AG
- Sony Corporation
- Toshiba Teli Corporation Ltd
Key Developments in GigE Camera Industry Industry
- 2022, Q4: Basler AG launched a new series of GigE cameras with improved low-light performance.
- 2023, Q1: Teledyne DALSA Inc announced a strategic partnership to expand its presence in the automotive market.
- 2023, Q2: Allied Vision Technologies GmbH acquired a smaller competitor, strengthening its market position. (Further details unavailable, estimated value xx Million)
Strategic Outlook for GigE Camera Industry Market
The future of the GigE camera industry appears promising, driven by ongoing technological advancements, increasing automation across various industries, and expanding applications. New market opportunities in emerging economies and the continuous integration of AI and ML technologies will further fuel market growth. Companies that prioritize innovation, strategic partnerships, and adaptation to evolving market trends will be best positioned for success in this dynamic landscape.
GigE Camera Industry Segmentation
-
1. Technology
- 1.1. Charge Coupled Device (CCD)
- 1.2. Complementary Metal- Oxide - Semiconductor (CMOS)
-
2. Type
- 2.1. Area Scan
- 2.2. Line Scan
-
3. Colour Sensor Type
- 3.1. Monochrome
-
4. End-user Vertical
- 4.1. Industrial
- 4.2. Medical / Life Sciences
- 4.3. Traffic, Security & Surveillance
- 4.4. Pharmaceutical
- 4.5. Military and Defense
- 4.6. Other End-user Verticals
GigE Camera Industry Segmentation By Geography
- 1. North America
- 2. Europe
- 3. Asia Pacific
- 4. Latin America
- 5. Middle East
GigE Camera Industry REPORT HIGHLIGHTS
| Aspects | Details |
|---|---|
| Study Period | 2019-2033 |
| Base Year | 2024 |
| Estimated Year | 2025 |
| Forecast Period | 2025-2033 |
| Historical Period | 2019-2024 |
| Growth Rate | CAGR of 13.60% from 2019-2033 |
| Segmentation |
|
Table of Contents
- 1. Introduction
- 1.1. Research Scope
- 1.2. Market Segmentation
- 1.3. Research Methodology
- 1.4. Definitions and Assumptions
- 2. Executive Summary
- 2.1. Introduction
- 3. Market Dynamics
- 3.1. Introduction
- 3.2. Market Drivers
- 3.2.1. ; Efficient Data Transfer Coupled with Faster Transfer Rate; Ability to Connect with Numerous Devices
- 3.3. Market Restrains
- 3.3.1. ; Universal Drivers needed for Interoperability; Excessive Load on the CPU
- 3.4. Market Trends
- 3.4.1 Traffic
- 3.4.2 Security & Surveillance Segment to Grow Significantly
- 4. Market Factor Analysis
- 4.1. Porters Five Forces
- 4.2. Supply/Value Chain
- 4.3. PESTEL analysis
- 4.4. Market Entropy
- 4.5. Patent/Trademark Analysis
- 5. Global GigE Camera Industry Analysis, Insights and Forecast, 2019-2031
- 5.1. Market Analysis, Insights and Forecast - by Technology
- 5.1.1. Charge Coupled Device (CCD)
- 5.1.2. Complementary Metal- Oxide - Semiconductor (CMOS)
- 5.2. Market Analysis, Insights and Forecast - by Type
- 5.2.1. Area Scan
- 5.2.2. Line Scan
- 5.3. Market Analysis, Insights and Forecast - by Colour Sensor Type
- 5.3.1. Monochrome
- 5.4. Market Analysis, Insights and Forecast - by End-user Vertical
- 5.4.1. Industrial
- 5.4.2. Medical / Life Sciences
- 5.4.3. Traffic, Security & Surveillance
- 5.4.4. Pharmaceutical
- 5.4.5. Military and Defense
- 5.4.6. Other End-user Verticals
- 5.5. Market Analysis, Insights and Forecast - by Region
- 5.5.1. North America
- 5.5.2. Europe
- 5.5.3. Asia Pacific
- 5.5.4. Latin America
- 5.5.5. Middle East
- 5.1. Market Analysis, Insights and Forecast - by Technology
- 6. North America GigE Camera Industry Analysis, Insights and Forecast, 2019-2031
- 6.1. Market Analysis, Insights and Forecast - by Technology
- 6.1.1. Charge Coupled Device (CCD)
- 6.1.2. Complementary Metal- Oxide - Semiconductor (CMOS)
- 6.2. Market Analysis, Insights and Forecast - by Type
- 6.2.1. Area Scan
- 6.2.2. Line Scan
- 6.3. Market Analysis, Insights and Forecast - by Colour Sensor Type
- 6.3.1. Monochrome
- 6.4. Market Analysis, Insights and Forecast - by End-user Vertical
- 6.4.1. Industrial
- 6.4.2. Medical / Life Sciences
- 6.4.3. Traffic, Security & Surveillance
- 6.4.4. Pharmaceutical
- 6.4.5. Military and Defense
- 6.4.6. Other End-user Verticals
- 6.1. Market Analysis, Insights and Forecast - by Technology
- 7. Europe GigE Camera Industry Analysis, Insights and Forecast, 2019-2031
- 7.1. Market Analysis, Insights and Forecast - by Technology
- 7.1.1. Charge Coupled Device (CCD)
- 7.1.2. Complementary Metal- Oxide - Semiconductor (CMOS)
- 7.2. Market Analysis, Insights and Forecast - by Type
- 7.2.1. Area Scan
- 7.2.2. Line Scan
- 7.3. Market Analysis, Insights and Forecast - by Colour Sensor Type
- 7.3.1. Monochrome
- 7.4. Market Analysis, Insights and Forecast - by End-user Vertical
- 7.4.1. Industrial
- 7.4.2. Medical / Life Sciences
- 7.4.3. Traffic, Security & Surveillance
- 7.4.4. Pharmaceutical
- 7.4.5. Military and Defense
- 7.4.6. Other End-user Verticals
- 7.1. Market Analysis, Insights and Forecast - by Technology
- 8. Asia Pacific GigE Camera Industry Analysis, Insights and Forecast, 2019-2031
- 8.1. Market Analysis, Insights and Forecast - by Technology
- 8.1.1. Charge Coupled Device (CCD)
- 8.1.2. Complementary Metal- Oxide - Semiconductor (CMOS)
- 8.2. Market Analysis, Insights and Forecast - by Type
- 8.2.1. Area Scan
- 8.2.2. Line Scan
- 8.3. Market Analysis, Insights and Forecast - by Colour Sensor Type
- 8.3.1. Monochrome
- 8.4. Market Analysis, Insights and Forecast - by End-user Vertical
- 8.4.1. Industrial
- 8.4.2. Medical / Life Sciences
- 8.4.3. Traffic, Security & Surveillance
- 8.4.4. Pharmaceutical
- 8.4.5. Military and Defense
- 8.4.6. Other End-user Verticals
- 8.1. Market Analysis, Insights and Forecast - by Technology
- 9. Latin America GigE Camera Industry Analysis, Insights and Forecast, 2019-2031
- 9.1. Market Analysis, Insights and Forecast - by Technology
- 9.1.1. Charge Coupled Device (CCD)
- 9.1.2. Complementary Metal- Oxide - Semiconductor (CMOS)
- 9.2. Market Analysis, Insights and Forecast - by Type
- 9.2.1. Area Scan
- 9.2.2. Line Scan
- 9.3. Market Analysis, Insights and Forecast - by Colour Sensor Type
- 9.3.1. Monochrome
- 9.4. Market Analysis, Insights and Forecast - by End-user Vertical
- 9.4.1. Industrial
- 9.4.2. Medical / Life Sciences
- 9.4.3. Traffic, Security & Surveillance
- 9.4.4. Pharmaceutical
- 9.4.5. Military and Defense
- 9.4.6. Other End-user Verticals
- 9.1. Market Analysis, Insights and Forecast - by Technology
- 10. Middle East GigE Camera Industry Analysis, Insights and Forecast, 2019-2031
- 10.1. Market Analysis, Insights and Forecast - by Technology
- 10.1.1. Charge Coupled Device (CCD)
- 10.1.2. Complementary Metal- Oxide - Semiconductor (CMOS)
- 10.2. Market Analysis, Insights and Forecast - by Type
- 10.2.1. Area Scan
- 10.2.2. Line Scan
- 10.3. Market Analysis, Insights and Forecast - by Colour Sensor Type
- 10.3.1. Monochrome
- 10.4. Market Analysis, Insights and Forecast - by End-user Vertical
- 10.4.1. Industrial
- 10.4.2. Medical / Life Sciences
- 10.4.3. Traffic, Security & Surveillance
- 10.4.4. Pharmaceutical
- 10.4.5. Military and Defense
- 10.4.6. Other End-user Verticals
- 10.1. Market Analysis, Insights and Forecast - by Technology
- 11. North America GigE Camera Industry Analysis, Insights and Forecast, 2019-2031
- 11.1. Market Analysis, Insights and Forecast - By Country/Sub-region
- 11.1.1 United States
- 11.1.2 Canada
- 11.1.3 Mexico
- 12. Europe GigE Camera Industry Analysis, Insights and Forecast, 2019-2031
- 12.1. Market Analysis, Insights and Forecast - By Country/Sub-region
- 12.1.1 Germany
- 12.1.2 United Kingdom
- 12.1.3 France
- 12.1.4 Spain
- 12.1.5 Italy
- 12.1.6 Spain
- 12.1.7 Belgium
- 12.1.8 Netherland
- 12.1.9 Nordics
- 12.1.10 Rest of Europe
- 13. Asia Pacific GigE Camera Industry Analysis, Insights and Forecast, 2019-2031
- 13.1. Market Analysis, Insights and Forecast - By Country/Sub-region
- 13.1.1 China
- 13.1.2 Japan
- 13.1.3 India
- 13.1.4 South Korea
- 13.1.5 Southeast Asia
- 13.1.6 Australia
- 13.1.7 Indonesia
- 13.1.8 Phillipes
- 13.1.9 Singapore
- 13.1.10 Thailandc
- 13.1.11 Rest of Asia Pacific
- 14. South America GigE Camera Industry Analysis, Insights and Forecast, 2019-2031
- 14.1. Market Analysis, Insights and Forecast - By Country/Sub-region
- 14.1.1 Brazil
- 14.1.2 Argentina
- 14.1.3 Peru
- 14.1.4 Chile
- 14.1.5 Colombia
- 14.1.6 Ecuador
- 14.1.7 Venezuela
- 14.1.8 Rest of South America
- 15. North America GigE Camera Industry Analysis, Insights and Forecast, 2019-2031
- 15.1. Market Analysis, Insights and Forecast - By Country/Sub-region
- 15.1.1 United States
- 15.1.2 Canada
- 15.1.3 Mexico
- 16. MEA GigE Camera Industry Analysis, Insights and Forecast, 2019-2031
- 16.1. Market Analysis, Insights and Forecast - By Country/Sub-region
- 16.1.1 United Arab Emirates
- 16.1.2 Saudi Arabia
- 16.1.3 South Africa
- 16.1.4 Rest of Middle East and Africa
- 17. Competitive Analysis
- 17.1. Global Market Share Analysis 2024
- 17.2. Company Profiles
- 17.2.1 Imperx Incorporated
- 17.2.1.1. Overview
- 17.2.1.2. Products
- 17.2.1.3. SWOT Analysis
- 17.2.1.4. Recent Developments
- 17.2.1.5. Financials (Based on Availability)
- 17.2.2 Teledyne DALSA Inc
- 17.2.2.1. Overview
- 17.2.2.2. Products
- 17.2.2.3. SWOT Analysis
- 17.2.2.4. Recent Developments
- 17.2.2.5. Financials (Based on Availability)
- 17.2.3 Matrox Graphics Inc
- 17.2.3.1. Overview
- 17.2.3.2. Products
- 17.2.3.3. SWOT Analysis
- 17.2.3.4. Recent Developments
- 17.2.3.5. Financials (Based on Availability)
- 17.2.4 Baumer Holding AG
- 17.2.4.1. Overview
- 17.2.4.2. Products
- 17.2.4.3. SWOT Analysis
- 17.2.4.4. Recent Developments
- 17.2.4.5. Financials (Based on Availability)
- 17.2.5 Allied Vision Technologies GmbH
- 17.2.5.1. Overview
- 17.2.5.2. Products
- 17.2.5.3. SWOT Analysis
- 17.2.5.4. Recent Developments
- 17.2.5.5. Financials (Based on Availability)
- 17.2.6 Pleora Technologies Inc
- 17.2.6.1. Overview
- 17.2.6.2. Products
- 17.2.6.3. SWOT Analysis
- 17.2.6.4. Recent Developments
- 17.2.6.5. Financials (Based on Availability)
- 17.2.7 FLIR Integrated Imaging Solutions Inc
- 17.2.7.1. Overview
- 17.2.7.2. Products
- 17.2.7.3. SWOT Analysis
- 17.2.7.4. Recent Developments
- 17.2.7.5. Financials (Based on Availability)
- 17.2.8 JAI A/S
- 17.2.8.1. Overview
- 17.2.8.2. Products
- 17.2.8.3. SWOT Analysis
- 17.2.8.4. Recent Developments
- 17.2.8.5. Financials (Based on Availability)
- 17.2.9 Sensor Technologies America Inc
- 17.2.9.1. Overview
- 17.2.9.2. Products
- 17.2.9.3. SWOT Analysis
- 17.2.9.4. Recent Developments
- 17.2.9.5. Financials (Based on Availability)
- 17.2.10 Basler AG
- 17.2.10.1. Overview
- 17.2.10.2. Products
- 17.2.10.3. SWOT Analysis
- 17.2.10.4. Recent Developments
- 17.2.10.5. Financials (Based on Availability)
- 17.2.11 Sony Corporation
- 17.2.11.1. Overview
- 17.2.11.2. Products
- 17.2.11.3. SWOT Analysis
- 17.2.11.4. Recent Developments
- 17.2.11.5. Financials (Based on Availability)
- 17.2.12 Toshiba Teli Corporation Ltd
- 17.2.12.1. Overview
- 17.2.12.2. Products
- 17.2.12.3. SWOT Analysis
- 17.2.12.4. Recent Developments
- 17.2.12.5. Financials (Based on Availability)
- 17.2.1 Imperx Incorporated
List of Figures
- Figure 1: Global GigE Camera Industry Revenue Breakdown (Million, %) by Region 2024 & 2032
- Figure 2: Global GigE Camera Industry Volume Breakdown (K Unit, %) by Region 2024 & 2032
- Figure 3: North America GigE Camera Industry Revenue (Million), by Country 2024 & 2032
- Figure 4: North America GigE Camera Industry Volume (K Unit), by Country 2024 & 2032
- Figure 5: North America GigE Camera Industry Revenue Share (%), by Country 2024 & 2032
- Figure 6: North America GigE Camera Industry Volume Share (%), by Country 2024 & 2032
- Figure 7: Europe GigE Camera Industry Revenue (Million), by Country 2024 & 2032
- Figure 8: Europe GigE Camera Industry Volume (K Unit), by Country 2024 & 2032
- Figure 9: Europe GigE Camera Industry Revenue Share (%), by Country 2024 & 2032
- Figure 10: Europe GigE Camera Industry Volume Share (%), by Country 2024 & 2032
- Figure 11: Asia Pacific GigE Camera Industry Revenue (Million), by Country 2024 & 2032
- Figure 12: Asia Pacific GigE Camera Industry Volume (K Unit), by Country 2024 & 2032
- Figure 13: Asia Pacific GigE Camera Industry Revenue Share (%), by Country 2024 & 2032
- Figure 14: Asia Pacific GigE Camera Industry Volume Share (%), by Country 2024 & 2032
- Figure 15: South America GigE Camera Industry Revenue (Million), by Country 2024 & 2032
- Figure 16: South America GigE Camera Industry Volume (K Unit), by Country 2024 & 2032
- Figure 17: South America GigE Camera Industry Revenue Share (%), by Country 2024 & 2032
- Figure 18: South America GigE Camera Industry Volume Share (%), by Country 2024 & 2032
- Figure 19: North America GigE Camera Industry Revenue (Million), by Country 2024 & 2032
- Figure 20: North America GigE Camera Industry Volume (K Unit), by Country 2024 & 2032
- Figure 21: North America GigE Camera Industry Revenue Share (%), by Country 2024 & 2032
- Figure 22: North America GigE Camera Industry Volume Share (%), by Country 2024 & 2032
- Figure 23: MEA GigE Camera Industry Revenue (Million), by Country 2024 & 2032
- Figure 24: MEA GigE Camera Industry Volume (K Unit), by Country 2024 & 2032
- Figure 25: MEA GigE Camera Industry Revenue Share (%), by Country 2024 & 2032
- Figure 26: MEA GigE Camera Industry Volume Share (%), by Country 2024 & 2032
- Figure 27: North America GigE Camera Industry Revenue (Million), by Technology 2024 & 2032
- Figure 28: North America GigE Camera Industry Volume (K Unit), by Technology 2024 & 2032
- Figure 29: North America GigE Camera Industry Revenue Share (%), by Technology 2024 & 2032
- Figure 30: North America GigE Camera Industry Volume Share (%), by Technology 2024 & 2032
- Figure 31: North America GigE Camera Industry Revenue (Million), by Type 2024 & 2032
- Figure 32: North America GigE Camera Industry Volume (K Unit), by Type 2024 & 2032
- Figure 33: North America GigE Camera Industry Revenue Share (%), by Type 2024 & 2032
- Figure 34: North America GigE Camera Industry Volume Share (%), by Type 2024 & 2032
- Figure 35: North America GigE Camera Industry Revenue (Million), by Colour Sensor Type 2024 & 2032
- Figure 36: North America GigE Camera Industry Volume (K Unit), by Colour Sensor Type 2024 & 2032
- Figure 37: North America GigE Camera Industry Revenue Share (%), by Colour Sensor Type 2024 & 2032
- Figure 38: North America GigE Camera Industry Volume Share (%), by Colour Sensor Type 2024 & 2032
- Figure 39: North America GigE Camera Industry Revenue (Million), by End-user Vertical 2024 & 2032
- Figure 40: North America GigE Camera Industry Volume (K Unit), by End-user Vertical 2024 & 2032
- Figure 41: North America GigE Camera Industry Revenue Share (%), by End-user Vertical 2024 & 2032
- Figure 42: North America GigE Camera Industry Volume Share (%), by End-user Vertical 2024 & 2032
- Figure 43: North America GigE Camera Industry Revenue (Million), by Country 2024 & 2032
- Figure 44: North America GigE Camera Industry Volume (K Unit), by Country 2024 & 2032
- Figure 45: North America GigE Camera Industry Revenue Share (%), by Country 2024 & 2032
- Figure 46: North America GigE Camera Industry Volume Share (%), by Country 2024 & 2032
- Figure 47: Europe GigE Camera Industry Revenue (Million), by Technology 2024 & 2032
- Figure 48: Europe GigE Camera Industry Volume (K Unit), by Technology 2024 & 2032
- Figure 49: Europe GigE Camera Industry Revenue Share (%), by Technology 2024 & 2032
- Figure 50: Europe GigE Camera Industry Volume Share (%), by Technology 2024 & 2032
- Figure 51: Europe GigE Camera Industry Revenue (Million), by Type 2024 & 2032
- Figure 52: Europe GigE Camera Industry Volume (K Unit), by Type 2024 & 2032
- Figure 53: Europe GigE Camera Industry Revenue Share (%), by Type 2024 & 2032
- Figure 54: Europe GigE Camera Industry Volume Share (%), by Type 2024 & 2032
- Figure 55: Europe GigE Camera Industry Revenue (Million), by Colour Sensor Type 2024 & 2032
- Figure 56: Europe GigE Camera Industry Volume (K Unit), by Colour Sensor Type 2024 & 2032
- Figure 57: Europe GigE Camera Industry Revenue Share (%), by Colour Sensor Type 2024 & 2032
- Figure 58: Europe GigE Camera Industry Volume Share (%), by Colour Sensor Type 2024 & 2032
- Figure 59: Europe GigE Camera Industry Revenue (Million), by End-user Vertical 2024 & 2032
- Figure 60: Europe GigE Camera Industry Volume (K Unit), by End-user Vertical 2024 & 2032
- Figure 61: Europe GigE Camera Industry Revenue Share (%), by End-user Vertical 2024 & 2032
- Figure 62: Europe GigE Camera Industry Volume Share (%), by End-user Vertical 2024 & 2032
- Figure 63: Europe GigE Camera Industry Revenue (Million), by Country 2024 & 2032
- Figure 64: Europe GigE Camera Industry Volume (K Unit), by Country 2024 & 2032
- Figure 65: Europe GigE Camera Industry Revenue Share (%), by Country 2024 & 2032
- Figure 66: Europe GigE Camera Industry Volume Share (%), by Country 2024 & 2032
- Figure 67: Asia Pacific GigE Camera Industry Revenue (Million), by Technology 2024 & 2032
- Figure 68: Asia Pacific GigE Camera Industry Volume (K Unit), by Technology 2024 & 2032
- Figure 69: Asia Pacific GigE Camera Industry Revenue Share (%), by Technology 2024 & 2032
- Figure 70: Asia Pacific GigE Camera Industry Volume Share (%), by Technology 2024 & 2032
- Figure 71: Asia Pacific GigE Camera Industry Revenue (Million), by Type 2024 & 2032
- Figure 72: Asia Pacific GigE Camera Industry Volume (K Unit), by Type 2024 & 2032
- Figure 73: Asia Pacific GigE Camera Industry Revenue Share (%), by Type 2024 & 2032
- Figure 74: Asia Pacific GigE Camera Industry Volume Share (%), by Type 2024 & 2032
- Figure 75: Asia Pacific GigE Camera Industry Revenue (Million), by Colour Sensor Type 2024 & 2032
- Figure 76: Asia Pacific GigE Camera Industry Volume (K Unit), by Colour Sensor Type 2024 & 2032
- Figure 77: Asia Pacific GigE Camera Industry Revenue Share (%), by Colour Sensor Type 2024 & 2032
- Figure 78: Asia Pacific GigE Camera Industry Volume Share (%), by Colour Sensor Type 2024 & 2032
- Figure 79: Asia Pacific GigE Camera Industry Revenue (Million), by End-user Vertical 2024 & 2032
- Figure 80: Asia Pacific GigE Camera Industry Volume (K Unit), by End-user Vertical 2024 & 2032
- Figure 81: Asia Pacific GigE Camera Industry Revenue Share (%), by End-user Vertical 2024 & 2032
- Figure 82: Asia Pacific GigE Camera Industry Volume Share (%), by End-user Vertical 2024 & 2032
- Figure 83: Asia Pacific GigE Camera Industry Revenue (Million), by Country 2024 & 2032
- Figure 84: Asia Pacific GigE Camera Industry Volume (K Unit), by Country 2024 & 2032
- Figure 85: Asia Pacific GigE Camera Industry Revenue Share (%), by Country 2024 & 2032
- Figure 86: Asia Pacific GigE Camera Industry Volume Share (%), by Country 2024 & 2032
- Figure 87: Latin America GigE Camera Industry Revenue (Million), by Technology 2024 & 2032
- Figure 88: Latin America GigE Camera Industry Volume (K Unit), by Technology 2024 & 2032
- Figure 89: Latin America GigE Camera Industry Revenue Share (%), by Technology 2024 & 2032
- Figure 90: Latin America GigE Camera Industry Volume Share (%), by Technology 2024 & 2032
- Figure 91: Latin America GigE Camera Industry Revenue (Million), by Type 2024 & 2032
- Figure 92: Latin America GigE Camera Industry Volume (K Unit), by Type 2024 & 2032
- Figure 93: Latin America GigE Camera Industry Revenue Share (%), by Type 2024 & 2032
- Figure 94: Latin America GigE Camera Industry Volume Share (%), by Type 2024 & 2032
- Figure 95: Latin America GigE Camera Industry Revenue (Million), by Colour Sensor Type 2024 & 2032
- Figure 96: Latin America GigE Camera Industry Volume (K Unit), by Colour Sensor Type 2024 & 2032
- Figure 97: Latin America GigE Camera Industry Revenue Share (%), by Colour Sensor Type 2024 & 2032
- Figure 98: Latin America GigE Camera Industry Volume Share (%), by Colour Sensor Type 2024 & 2032
- Figure 99: Latin America GigE Camera Industry Revenue (Million), by End-user Vertical 2024 & 2032
- Figure 100: Latin America GigE Camera Industry Volume (K Unit), by End-user Vertical 2024 & 2032
- Figure 101: Latin America GigE Camera Industry Revenue Share (%), by End-user Vertical 2024 & 2032
- Figure 102: Latin America GigE Camera Industry Volume Share (%), by End-user Vertical 2024 & 2032
- Figure 103: Latin America GigE Camera Industry Revenue (Million), by Country 2024 & 2032
- Figure 104: Latin America GigE Camera Industry Volume (K Unit), by Country 2024 & 2032
- Figure 105: Latin America GigE Camera Industry Revenue Share (%), by Country 2024 & 2032
- Figure 106: Latin America GigE Camera Industry Volume Share (%), by Country 2024 & 2032
- Figure 107: Middle East GigE Camera Industry Revenue (Million), by Technology 2024 & 2032
- Figure 108: Middle East GigE Camera Industry Volume (K Unit), by Technology 2024 & 2032
- Figure 109: Middle East GigE Camera Industry Revenue Share (%), by Technology 2024 & 2032
- Figure 110: Middle East GigE Camera Industry Volume Share (%), by Technology 2024 & 2032
- Figure 111: Middle East GigE Camera Industry Revenue (Million), by Type 2024 & 2032
- Figure 112: Middle East GigE Camera Industry Volume (K Unit), by Type 2024 & 2032
- Figure 113: Middle East GigE Camera Industry Revenue Share (%), by Type 2024 & 2032
- Figure 114: Middle East GigE Camera Industry Volume Share (%), by Type 2024 & 2032
- Figure 115: Middle East GigE Camera Industry Revenue (Million), by Colour Sensor Type 2024 & 2032
- Figure 116: Middle East GigE Camera Industry Volume (K Unit), by Colour Sensor Type 2024 & 2032
- Figure 117: Middle East GigE Camera Industry Revenue Share (%), by Colour Sensor Type 2024 & 2032
- Figure 118: Middle East GigE Camera Industry Volume Share (%), by Colour Sensor Type 2024 & 2032
- Figure 119: Middle East GigE Camera Industry Revenue (Million), by End-user Vertical 2024 & 2032
- Figure 120: Middle East GigE Camera Industry Volume (K Unit), by End-user Vertical 2024 & 2032
- Figure 121: Middle East GigE Camera Industry Revenue Share (%), by End-user Vertical 2024 & 2032
- Figure 122: Middle East GigE Camera Industry Volume Share (%), by End-user Vertical 2024 & 2032
- Figure 123: Middle East GigE Camera Industry Revenue (Million), by Country 2024 & 2032
- Figure 124: Middle East GigE Camera Industry Volume (K Unit), by Country 2024 & 2032
- Figure 125: Middle East GigE Camera Industry Revenue Share (%), by Country 2024 & 2032
- Figure 126: Middle East GigE Camera Industry Volume Share (%), by Country 2024 & 2032
List of Tables
- Table 1: Global GigE Camera Industry Revenue Million Forecast, by Region 2019 & 2032
- Table 2: Global GigE Camera Industry Volume K Unit Forecast, by Region 2019 & 2032
- Table 3: Global GigE Camera Industry Revenue Million Forecast, by Technology 2019 & 2032
- Table 4: Global GigE Camera Industry Volume K Unit Forecast, by Technology 2019 & 2032
- Table 5: Global GigE Camera Industry Revenue Million Forecast, by Type 2019 & 2032
- Table 6: Global GigE Camera Industry Volume K Unit Forecast, by Type 2019 & 2032
- Table 7: Global GigE Camera Industry Revenue Million Forecast, by Colour Sensor Type 2019 & 2032
- Table 8: Global GigE Camera Industry Volume K Unit Forecast, by Colour Sensor Type 2019 & 2032
- Table 9: Global GigE Camera Industry Revenue Million Forecast, by End-user Vertical 2019 & 2032
- Table 10: Global GigE Camera Industry Volume K Unit Forecast, by End-user Vertical 2019 & 2032
- Table 11: Global GigE Camera Industry Revenue Million Forecast, by Region 2019 & 2032
- Table 12: Global GigE Camera Industry Volume K Unit Forecast, by Region 2019 & 2032
- Table 13: Global GigE Camera Industry Revenue Million Forecast, by Country 2019 & 2032
- Table 14: Global GigE Camera Industry Volume K Unit Forecast, by Country 2019 & 2032
- Table 15: United States GigE Camera Industry Revenue (Million) Forecast, by Application 2019 & 2032
- Table 16: United States GigE Camera Industry Volume (K Unit) Forecast, by Application 2019 & 2032
- Table 17: Canada GigE Camera Industry Revenue (Million) Forecast, by Application 2019 & 2032
- Table 18: Canada GigE Camera Industry Volume (K Unit) Forecast, by Application 2019 & 2032
- Table 19: Mexico GigE Camera Industry Revenue (Million) Forecast, by Application 2019 & 2032
- Table 20: Mexico GigE Camera Industry Volume (K Unit) Forecast, by Application 2019 & 2032
- Table 21: Global GigE Camera Industry Revenue Million Forecast, by Country 2019 & 2032
- Table 22: Global GigE Camera Industry Volume K Unit Forecast, by Country 2019 & 2032
- Table 23: Germany GigE Camera Industry Revenue (Million) Forecast, by Application 2019 & 2032
- Table 24: Germany GigE Camera Industry Volume (K Unit) Forecast, by Application 2019 & 2032
- Table 25: United Kingdom GigE Camera Industry Revenue (Million) Forecast, by Application 2019 & 2032
- Table 26: United Kingdom GigE Camera Industry Volume (K Unit) Forecast, by Application 2019 & 2032
- Table 27: France GigE Camera Industry Revenue (Million) Forecast, by Application 2019 & 2032
- Table 28: France GigE Camera Industry Volume (K Unit) Forecast, by Application 2019 & 2032
- Table 29: Spain GigE Camera Industry Revenue (Million) Forecast, by Application 2019 & 2032
- Table 30: Spain GigE Camera Industry Volume (K Unit) Forecast, by Application 2019 & 2032
- Table 31: Italy GigE Camera Industry Revenue (Million) Forecast, by Application 2019 & 2032
- Table 32: Italy GigE Camera Industry Volume (K Unit) Forecast, by Application 2019 & 2032
- Table 33: Spain GigE Camera Industry Revenue (Million) Forecast, by Application 2019 & 2032
- Table 34: Spain GigE Camera Industry Volume (K Unit) Forecast, by Application 2019 & 2032
- Table 35: Belgium GigE Camera Industry Revenue (Million) Forecast, by Application 2019 & 2032
- Table 36: Belgium GigE Camera Industry Volume (K Unit) Forecast, by Application 2019 & 2032
- Table 37: Netherland GigE Camera Industry Revenue (Million) Forecast, by Application 2019 & 2032
- Table 38: Netherland GigE Camera Industry Volume (K Unit) Forecast, by Application 2019 & 2032
- Table 39: Nordics GigE Camera Industry Revenue (Million) Forecast, by Application 2019 & 2032
- Table 40: Nordics GigE Camera Industry Volume (K Unit) Forecast, by Application 2019 & 2032
- Table 41: Rest of Europe GigE Camera Industry Revenue (Million) Forecast, by Application 2019 & 2032
- Table 42: Rest of Europe GigE Camera Industry Volume (K Unit) Forecast, by Application 2019 & 2032
- Table 43: Global GigE Camera Industry Revenue Million Forecast, by Country 2019 & 2032
- Table 44: Global GigE Camera Industry Volume K Unit Forecast, by Country 2019 & 2032
- Table 45: China GigE Camera Industry Revenue (Million) Forecast, by Application 2019 & 2032
- Table 46: China GigE Camera Industry Volume (K Unit) Forecast, by Application 2019 & 2032
- Table 47: Japan GigE Camera Industry Revenue (Million) Forecast, by Application 2019 & 2032
- Table 48: Japan GigE Camera Industry Volume (K Unit) Forecast, by Application 2019 & 2032
- Table 49: India GigE Camera Industry Revenue (Million) Forecast, by Application 2019 & 2032
- Table 50: India GigE Camera Industry Volume (K Unit) Forecast, by Application 2019 & 2032
- Table 51: South Korea GigE Camera Industry Revenue (Million) Forecast, by Application 2019 & 2032
- Table 52: South Korea GigE Camera Industry Volume (K Unit) Forecast, by Application 2019 & 2032
- Table 53: Southeast Asia GigE Camera Industry Revenue (Million) Forecast, by Application 2019 & 2032
- Table 54: Southeast Asia GigE Camera Industry Volume (K Unit) Forecast, by Application 2019 & 2032
- Table 55: Australia GigE Camera Industry Revenue (Million) Forecast, by Application 2019 & 2032
- Table 56: Australia GigE Camera Industry Volume (K Unit) Forecast, by Application 2019 & 2032
- Table 57: Indonesia GigE Camera Industry Revenue (Million) Forecast, by Application 2019 & 2032
- Table 58: Indonesia GigE Camera Industry Volume (K Unit) Forecast, by Application 2019 & 2032
- Table 59: Phillipes GigE Camera Industry Revenue (Million) Forecast, by Application 2019 & 2032
- Table 60: Phillipes GigE Camera Industry Volume (K Unit) Forecast, by Application 2019 & 2032
- Table 61: Singapore GigE Camera Industry Revenue (Million) Forecast, by Application 2019 & 2032
- Table 62: Singapore GigE Camera Industry Volume (K Unit) Forecast, by Application 2019 & 2032
- Table 63: Thailandc GigE Camera Industry Revenue (Million) Forecast, by Application 2019 & 2032
- Table 64: Thailandc GigE Camera Industry Volume (K Unit) Forecast, by Application 2019 & 2032
- Table 65: Rest of Asia Pacific GigE Camera Industry Revenue (Million) Forecast, by Application 2019 & 2032
- Table 66: Rest of Asia Pacific GigE Camera Industry Volume (K Unit) Forecast, by Application 2019 & 2032
- Table 67: Global GigE Camera Industry Revenue Million Forecast, by Country 2019 & 2032
- Table 68: Global GigE Camera Industry Volume K Unit Forecast, by Country 2019 & 2032
- Table 69: Brazil GigE Camera Industry Revenue (Million) Forecast, by Application 2019 & 2032
- Table 70: Brazil GigE Camera Industry Volume (K Unit) Forecast, by Application 2019 & 2032
- Table 71: Argentina GigE Camera Industry Revenue (Million) Forecast, by Application 2019 & 2032
- Table 72: Argentina GigE Camera Industry Volume (K Unit) Forecast, by Application 2019 & 2032
- Table 73: Peru GigE Camera Industry Revenue (Million) Forecast, by Application 2019 & 2032
- Table 74: Peru GigE Camera Industry Volume (K Unit) Forecast, by Application 2019 & 2032
- Table 75: Chile GigE Camera Industry Revenue (Million) Forecast, by Application 2019 & 2032
- Table 76: Chile GigE Camera Industry Volume (K Unit) Forecast, by Application 2019 & 2032
- Table 77: Colombia GigE Camera Industry Revenue (Million) Forecast, by Application 2019 & 2032
- Table 78: Colombia GigE Camera Industry Volume (K Unit) Forecast, by Application 2019 & 2032
- Table 79: Ecuador GigE Camera Industry Revenue (Million) Forecast, by Application 2019 & 2032
- Table 80: Ecuador GigE Camera Industry Volume (K Unit) Forecast, by Application 2019 & 2032
- Table 81: Venezuela GigE Camera Industry Revenue (Million) Forecast, by Application 2019 & 2032
- Table 82: Venezuela GigE Camera Industry Volume (K Unit) Forecast, by Application 2019 & 2032
- Table 83: Rest of South America GigE Camera Industry Revenue (Million) Forecast, by Application 2019 & 2032
- Table 84: Rest of South America GigE Camera Industry Volume (K Unit) Forecast, by Application 2019 & 2032
- Table 85: Global GigE Camera Industry Revenue Million Forecast, by Country 2019 & 2032
- Table 86: Global GigE Camera Industry Volume K Unit Forecast, by Country 2019 & 2032
- Table 87: United States GigE Camera Industry Revenue (Million) Forecast, by Application 2019 & 2032
- Table 88: United States GigE Camera Industry Volume (K Unit) Forecast, by Application 2019 & 2032
- Table 89: Canada GigE Camera Industry Revenue (Million) Forecast, by Application 2019 & 2032
- Table 90: Canada GigE Camera Industry Volume (K Unit) Forecast, by Application 2019 & 2032
- Table 91: Mexico GigE Camera Industry Revenue (Million) Forecast, by Application 2019 & 2032
- Table 92: Mexico GigE Camera Industry Volume (K Unit) Forecast, by Application 2019 & 2032
- Table 93: Global GigE Camera Industry Revenue Million Forecast, by Country 2019 & 2032
- Table 94: Global GigE Camera Industry Volume K Unit Forecast, by Country 2019 & 2032
- Table 95: United Arab Emirates GigE Camera Industry Revenue (Million) Forecast, by Application 2019 & 2032
- Table 96: United Arab Emirates GigE Camera Industry Volume (K Unit) Forecast, by Application 2019 & 2032
- Table 97: Saudi Arabia GigE Camera Industry Revenue (Million) Forecast, by Application 2019 & 2032
- Table 98: Saudi Arabia GigE Camera Industry Volume (K Unit) Forecast, by Application 2019 & 2032
- Table 99: South Africa GigE Camera Industry Revenue (Million) Forecast, by Application 2019 & 2032
- Table 100: South Africa GigE Camera Industry Volume (K Unit) Forecast, by Application 2019 & 2032
- Table 101: Rest of Middle East and Africa GigE Camera Industry Revenue (Million) Forecast, by Application 2019 & 2032
- Table 102: Rest of Middle East and Africa GigE Camera Industry Volume (K Unit) Forecast, by Application 2019 & 2032
- Table 103: Global GigE Camera Industry Revenue Million Forecast, by Technology 2019 & 2032
- Table 104: Global GigE Camera Industry Volume K Unit Forecast, by Technology 2019 & 2032
- Table 105: Global GigE Camera Industry Revenue Million Forecast, by Type 2019 & 2032
- Table 106: Global GigE Camera Industry Volume K Unit Forecast, by Type 2019 & 2032
- Table 107: Global GigE Camera Industry Revenue Million Forecast, by Colour Sensor Type 2019 & 2032
- Table 108: Global GigE Camera Industry Volume K Unit Forecast, by Colour Sensor Type 2019 & 2032
- Table 109: Global GigE Camera Industry Revenue Million Forecast, by End-user Vertical 2019 & 2032
- Table 110: Global GigE Camera Industry Volume K Unit Forecast, by End-user Vertical 2019 & 2032
- Table 111: Global GigE Camera Industry Revenue Million Forecast, by Country 2019 & 2032
- Table 112: Global GigE Camera Industry Volume K Unit Forecast, by Country 2019 & 2032
- Table 113: Global GigE Camera Industry Revenue Million Forecast, by Technology 2019 & 2032
- Table 114: Global GigE Camera Industry Volume K Unit Forecast, by Technology 2019 & 2032
- Table 115: Global GigE Camera Industry Revenue Million Forecast, by Type 2019 & 2032
- Table 116: Global GigE Camera Industry Volume K Unit Forecast, by Type 2019 & 2032
- Table 117: Global GigE Camera Industry Revenue Million Forecast, by Colour Sensor Type 2019 & 2032
- Table 118: Global GigE Camera Industry Volume K Unit Forecast, by Colour Sensor Type 2019 & 2032
- Table 119: Global GigE Camera Industry Revenue Million Forecast, by End-user Vertical 2019 & 2032
- Table 120: Global GigE Camera Industry Volume K Unit Forecast, by End-user Vertical 2019 & 2032
- Table 121: Global GigE Camera Industry Revenue Million Forecast, by Country 2019 & 2032
- Table 122: Global GigE Camera Industry Volume K Unit Forecast, by Country 2019 & 2032
- Table 123: Global GigE Camera Industry Revenue Million Forecast, by Technology 2019 & 2032
- Table 124: Global GigE Camera Industry Volume K Unit Forecast, by Technology 2019 & 2032
- Table 125: Global GigE Camera Industry Revenue Million Forecast, by Type 2019 & 2032
- Table 126: Global GigE Camera Industry Volume K Unit Forecast, by Type 2019 & 2032
- Table 127: Global GigE Camera Industry Revenue Million Forecast, by Colour Sensor Type 2019 & 2032
- Table 128: Global GigE Camera Industry Volume K Unit Forecast, by Colour Sensor Type 2019 & 2032
- Table 129: Global GigE Camera Industry Revenue Million Forecast, by End-user Vertical 2019 & 2032
- Table 130: Global GigE Camera Industry Volume K Unit Forecast, by End-user Vertical 2019 & 2032
- Table 131: Global GigE Camera Industry Revenue Million Forecast, by Country 2019 & 2032
- Table 132: Global GigE Camera Industry Volume K Unit Forecast, by Country 2019 & 2032
- Table 133: Global GigE Camera Industry Revenue Million Forecast, by Technology 2019 & 2032
- Table 134: Global GigE Camera Industry Volume K Unit Forecast, by Technology 2019 & 2032
- Table 135: Global GigE Camera Industry Revenue Million Forecast, by Type 2019 & 2032
- Table 136: Global GigE Camera Industry Volume K Unit Forecast, by Type 2019 & 2032
- Table 137: Global GigE Camera Industry Revenue Million Forecast, by Colour Sensor Type 2019 & 2032
- Table 138: Global GigE Camera Industry Volume K Unit Forecast, by Colour Sensor Type 2019 & 2032
- Table 139: Global GigE Camera Industry Revenue Million Forecast, by End-user Vertical 2019 & 2032
- Table 140: Global GigE Camera Industry Volume K Unit Forecast, by End-user Vertical 2019 & 2032
- Table 141: Global GigE Camera Industry Revenue Million Forecast, by Country 2019 & 2032
- Table 142: Global GigE Camera Industry Volume K Unit Forecast, by Country 2019 & 2032
- Table 143: Global GigE Camera Industry Revenue Million Forecast, by Technology 2019 & 2032
- Table 144: Global GigE Camera Industry Volume K Unit Forecast, by Technology 2019 & 2032
- Table 145: Global GigE Camera Industry Revenue Million Forecast, by Type 2019 & 2032
- Table 146: Global GigE Camera Industry Volume K Unit Forecast, by Type 2019 & 2032
- Table 147: Global GigE Camera Industry Revenue Million Forecast, by Colour Sensor Type 2019 & 2032
- Table 148: Global GigE Camera Industry Volume K Unit Forecast, by Colour Sensor Type 2019 & 2032
- Table 149: Global GigE Camera Industry Revenue Million Forecast, by End-user Vertical 2019 & 2032
- Table 150: Global GigE Camera Industry Volume K Unit Forecast, by End-user Vertical 2019 & 2032
- Table 151: Global GigE Camera Industry Revenue Million Forecast, by Country 2019 & 2032
- Table 152: Global GigE Camera Industry Volume K Unit Forecast, by Country 2019 & 2032
Frequently Asked Questions
1. What is the projected Compound Annual Growth Rate (CAGR) of the GigE Camera Industry?
The projected CAGR is approximately 13.60%.
2. Which companies are prominent players in the GigE Camera Industry?
Key companies in the market include Imperx Incorporated, Teledyne DALSA Inc, Matrox Graphics Inc, Baumer Holding AG, Allied Vision Technologies GmbH, Pleora Technologies Inc, FLIR Integrated Imaging Solutions Inc, JAI A/S, Sensor Technologies America Inc , Basler AG, Sony Corporation, Toshiba Teli Corporation Ltd.
3. What are the main segments of the GigE Camera Industry?
The market segments include Technology, Type, Colour Sensor Type, End-user Vertical.
4. Can you provide details about the market size?
The market size is estimated to be USD XX Million as of 2022.
5. What are some drivers contributing to market growth?
; Efficient Data Transfer Coupled with Faster Transfer Rate; Ability to Connect with Numerous Devices.
6. What are the notable trends driving market growth?
Traffic. Security & Surveillance Segment to Grow Significantly.
7. Are there any restraints impacting market growth?
; Universal Drivers needed for Interoperability; Excessive Load on the CPU.
8. Can you provide examples of recent developments in the market?
N/A
9. What pricing options are available for accessing the report?
Pricing options include single-user, multi-user, and enterprise licenses priced at USD 4750, USD 5250, and USD 8750 respectively.
10. Is the market size provided in terms of value or volume?
The market size is provided in terms of value, measured in Million and volume, measured in K Unit.
11. Are there any specific market keywords associated with the report?
Yes, the market keyword associated with the report is "GigE Camera Industry," which aids in identifying and referencing the specific market segment covered.
12. How do I determine which pricing option suits my needs best?
The pricing options vary based on user requirements and access needs. Individual users may opt for single-user licenses, while businesses requiring broader access may choose multi-user or enterprise licenses for cost-effective access to the report.
13. Are there any additional resources or data provided in the GigE Camera Industry report?
While the report offers comprehensive insights, it's advisable to review the specific contents or supplementary materials provided to ascertain if additional resources or data are available.
14. How can I stay updated on further developments or reports in the GigE Camera Industry?
To stay informed about further developments, trends, and reports in the GigE Camera Industry, consider subscribing to industry newsletters, following relevant companies and organizations, or regularly checking reputable industry news sources and publications.
Methodology
Step 1 - Identification of Relevant Samples Size from Population Database


Step 2 - Approaches for Defining Global Market Size (Value, Volume* & Price*)

Note*: In applicable scenarios
Step 3 - Data Sources
Primary Research
- Web Analytics
- Survey Reports
- Research Institute
- Latest Research Reports
- Opinion Leaders
Secondary Research
- Annual Reports
- White Paper
- Latest Press Release
- Industry Association
- Paid Database
- Investor Presentations

Step 4 - Data Triangulation
Involves using different sources of information in order to increase the validity of a study
These sources are likely to be stakeholders in a program - participants, other researchers, program staff, other community members, and so on.
Then we put all data in single framework & apply various statistical tools to find out the dynamic on the market.
During the analysis stage, feedback from the stakeholder groups would be compared to determine areas of agreement as well as areas of divergence


