
Key Insights
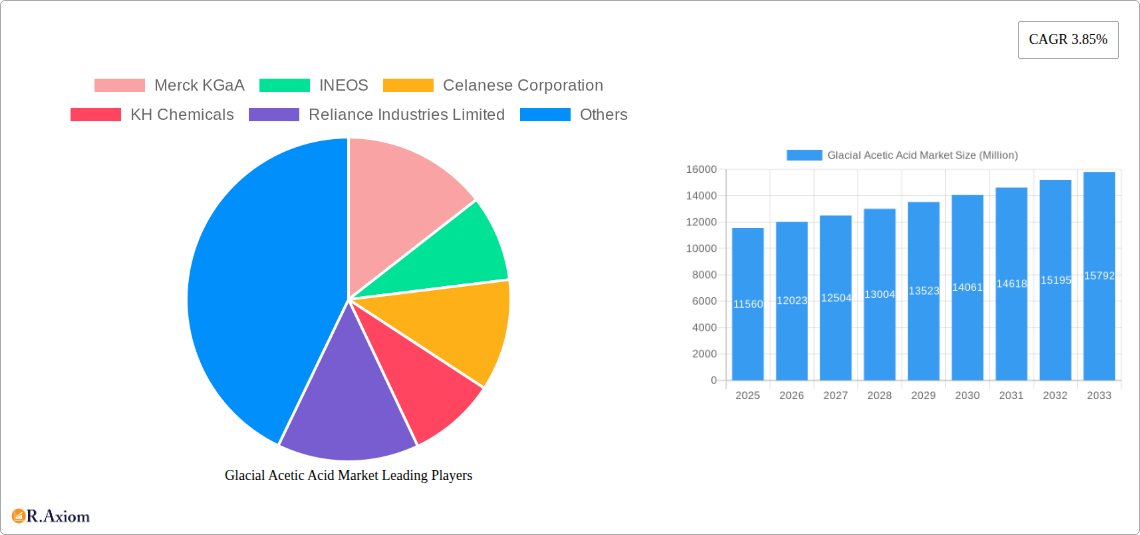
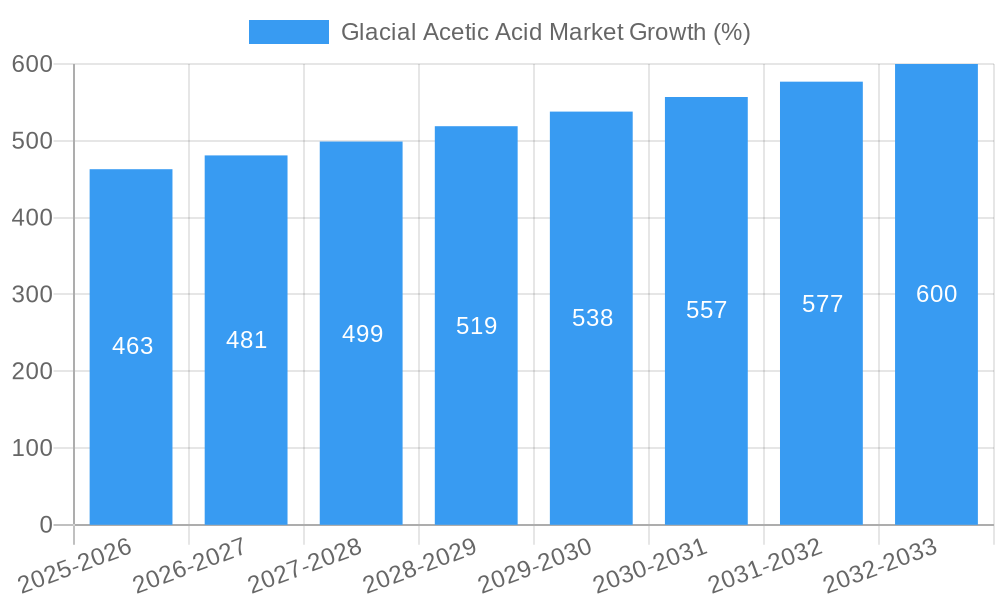
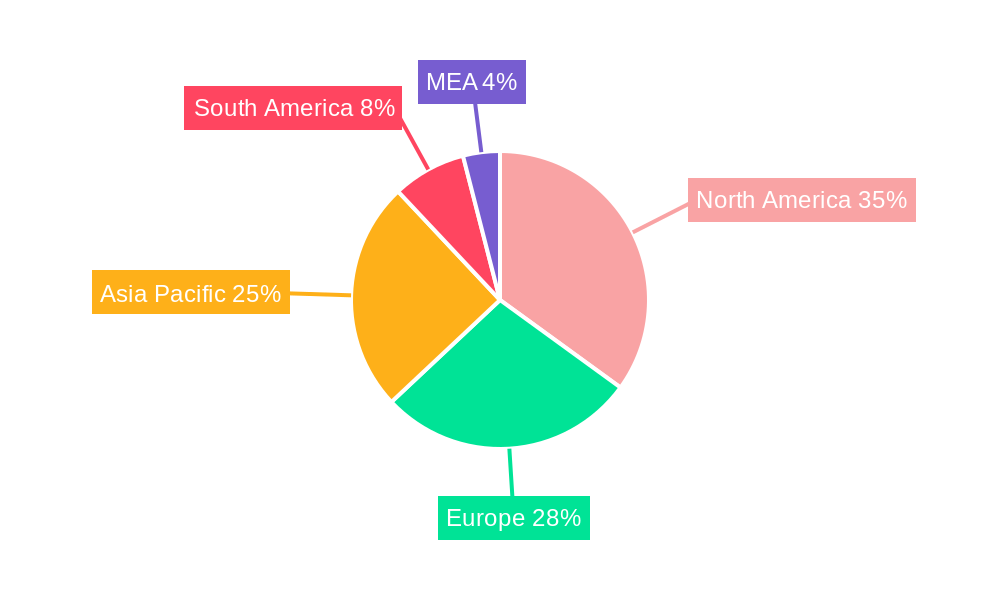
The global glacial acetic acid market, valued at $11,560 million in 2025, is projected to experience steady growth, driven by its diverse applications across various industries. A Compound Annual Growth Rate (CAGR) of 3.85% from 2025 to 2033 indicates a robust market outlook. Key drivers include the increasing demand for vinyl acetate monomer (VAM) in the adhesives and coatings sector, the expanding use of acetic acid as a solvent in chemical processes, and its role as a crucial precursor in the production of numerous chemicals, including acetic anhydride and esters. The food and pharmaceutical industries also contribute significantly to market demand, utilizing glacial acetic acid as a food preservative and in various pharmaceutical syntheses. Growth is further fueled by technological advancements leading to improved production efficiency and cost reduction. However, stringent environmental regulations concerning acetic acid emissions and potential fluctuations in raw material prices pose challenges to market expansion. The market is segmented by grade (food, industrial, pharmaceutical) and application (VAM, ester production, acetic anhydride, solvent, food additive, textile, and others), with the VAM segment holding a considerable market share. Regional analysis suggests North America and Asia-Pacific as dominant players, driven by strong industrial activity and substantial production capacities within these regions.
The competitive landscape is characterized by a mix of established multinational companies and regional players. Major players like Merck KGaA, INEOS, Celanese Corporation, and others, contribute to the market’s competitiveness through continuous innovation and expansion strategies. The increasing focus on sustainable practices and the demand for high-purity glacial acetic acid will shape future market dynamics. Furthermore, the growing emphasis on bio-based acetic acid production contributes to the overall sustainable development of the market. The forecast period (2025-2033) anticipates continued growth, driven by the factors mentioned above, although potential economic slowdowns or shifts in regulatory frameworks could influence the overall trajectory. Specific regional growth rates may vary based on economic development and industrial growth within each area.
Glacial Acetic Acid Market: A Comprehensive Report (2019-2033)
This comprehensive report provides an in-depth analysis of the Glacial Acetic Acid market, covering market size, growth drivers, competitive landscape, and future outlook. The study period spans from 2019 to 2033, with 2025 serving as the base and estimated year. The forecast period is 2025-2033, and the historical period is 2019-2024. This report is crucial for industry stakeholders, investors, and market entrants seeking a clear understanding of this dynamic market.
Glacial Acetic Acid Market Concentration & Innovation
The Glacial Acetic Acid market exhibits a moderately concentrated landscape, with a few key players holding significant market share. While precise market share data for each company is proprietary and unavailable for public disclosure, analysis suggests that Merck KGaA, INEOS, Celanese Corporation, and Eastman Chemical Company are among the leading players, commanding a substantial portion of the global market. The market is characterized by ongoing innovation focused on improving production efficiency, reducing environmental impact, and developing specialized grades for niche applications. Mergers and acquisitions (M&A) activity has been moderate in recent years, with deal values averaging around xx Million annually. The regulatory landscape varies across regions, influencing production costs and market access. Product substitution is limited due to acetic acid's unique properties, although bio-based alternatives are emerging as a potential challenge. End-user trends are driving demand growth across several sectors, including the chemical industry, food processing, and pharmaceuticals.
- Key Players: Merck KGaA, INEOS, Celanese Corporation, Eastman Chemical Company, and others.
- Innovation Drivers: Improved production efficiency, sustainable production methods, specialized grades.
- Regulatory Framework: Varies by region, impacting production costs and market access.
- M&A Activity: Moderate activity with average annual deal values around xx Million.
Glacial Acetic Acid Market Industry Trends & Insights
The Glacial Acetic Acid market is projected to experience a Compound Annual Growth Rate (CAGR) of xx% during the forecast period (2025-2033), driven by increasing demand from various industries. Significant growth is anticipated in regions with robust chemical manufacturing sectors and expanding infrastructure. Technological disruptions, such as advancements in fermentation and bio-based production technologies, are expected to gradually reshape the industry. Consumer preferences for environmentally friendly products are also influencing market dynamics, increasing the focus on sustainable production methods. Competitive dynamics are characterized by price competition, product differentiation, and strategic alliances. Market penetration of Glacial Acetic Acid in new applications, such as biodegradable plastics and green solvents, presents significant opportunities for growth. The market penetration rate for Glacial Acetic Acid in emerging economies is estimated to be xx% in 2025 and expected to reach xx% by 2033.
Dominant Markets & Segments in Glacial Acetic Acid Market
The Industrial grade segment currently dominates the Glacial Acetic Acid market, driven by extensive use in the production of vinyl acetate monomer (VAM). Geographically, Asia-Pacific is the leading region, driven by strong demand from China and India. Specific countries experiencing substantial growth include China, India, and the United States.
- Key Drivers for Asia-Pacific Dominance:
- Rapid industrialization and economic growth.
- Expanding chemical and textile industries.
- Favorable government policies supporting industrial development.
- Key Drivers for Industrial Grade Dominance:
- High demand from VAM production.
- Cost-effectiveness compared to other grades.
- Wide range of applications in chemical manufacturing.
The Pharmaceutical grade segment shows promising growth potential driven by its use in pharmaceutical manufacturing. The Food grade segment benefits from its use as a food additive and preservative. The Vinyl Acetate Monomer (VAM) application segment holds a dominant position due to its widespread use in the production of polymers and adhesives.
Glacial Acetic Acid Market Product Developments
Recent product innovations focus on improving the purity and consistency of Glacial Acetic Acid to meet the stringent requirements of various industries. New applications are emerging in the green chemistry space, focusing on sustainable and biodegradable products. Companies are increasingly emphasizing cost-effective and eco-friendly manufacturing processes to gain a competitive advantage. Technological trends include the adoption of automation and advanced process control systems to optimize production efficiency. The market fit for these innovations is strong, driven by increasing demand for high-quality and sustainable products.
Report Scope & Segmentation Analysis
This report segments the Glacial Acetic Acid market by grade (Food, Industrial, Pharmaceutical) and application (Vinyl Acetate Monomer, Ester Production, Acetic Anhydride, Solvent, Food Additive, Textile, Other Applications). Each segment's growth projections, market sizes, and competitive dynamics are analyzed within the report. The Industrial grade segment displays the highest growth rate, driven by strong demand from various industries. The Vinyl Acetate Monomer application segment is the largest, owing to its extensive use in the production of polymers and adhesives. Future growth is expected across all segments, with the Pharmaceutical grade and emerging applications showing strong potential.
Key Drivers of Glacial Acetic Acid Market Growth
The Glacial Acetic Acid market is propelled by several factors, including the robust growth of downstream industries like VAM production and the increasing use of acetic acid as a solvent in various chemical processes. Government regulations promoting sustainable chemical production are also boosting the market, particularly for bio-based acetic acid. Expanding applications in diverse sectors like pharmaceuticals and food processing also contribute significantly to market growth. The increasing demand for high-purity acetic acid drives the market expansion.
Challenges in the Glacial Acetic Acid Market Sector
Fluctuations in raw material prices pose a significant challenge to manufacturers. Stringent environmental regulations can increase production costs and limit market access. Intense competition among established players and the emergence of new entrants create price pressures. Supply chain disruptions, particularly in times of global uncertainty, can impact production and market stability. The overall impact of these challenges is estimated to decrease the market growth by xx% in the next 5 years.
Emerging Opportunities in Glacial Acetic Acid Market
The growing demand for bio-based and sustainable chemicals presents significant opportunities. Expansion into new applications, such as biodegradable plastics and green solvents, offers substantial growth potential. Technological advancements in production processes, particularly those focused on improving efficiency and reducing environmental impact, will open new market avenues. The development of high-value applications in specialty chemicals and pharmaceuticals also presents promising opportunities.
Leading Players in the Glacial Acetic Acid Market
- Merck KGaA
- INEOS
- Celanese Corporation
- KH Chemicals
- Reliance Industries Limited
- Thana Acid and Chemical Company
- ASHOK ALCO-CHEM LIMITED
- SABIC
- Spectrum Chemical Manufacturing Corp
- Eastman Chemical Company
- Daicel Corporation
- Tan Hung Phu Chemical
- Shanghai Wujing Chemical Co Ltd
- ITW Reagents Division
- LyondellBasell Industries Holdings BV
- GNFC
- Akshar Enterprises
- PCCA
- Jiangsu Thorpe (Group) Co Ltd
Key Developments in Glacial Acetic Acid Market Industry
- June 2022: INEOS announced plans to build a world-scale acetic acid manufacturing facility on the Gulf Coast of the United States, initiating a feasibility study and location review. This development signifies a significant investment in the industry, potentially increasing global capacity and influencing market dynamics.
Strategic Outlook for Glacial Acetic Acid Market
The Glacial Acetic Acid market is poised for continued growth, driven by strong demand from various sectors and the emergence of new applications. Strategic investments in sustainable production technologies and expansion into new markets will be critical for success. Companies that can effectively manage supply chain risks and adapt to evolving regulatory landscapes will be well-positioned to capture market share and achieve sustainable growth. The focus on innovation and sustainability will be key determinants of future market leadership.
Glacial Acetic Acid Market Segmentation
-
1. Grade
- 1.1. Food
- 1.2. Industrial
- 1.3. Pharmaceutical
-
2. Application
- 2.1. Vinyl Acetate Monomer
- 2.2. Ester Production
- 2.3. Acetic Anhydride
- 2.4. Solvent
- 2.5. Food Additive
- 2.6. Textile
- 2.7. Other Applications
Glacial Acetic Acid Market Segmentation By Geography
-
1. Asia Pacific
- 1.1. China
- 1.2. India
- 1.3. Japan
- 1.4. South Korea
- 1.5. Rest of Asia Pacific
-
2. North America
- 2.1. United States
- 2.2. Canada
- 2.3. Mexico
-
3. Europe
- 3.1. Germany
- 3.2. United Kingdom
- 3.3. France
- 3.4. Italy
- 3.5. Rest of Europe
-
4. Rest of the World
- 4.1. South America
- 4.2. Middle East and Africa
Glacial Acetic Acid Market REPORT HIGHLIGHTS
| Aspects | Details |
|---|---|
| Study Period | 2019-2033 |
| Base Year | 2024 |
| Estimated Year | 2025 |
| Forecast Period | 2025-2033 |
| Historical Period | 2019-2024 |
| Growth Rate | CAGR of 3.85% from 2019-2033 |
| Segmentation |
|
Table of Contents
- 1. Introduction
- 1.1. Research Scope
- 1.2. Market Segmentation
- 1.3. Research Methodology
- 1.4. Definitions and Assumptions
- 2. Executive Summary
- 2.1. Introduction
- 3. Market Dynamics
- 3.1. Introduction
- 3.2. Market Drivers
- 3.2.1. Growing Demand for Vinyl Acetate Monomer; Increasing Consumption of Preservatives; Other Drivers
- 3.3. Market Restrains
- 3.3.1. Detrimental Health Hazards; Other Restraints
- 3.4. Market Trends
- 3.4.1. Vinyl Acetate Monomer to Dominate the Market
- 4. Market Factor Analysis
- 4.1. Porters Five Forces
- 4.2. Supply/Value Chain
- 4.3. PESTEL analysis
- 4.4. Market Entropy
- 4.5. Patent/Trademark Analysis
- 5. Global Glacial Acetic Acid Market Analysis, Insights and Forecast, 2019-2031
- 5.1. Market Analysis, Insights and Forecast - by Grade
- 5.1.1. Food
- 5.1.2. Industrial
- 5.1.3. Pharmaceutical
- 5.2. Market Analysis, Insights and Forecast - by Application
- 5.2.1. Vinyl Acetate Monomer
- 5.2.2. Ester Production
- 5.2.3. Acetic Anhydride
- 5.2.4. Solvent
- 5.2.5. Food Additive
- 5.2.6. Textile
- 5.2.7. Other Applications
- 5.3. Market Analysis, Insights and Forecast - by Region
- 5.3.1. Asia Pacific
- 5.3.2. North America
- 5.3.3. Europe
- 5.3.4. Rest of the World
- 5.1. Market Analysis, Insights and Forecast - by Grade
- 6. Asia Pacific Glacial Acetic Acid Market Analysis, Insights and Forecast, 2019-2031
- 6.1. Market Analysis, Insights and Forecast - by Grade
- 6.1.1. Food
- 6.1.2. Industrial
- 6.1.3. Pharmaceutical
- 6.2. Market Analysis, Insights and Forecast - by Application
- 6.2.1. Vinyl Acetate Monomer
- 6.2.2. Ester Production
- 6.2.3. Acetic Anhydride
- 6.2.4. Solvent
- 6.2.5. Food Additive
- 6.2.6. Textile
- 6.2.7. Other Applications
- 6.1. Market Analysis, Insights and Forecast - by Grade
- 7. North America Glacial Acetic Acid Market Analysis, Insights and Forecast, 2019-2031
- 7.1. Market Analysis, Insights and Forecast - by Grade
- 7.1.1. Food
- 7.1.2. Industrial
- 7.1.3. Pharmaceutical
- 7.2. Market Analysis, Insights and Forecast - by Application
- 7.2.1. Vinyl Acetate Monomer
- 7.2.2. Ester Production
- 7.2.3. Acetic Anhydride
- 7.2.4. Solvent
- 7.2.5. Food Additive
- 7.2.6. Textile
- 7.2.7. Other Applications
- 7.1. Market Analysis, Insights and Forecast - by Grade
- 8. Europe Glacial Acetic Acid Market Analysis, Insights and Forecast, 2019-2031
- 8.1. Market Analysis, Insights and Forecast - by Grade
- 8.1.1. Food
- 8.1.2. Industrial
- 8.1.3. Pharmaceutical
- 8.2. Market Analysis, Insights and Forecast - by Application
- 8.2.1. Vinyl Acetate Monomer
- 8.2.2. Ester Production
- 8.2.3. Acetic Anhydride
- 8.2.4. Solvent
- 8.2.5. Food Additive
- 8.2.6. Textile
- 8.2.7. Other Applications
- 8.1. Market Analysis, Insights and Forecast - by Grade
- 9. Rest of the World Glacial Acetic Acid Market Analysis, Insights and Forecast, 2019-2031
- 9.1. Market Analysis, Insights and Forecast - by Grade
- 9.1.1. Food
- 9.1.2. Industrial
- 9.1.3. Pharmaceutical
- 9.2. Market Analysis, Insights and Forecast - by Application
- 9.2.1. Vinyl Acetate Monomer
- 9.2.2. Ester Production
- 9.2.3. Acetic Anhydride
- 9.2.4. Solvent
- 9.2.5. Food Additive
- 9.2.6. Textile
- 9.2.7. Other Applications
- 9.1. Market Analysis, Insights and Forecast - by Grade
- 10. North America Glacial Acetic Acid Market Analysis, Insights and Forecast, 2019-2031
- 10.1. Market Analysis, Insights and Forecast - By Country/Sub-region
- 10.1.1 United States
- 10.1.2 Canada
- 10.1.3 Mexico
- 11. Europe Glacial Acetic Acid Market Analysis, Insights and Forecast, 2019-2031
- 11.1. Market Analysis, Insights and Forecast - By Country/Sub-region
- 11.1.1 Germany
- 11.1.2 United Kingdom
- 11.1.3 France
- 11.1.4 Spain
- 11.1.5 Italy
- 11.1.6 Spain
- 11.1.7 Belgium
- 11.1.8 Netherland
- 11.1.9 Nordics
- 11.1.10 Rest of Europe
- 12. Asia Pacific Glacial Acetic Acid Market Analysis, Insights and Forecast, 2019-2031
- 12.1. Market Analysis, Insights and Forecast - By Country/Sub-region
- 12.1.1 China
- 12.1.2 Japan
- 12.1.3 India
- 12.1.4 South Korea
- 12.1.5 Southeast Asia
- 12.1.6 Australia
- 12.1.7 Indonesia
- 12.1.8 Phillipes
- 12.1.9 Singapore
- 12.1.10 Thailandc
- 12.1.11 Rest of Asia Pacific
- 13. South America Glacial Acetic Acid Market Analysis, Insights and Forecast, 2019-2031
- 13.1. Market Analysis, Insights and Forecast - By Country/Sub-region
- 13.1.1 Brazil
- 13.1.2 Argentina
- 13.1.3 Peru
- 13.1.4 Chile
- 13.1.5 Colombia
- 13.1.6 Ecuador
- 13.1.7 Venezuela
- 13.1.8 Rest of South America
- 14. North America Glacial Acetic Acid Market Analysis, Insights and Forecast, 2019-2031
- 14.1. Market Analysis, Insights and Forecast - By Country/Sub-region
- 14.1.1 United States
- 14.1.2 Canada
- 14.1.3 Mexico
- 15. MEA Glacial Acetic Acid Market Analysis, Insights and Forecast, 2019-2031
- 15.1. Market Analysis, Insights and Forecast - By Country/Sub-region
- 15.1.1 United Arab Emirates
- 15.1.2 Saudi Arabia
- 15.1.3 South Africa
- 15.1.4 Rest of Middle East and Africa
- 16. Competitive Analysis
- 16.1. Global Market Share Analysis 2024
- 16.2. Company Profiles
- 16.2.1 Merck KGaA
- 16.2.1.1. Overview
- 16.2.1.2. Products
- 16.2.1.3. SWOT Analysis
- 16.2.1.4. Recent Developments
- 16.2.1.5. Financials (Based on Availability)
- 16.2.2 INEOS
- 16.2.2.1. Overview
- 16.2.2.2. Products
- 16.2.2.3. SWOT Analysis
- 16.2.2.4. Recent Developments
- 16.2.2.5. Financials (Based on Availability)
- 16.2.3 Celanese Corporation
- 16.2.3.1. Overview
- 16.2.3.2. Products
- 16.2.3.3. SWOT Analysis
- 16.2.3.4. Recent Developments
- 16.2.3.5. Financials (Based on Availability)
- 16.2.4 KH Chemicals
- 16.2.4.1. Overview
- 16.2.4.2. Products
- 16.2.4.3. SWOT Analysis
- 16.2.4.4. Recent Developments
- 16.2.4.5. Financials (Based on Availability)
- 16.2.5 Reliance Industries Limited
- 16.2.5.1. Overview
- 16.2.5.2. Products
- 16.2.5.3. SWOT Analysis
- 16.2.5.4. Recent Developments
- 16.2.5.5. Financials (Based on Availability)
- 16.2.6 Thana Acid and Chemical Company*List Not Exhaustive
- 16.2.6.1. Overview
- 16.2.6.2. Products
- 16.2.6.3. SWOT Analysis
- 16.2.6.4. Recent Developments
- 16.2.6.5. Financials (Based on Availability)
- 16.2.7 ASHOK ALCO-CHEM LIMITED
- 16.2.7.1. Overview
- 16.2.7.2. Products
- 16.2.7.3. SWOT Analysis
- 16.2.7.4. Recent Developments
- 16.2.7.5. Financials (Based on Availability)
- 16.2.8 SABIC
- 16.2.8.1. Overview
- 16.2.8.2. Products
- 16.2.8.3. SWOT Analysis
- 16.2.8.4. Recent Developments
- 16.2.8.5. Financials (Based on Availability)
- 16.2.9 Spectrum Chemical Manufacturing Corp
- 16.2.9.1. Overview
- 16.2.9.2. Products
- 16.2.9.3. SWOT Analysis
- 16.2.9.4. Recent Developments
- 16.2.9.5. Financials (Based on Availability)
- 16.2.10 Eastman Chemical Company
- 16.2.10.1. Overview
- 16.2.10.2. Products
- 16.2.10.3. SWOT Analysis
- 16.2.10.4. Recent Developments
- 16.2.10.5. Financials (Based on Availability)
- 16.2.11 Daicel Corporation
- 16.2.11.1. Overview
- 16.2.11.2. Products
- 16.2.11.3. SWOT Analysis
- 16.2.11.4. Recent Developments
- 16.2.11.5. Financials (Based on Availability)
- 16.2.12 Tan Hung Phu Chemical
- 16.2.12.1. Overview
- 16.2.12.2. Products
- 16.2.12.3. SWOT Analysis
- 16.2.12.4. Recent Developments
- 16.2.12.5. Financials (Based on Availability)
- 16.2.13 Shanghai Wujing Chemical Co Ltd
- 16.2.13.1. Overview
- 16.2.13.2. Products
- 16.2.13.3. SWOT Analysis
- 16.2.13.4. Recent Developments
- 16.2.13.5. Financials (Based on Availability)
- 16.2.14 ITW Reagents Division
- 16.2.14.1. Overview
- 16.2.14.2. Products
- 16.2.14.3. SWOT Analysis
- 16.2.14.4. Recent Developments
- 16.2.14.5. Financials (Based on Availability)
- 16.2.15 LyondellBasell Industries Holdings BV
- 16.2.15.1. Overview
- 16.2.15.2. Products
- 16.2.15.3. SWOT Analysis
- 16.2.15.4. Recent Developments
- 16.2.15.5. Financials (Based on Availability)
- 16.2.16 GNFC
- 16.2.16.1. Overview
- 16.2.16.2. Products
- 16.2.16.3. SWOT Analysis
- 16.2.16.4. Recent Developments
- 16.2.16.5. Financials (Based on Availability)
- 16.2.17 Akshar Enterprises
- 16.2.17.1. Overview
- 16.2.17.2. Products
- 16.2.17.3. SWOT Analysis
- 16.2.17.4. Recent Developments
- 16.2.17.5. Financials (Based on Availability)
- 16.2.18 PCCA
- 16.2.18.1. Overview
- 16.2.18.2. Products
- 16.2.18.3. SWOT Analysis
- 16.2.18.4. Recent Developments
- 16.2.18.5. Financials (Based on Availability)
- 16.2.19 Jiangsu Thorpe (Group) Co Ltd
- 16.2.19.1. Overview
- 16.2.19.2. Products
- 16.2.19.3. SWOT Analysis
- 16.2.19.4. Recent Developments
- 16.2.19.5. Financials (Based on Availability)
- 16.2.1 Merck KGaA
List of Figures
- Figure 1: Global Glacial Acetic Acid Market Revenue Breakdown (Million, %) by Region 2024 & 2032
- Figure 2: Global Glacial Acetic Acid Market Volume Breakdown (K Tons, %) by Region 2024 & 2032
- Figure 3: North America Glacial Acetic Acid Market Revenue (Million), by Country 2024 & 2032
- Figure 4: North America Glacial Acetic Acid Market Volume (K Tons), by Country 2024 & 2032
- Figure 5: North America Glacial Acetic Acid Market Revenue Share (%), by Country 2024 & 2032
- Figure 6: North America Glacial Acetic Acid Market Volume Share (%), by Country 2024 & 2032
- Figure 7: Europe Glacial Acetic Acid Market Revenue (Million), by Country 2024 & 2032
- Figure 8: Europe Glacial Acetic Acid Market Volume (K Tons), by Country 2024 & 2032
- Figure 9: Europe Glacial Acetic Acid Market Revenue Share (%), by Country 2024 & 2032
- Figure 10: Europe Glacial Acetic Acid Market Volume Share (%), by Country 2024 & 2032
- Figure 11: Asia Pacific Glacial Acetic Acid Market Revenue (Million), by Country 2024 & 2032
- Figure 12: Asia Pacific Glacial Acetic Acid Market Volume (K Tons), by Country 2024 & 2032
- Figure 13: Asia Pacific Glacial Acetic Acid Market Revenue Share (%), by Country 2024 & 2032
- Figure 14: Asia Pacific Glacial Acetic Acid Market Volume Share (%), by Country 2024 & 2032
- Figure 15: South America Glacial Acetic Acid Market Revenue (Million), by Country 2024 & 2032
- Figure 16: South America Glacial Acetic Acid Market Volume (K Tons), by Country 2024 & 2032
- Figure 17: South America Glacial Acetic Acid Market Revenue Share (%), by Country 2024 & 2032
- Figure 18: South America Glacial Acetic Acid Market Volume Share (%), by Country 2024 & 2032
- Figure 19: North America Glacial Acetic Acid Market Revenue (Million), by Country 2024 & 2032
- Figure 20: North America Glacial Acetic Acid Market Volume (K Tons), by Country 2024 & 2032
- Figure 21: North America Glacial Acetic Acid Market Revenue Share (%), by Country 2024 & 2032
- Figure 22: North America Glacial Acetic Acid Market Volume Share (%), by Country 2024 & 2032
- Figure 23: MEA Glacial Acetic Acid Market Revenue (Million), by Country 2024 & 2032
- Figure 24: MEA Glacial Acetic Acid Market Volume (K Tons), by Country 2024 & 2032
- Figure 25: MEA Glacial Acetic Acid Market Revenue Share (%), by Country 2024 & 2032
- Figure 26: MEA Glacial Acetic Acid Market Volume Share (%), by Country 2024 & 2032
- Figure 27: Asia Pacific Glacial Acetic Acid Market Revenue (Million), by Grade 2024 & 2032
- Figure 28: Asia Pacific Glacial Acetic Acid Market Volume (K Tons), by Grade 2024 & 2032
- Figure 29: Asia Pacific Glacial Acetic Acid Market Revenue Share (%), by Grade 2024 & 2032
- Figure 30: Asia Pacific Glacial Acetic Acid Market Volume Share (%), by Grade 2024 & 2032
- Figure 31: Asia Pacific Glacial Acetic Acid Market Revenue (Million), by Application 2024 & 2032
- Figure 32: Asia Pacific Glacial Acetic Acid Market Volume (K Tons), by Application 2024 & 2032
- Figure 33: Asia Pacific Glacial Acetic Acid Market Revenue Share (%), by Application 2024 & 2032
- Figure 34: Asia Pacific Glacial Acetic Acid Market Volume Share (%), by Application 2024 & 2032
- Figure 35: Asia Pacific Glacial Acetic Acid Market Revenue (Million), by Country 2024 & 2032
- Figure 36: Asia Pacific Glacial Acetic Acid Market Volume (K Tons), by Country 2024 & 2032
- Figure 37: Asia Pacific Glacial Acetic Acid Market Revenue Share (%), by Country 2024 & 2032
- Figure 38: Asia Pacific Glacial Acetic Acid Market Volume Share (%), by Country 2024 & 2032
- Figure 39: North America Glacial Acetic Acid Market Revenue (Million), by Grade 2024 & 2032
- Figure 40: North America Glacial Acetic Acid Market Volume (K Tons), by Grade 2024 & 2032
- Figure 41: North America Glacial Acetic Acid Market Revenue Share (%), by Grade 2024 & 2032
- Figure 42: North America Glacial Acetic Acid Market Volume Share (%), by Grade 2024 & 2032
- Figure 43: North America Glacial Acetic Acid Market Revenue (Million), by Application 2024 & 2032
- Figure 44: North America Glacial Acetic Acid Market Volume (K Tons), by Application 2024 & 2032
- Figure 45: North America Glacial Acetic Acid Market Revenue Share (%), by Application 2024 & 2032
- Figure 46: North America Glacial Acetic Acid Market Volume Share (%), by Application 2024 & 2032
- Figure 47: North America Glacial Acetic Acid Market Revenue (Million), by Country 2024 & 2032
- Figure 48: North America Glacial Acetic Acid Market Volume (K Tons), by Country 2024 & 2032
- Figure 49: North America Glacial Acetic Acid Market Revenue Share (%), by Country 2024 & 2032
- Figure 50: North America Glacial Acetic Acid Market Volume Share (%), by Country 2024 & 2032
- Figure 51: Europe Glacial Acetic Acid Market Revenue (Million), by Grade 2024 & 2032
- Figure 52: Europe Glacial Acetic Acid Market Volume (K Tons), by Grade 2024 & 2032
- Figure 53: Europe Glacial Acetic Acid Market Revenue Share (%), by Grade 2024 & 2032
- Figure 54: Europe Glacial Acetic Acid Market Volume Share (%), by Grade 2024 & 2032
- Figure 55: Europe Glacial Acetic Acid Market Revenue (Million), by Application 2024 & 2032
- Figure 56: Europe Glacial Acetic Acid Market Volume (K Tons), by Application 2024 & 2032
- Figure 57: Europe Glacial Acetic Acid Market Revenue Share (%), by Application 2024 & 2032
- Figure 58: Europe Glacial Acetic Acid Market Volume Share (%), by Application 2024 & 2032
- Figure 59: Europe Glacial Acetic Acid Market Revenue (Million), by Country 2024 & 2032
- Figure 60: Europe Glacial Acetic Acid Market Volume (K Tons), by Country 2024 & 2032
- Figure 61: Europe Glacial Acetic Acid Market Revenue Share (%), by Country 2024 & 2032
- Figure 62: Europe Glacial Acetic Acid Market Volume Share (%), by Country 2024 & 2032
- Figure 63: Rest of the World Glacial Acetic Acid Market Revenue (Million), by Grade 2024 & 2032
- Figure 64: Rest of the World Glacial Acetic Acid Market Volume (K Tons), by Grade 2024 & 2032
- Figure 65: Rest of the World Glacial Acetic Acid Market Revenue Share (%), by Grade 2024 & 2032
- Figure 66: Rest of the World Glacial Acetic Acid Market Volume Share (%), by Grade 2024 & 2032
- Figure 67: Rest of the World Glacial Acetic Acid Market Revenue (Million), by Application 2024 & 2032
- Figure 68: Rest of the World Glacial Acetic Acid Market Volume (K Tons), by Application 2024 & 2032
- Figure 69: Rest of the World Glacial Acetic Acid Market Revenue Share (%), by Application 2024 & 2032
- Figure 70: Rest of the World Glacial Acetic Acid Market Volume Share (%), by Application 2024 & 2032
- Figure 71: Rest of the World Glacial Acetic Acid Market Revenue (Million), by Country 2024 & 2032
- Figure 72: Rest of the World Glacial Acetic Acid Market Volume (K Tons), by Country 2024 & 2032
- Figure 73: Rest of the World Glacial Acetic Acid Market Revenue Share (%), by Country 2024 & 2032
- Figure 74: Rest of the World Glacial Acetic Acid Market Volume Share (%), by Country 2024 & 2032
List of Tables
- Table 1: Global Glacial Acetic Acid Market Revenue Million Forecast, by Region 2019 & 2032
- Table 2: Global Glacial Acetic Acid Market Volume K Tons Forecast, by Region 2019 & 2032
- Table 3: Global Glacial Acetic Acid Market Revenue Million Forecast, by Grade 2019 & 2032
- Table 4: Global Glacial Acetic Acid Market Volume K Tons Forecast, by Grade 2019 & 2032
- Table 5: Global Glacial Acetic Acid Market Revenue Million Forecast, by Application 2019 & 2032
- Table 6: Global Glacial Acetic Acid Market Volume K Tons Forecast, by Application 2019 & 2032
- Table 7: Global Glacial Acetic Acid Market Revenue Million Forecast, by Region 2019 & 2032
- Table 8: Global Glacial Acetic Acid Market Volume K Tons Forecast, by Region 2019 & 2032
- Table 9: Global Glacial Acetic Acid Market Revenue Million Forecast, by Country 2019 & 2032
- Table 10: Global Glacial Acetic Acid Market Volume K Tons Forecast, by Country 2019 & 2032
- Table 11: United States Glacial Acetic Acid Market Revenue (Million) Forecast, by Application 2019 & 2032
- Table 12: United States Glacial Acetic Acid Market Volume (K Tons) Forecast, by Application 2019 & 2032
- Table 13: Canada Glacial Acetic Acid Market Revenue (Million) Forecast, by Application 2019 & 2032
- Table 14: Canada Glacial Acetic Acid Market Volume (K Tons) Forecast, by Application 2019 & 2032
- Table 15: Mexico Glacial Acetic Acid Market Revenue (Million) Forecast, by Application 2019 & 2032
- Table 16: Mexico Glacial Acetic Acid Market Volume (K Tons) Forecast, by Application 2019 & 2032
- Table 17: Global Glacial Acetic Acid Market Revenue Million Forecast, by Country 2019 & 2032
- Table 18: Global Glacial Acetic Acid Market Volume K Tons Forecast, by Country 2019 & 2032
- Table 19: Germany Glacial Acetic Acid Market Revenue (Million) Forecast, by Application 2019 & 2032
- Table 20: Germany Glacial Acetic Acid Market Volume (K Tons) Forecast, by Application 2019 & 2032
- Table 21: United Kingdom Glacial Acetic Acid Market Revenue (Million) Forecast, by Application 2019 & 2032
- Table 22: United Kingdom Glacial Acetic Acid Market Volume (K Tons) Forecast, by Application 2019 & 2032
- Table 23: France Glacial Acetic Acid Market Revenue (Million) Forecast, by Application 2019 & 2032
- Table 24: France Glacial Acetic Acid Market Volume (K Tons) Forecast, by Application 2019 & 2032
- Table 25: Spain Glacial Acetic Acid Market Revenue (Million) Forecast, by Application 2019 & 2032
- Table 26: Spain Glacial Acetic Acid Market Volume (K Tons) Forecast, by Application 2019 & 2032
- Table 27: Italy Glacial Acetic Acid Market Revenue (Million) Forecast, by Application 2019 & 2032
- Table 28: Italy Glacial Acetic Acid Market Volume (K Tons) Forecast, by Application 2019 & 2032
- Table 29: Spain Glacial Acetic Acid Market Revenue (Million) Forecast, by Application 2019 & 2032
- Table 30: Spain Glacial Acetic Acid Market Volume (K Tons) Forecast, by Application 2019 & 2032
- Table 31: Belgium Glacial Acetic Acid Market Revenue (Million) Forecast, by Application 2019 & 2032
- Table 32: Belgium Glacial Acetic Acid Market Volume (K Tons) Forecast, by Application 2019 & 2032
- Table 33: Netherland Glacial Acetic Acid Market Revenue (Million) Forecast, by Application 2019 & 2032
- Table 34: Netherland Glacial Acetic Acid Market Volume (K Tons) Forecast, by Application 2019 & 2032
- Table 35: Nordics Glacial Acetic Acid Market Revenue (Million) Forecast, by Application 2019 & 2032
- Table 36: Nordics Glacial Acetic Acid Market Volume (K Tons) Forecast, by Application 2019 & 2032
- Table 37: Rest of Europe Glacial Acetic Acid Market Revenue (Million) Forecast, by Application 2019 & 2032
- Table 38: Rest of Europe Glacial Acetic Acid Market Volume (K Tons) Forecast, by Application 2019 & 2032
- Table 39: Global Glacial Acetic Acid Market Revenue Million Forecast, by Country 2019 & 2032
- Table 40: Global Glacial Acetic Acid Market Volume K Tons Forecast, by Country 2019 & 2032
- Table 41: China Glacial Acetic Acid Market Revenue (Million) Forecast, by Application 2019 & 2032
- Table 42: China Glacial Acetic Acid Market Volume (K Tons) Forecast, by Application 2019 & 2032
- Table 43: Japan Glacial Acetic Acid Market Revenue (Million) Forecast, by Application 2019 & 2032
- Table 44: Japan Glacial Acetic Acid Market Volume (K Tons) Forecast, by Application 2019 & 2032
- Table 45: India Glacial Acetic Acid Market Revenue (Million) Forecast, by Application 2019 & 2032
- Table 46: India Glacial Acetic Acid Market Volume (K Tons) Forecast, by Application 2019 & 2032
- Table 47: South Korea Glacial Acetic Acid Market Revenue (Million) Forecast, by Application 2019 & 2032
- Table 48: South Korea Glacial Acetic Acid Market Volume (K Tons) Forecast, by Application 2019 & 2032
- Table 49: Southeast Asia Glacial Acetic Acid Market Revenue (Million) Forecast, by Application 2019 & 2032
- Table 50: Southeast Asia Glacial Acetic Acid Market Volume (K Tons) Forecast, by Application 2019 & 2032
- Table 51: Australia Glacial Acetic Acid Market Revenue (Million) Forecast, by Application 2019 & 2032
- Table 52: Australia Glacial Acetic Acid Market Volume (K Tons) Forecast, by Application 2019 & 2032
- Table 53: Indonesia Glacial Acetic Acid Market Revenue (Million) Forecast, by Application 2019 & 2032
- Table 54: Indonesia Glacial Acetic Acid Market Volume (K Tons) Forecast, by Application 2019 & 2032
- Table 55: Phillipes Glacial Acetic Acid Market Revenue (Million) Forecast, by Application 2019 & 2032
- Table 56: Phillipes Glacial Acetic Acid Market Volume (K Tons) Forecast, by Application 2019 & 2032
- Table 57: Singapore Glacial Acetic Acid Market Revenue (Million) Forecast, by Application 2019 & 2032
- Table 58: Singapore Glacial Acetic Acid Market Volume (K Tons) Forecast, by Application 2019 & 2032
- Table 59: Thailandc Glacial Acetic Acid Market Revenue (Million) Forecast, by Application 2019 & 2032
- Table 60: Thailandc Glacial Acetic Acid Market Volume (K Tons) Forecast, by Application 2019 & 2032
- Table 61: Rest of Asia Pacific Glacial Acetic Acid Market Revenue (Million) Forecast, by Application 2019 & 2032
- Table 62: Rest of Asia Pacific Glacial Acetic Acid Market Volume (K Tons) Forecast, by Application 2019 & 2032
- Table 63: Global Glacial Acetic Acid Market Revenue Million Forecast, by Country 2019 & 2032
- Table 64: Global Glacial Acetic Acid Market Volume K Tons Forecast, by Country 2019 & 2032
- Table 65: Brazil Glacial Acetic Acid Market Revenue (Million) Forecast, by Application 2019 & 2032
- Table 66: Brazil Glacial Acetic Acid Market Volume (K Tons) Forecast, by Application 2019 & 2032
- Table 67: Argentina Glacial Acetic Acid Market Revenue (Million) Forecast, by Application 2019 & 2032
- Table 68: Argentina Glacial Acetic Acid Market Volume (K Tons) Forecast, by Application 2019 & 2032
- Table 69: Peru Glacial Acetic Acid Market Revenue (Million) Forecast, by Application 2019 & 2032
- Table 70: Peru Glacial Acetic Acid Market Volume (K Tons) Forecast, by Application 2019 & 2032
- Table 71: Chile Glacial Acetic Acid Market Revenue (Million) Forecast, by Application 2019 & 2032
- Table 72: Chile Glacial Acetic Acid Market Volume (K Tons) Forecast, by Application 2019 & 2032
- Table 73: Colombia Glacial Acetic Acid Market Revenue (Million) Forecast, by Application 2019 & 2032
- Table 74: Colombia Glacial Acetic Acid Market Volume (K Tons) Forecast, by Application 2019 & 2032
- Table 75: Ecuador Glacial Acetic Acid Market Revenue (Million) Forecast, by Application 2019 & 2032
- Table 76: Ecuador Glacial Acetic Acid Market Volume (K Tons) Forecast, by Application 2019 & 2032
- Table 77: Venezuela Glacial Acetic Acid Market Revenue (Million) Forecast, by Application 2019 & 2032
- Table 78: Venezuela Glacial Acetic Acid Market Volume (K Tons) Forecast, by Application 2019 & 2032
- Table 79: Rest of South America Glacial Acetic Acid Market Revenue (Million) Forecast, by Application 2019 & 2032
- Table 80: Rest of South America Glacial Acetic Acid Market Volume (K Tons) Forecast, by Application 2019 & 2032
- Table 81: Global Glacial Acetic Acid Market Revenue Million Forecast, by Country 2019 & 2032
- Table 82: Global Glacial Acetic Acid Market Volume K Tons Forecast, by Country 2019 & 2032
- Table 83: United States Glacial Acetic Acid Market Revenue (Million) Forecast, by Application 2019 & 2032
- Table 84: United States Glacial Acetic Acid Market Volume (K Tons) Forecast, by Application 2019 & 2032
- Table 85: Canada Glacial Acetic Acid Market Revenue (Million) Forecast, by Application 2019 & 2032
- Table 86: Canada Glacial Acetic Acid Market Volume (K Tons) Forecast, by Application 2019 & 2032
- Table 87: Mexico Glacial Acetic Acid Market Revenue (Million) Forecast, by Application 2019 & 2032
- Table 88: Mexico Glacial Acetic Acid Market Volume (K Tons) Forecast, by Application 2019 & 2032
- Table 89: Global Glacial Acetic Acid Market Revenue Million Forecast, by Country 2019 & 2032
- Table 90: Global Glacial Acetic Acid Market Volume K Tons Forecast, by Country 2019 & 2032
- Table 91: United Arab Emirates Glacial Acetic Acid Market Revenue (Million) Forecast, by Application 2019 & 2032
- Table 92: United Arab Emirates Glacial Acetic Acid Market Volume (K Tons) Forecast, by Application 2019 & 2032
- Table 93: Saudi Arabia Glacial Acetic Acid Market Revenue (Million) Forecast, by Application 2019 & 2032
- Table 94: Saudi Arabia Glacial Acetic Acid Market Volume (K Tons) Forecast, by Application 2019 & 2032
- Table 95: South Africa Glacial Acetic Acid Market Revenue (Million) Forecast, by Application 2019 & 2032
- Table 96: South Africa Glacial Acetic Acid Market Volume (K Tons) Forecast, by Application 2019 & 2032
- Table 97: Rest of Middle East and Africa Glacial Acetic Acid Market Revenue (Million) Forecast, by Application 2019 & 2032
- Table 98: Rest of Middle East and Africa Glacial Acetic Acid Market Volume (K Tons) Forecast, by Application 2019 & 2032
- Table 99: Global Glacial Acetic Acid Market Revenue Million Forecast, by Grade 2019 & 2032
- Table 100: Global Glacial Acetic Acid Market Volume K Tons Forecast, by Grade 2019 & 2032
- Table 101: Global Glacial Acetic Acid Market Revenue Million Forecast, by Application 2019 & 2032
- Table 102: Global Glacial Acetic Acid Market Volume K Tons Forecast, by Application 2019 & 2032
- Table 103: Global Glacial Acetic Acid Market Revenue Million Forecast, by Country 2019 & 2032
- Table 104: Global Glacial Acetic Acid Market Volume K Tons Forecast, by Country 2019 & 2032
- Table 105: China Glacial Acetic Acid Market Revenue (Million) Forecast, by Application 2019 & 2032
- Table 106: China Glacial Acetic Acid Market Volume (K Tons) Forecast, by Application 2019 & 2032
- Table 107: India Glacial Acetic Acid Market Revenue (Million) Forecast, by Application 2019 & 2032
- Table 108: India Glacial Acetic Acid Market Volume (K Tons) Forecast, by Application 2019 & 2032
- Table 109: Japan Glacial Acetic Acid Market Revenue (Million) Forecast, by Application 2019 & 2032
- Table 110: Japan Glacial Acetic Acid Market Volume (K Tons) Forecast, by Application 2019 & 2032
- Table 111: South Korea Glacial Acetic Acid Market Revenue (Million) Forecast, by Application 2019 & 2032
- Table 112: South Korea Glacial Acetic Acid Market Volume (K Tons) Forecast, by Application 2019 & 2032
- Table 113: Rest of Asia Pacific Glacial Acetic Acid Market Revenue (Million) Forecast, by Application 2019 & 2032
- Table 114: Rest of Asia Pacific Glacial Acetic Acid Market Volume (K Tons) Forecast, by Application 2019 & 2032
- Table 115: Global Glacial Acetic Acid Market Revenue Million Forecast, by Grade 2019 & 2032
- Table 116: Global Glacial Acetic Acid Market Volume K Tons Forecast, by Grade 2019 & 2032
- Table 117: Global Glacial Acetic Acid Market Revenue Million Forecast, by Application 2019 & 2032
- Table 118: Global Glacial Acetic Acid Market Volume K Tons Forecast, by Application 2019 & 2032
- Table 119: Global Glacial Acetic Acid Market Revenue Million Forecast, by Country 2019 & 2032
- Table 120: Global Glacial Acetic Acid Market Volume K Tons Forecast, by Country 2019 & 2032
- Table 121: United States Glacial Acetic Acid Market Revenue (Million) Forecast, by Application 2019 & 2032
- Table 122: United States Glacial Acetic Acid Market Volume (K Tons) Forecast, by Application 2019 & 2032
- Table 123: Canada Glacial Acetic Acid Market Revenue (Million) Forecast, by Application 2019 & 2032
- Table 124: Canada Glacial Acetic Acid Market Volume (K Tons) Forecast, by Application 2019 & 2032
- Table 125: Mexico Glacial Acetic Acid Market Revenue (Million) Forecast, by Application 2019 & 2032
- Table 126: Mexico Glacial Acetic Acid Market Volume (K Tons) Forecast, by Application 2019 & 2032
- Table 127: Global Glacial Acetic Acid Market Revenue Million Forecast, by Grade 2019 & 2032
- Table 128: Global Glacial Acetic Acid Market Volume K Tons Forecast, by Grade 2019 & 2032
- Table 129: Global Glacial Acetic Acid Market Revenue Million Forecast, by Application 2019 & 2032
- Table 130: Global Glacial Acetic Acid Market Volume K Tons Forecast, by Application 2019 & 2032
- Table 131: Global Glacial Acetic Acid Market Revenue Million Forecast, by Country 2019 & 2032
- Table 132: Global Glacial Acetic Acid Market Volume K Tons Forecast, by Country 2019 & 2032
- Table 133: Germany Glacial Acetic Acid Market Revenue (Million) Forecast, by Application 2019 & 2032
- Table 134: Germany Glacial Acetic Acid Market Volume (K Tons) Forecast, by Application 2019 & 2032
- Table 135: United Kingdom Glacial Acetic Acid Market Revenue (Million) Forecast, by Application 2019 & 2032
- Table 136: United Kingdom Glacial Acetic Acid Market Volume (K Tons) Forecast, by Application 2019 & 2032
- Table 137: France Glacial Acetic Acid Market Revenue (Million) Forecast, by Application 2019 & 2032
- Table 138: France Glacial Acetic Acid Market Volume (K Tons) Forecast, by Application 2019 & 2032
- Table 139: Italy Glacial Acetic Acid Market Revenue (Million) Forecast, by Application 2019 & 2032
- Table 140: Italy Glacial Acetic Acid Market Volume (K Tons) Forecast, by Application 2019 & 2032
- Table 141: Rest of Europe Glacial Acetic Acid Market Revenue (Million) Forecast, by Application 2019 & 2032
- Table 142: Rest of Europe Glacial Acetic Acid Market Volume (K Tons) Forecast, by Application 2019 & 2032
- Table 143: Global Glacial Acetic Acid Market Revenue Million Forecast, by Grade 2019 & 2032
- Table 144: Global Glacial Acetic Acid Market Volume K Tons Forecast, by Grade 2019 & 2032
- Table 145: Global Glacial Acetic Acid Market Revenue Million Forecast, by Application 2019 & 2032
- Table 146: Global Glacial Acetic Acid Market Volume K Tons Forecast, by Application 2019 & 2032
- Table 147: Global Glacial Acetic Acid Market Revenue Million Forecast, by Country 2019 & 2032
- Table 148: Global Glacial Acetic Acid Market Volume K Tons Forecast, by Country 2019 & 2032
- Table 149: South America Glacial Acetic Acid Market Revenue (Million) Forecast, by Application 2019 & 2032
- Table 150: South America Glacial Acetic Acid Market Volume (K Tons) Forecast, by Application 2019 & 2032
- Table 151: Middle East and Africa Glacial Acetic Acid Market Revenue (Million) Forecast, by Application 2019 & 2032
- Table 152: Middle East and Africa Glacial Acetic Acid Market Volume (K Tons) Forecast, by Application 2019 & 2032
Frequently Asked Questions
1. What is the projected Compound Annual Growth Rate (CAGR) of the Glacial Acetic Acid Market?
The projected CAGR is approximately 3.85%.
2. Which companies are prominent players in the Glacial Acetic Acid Market?
Key companies in the market include Merck KGaA, INEOS, Celanese Corporation, KH Chemicals, Reliance Industries Limited, Thana Acid and Chemical Company*List Not Exhaustive, ASHOK ALCO-CHEM LIMITED, SABIC, Spectrum Chemical Manufacturing Corp, Eastman Chemical Company, Daicel Corporation, Tan Hung Phu Chemical, Shanghai Wujing Chemical Co Ltd, ITW Reagents Division, LyondellBasell Industries Holdings BV, GNFC, Akshar Enterprises, PCCA, Jiangsu Thorpe (Group) Co Ltd.
3. What are the main segments of the Glacial Acetic Acid Market?
The market segments include Grade, Application.
4. Can you provide details about the market size?
The market size is estimated to be USD 11560 Million as of 2022.
5. What are some drivers contributing to market growth?
Growing Demand for Vinyl Acetate Monomer; Increasing Consumption of Preservatives; Other Drivers.
6. What are the notable trends driving market growth?
Vinyl Acetate Monomer to Dominate the Market.
7. Are there any restraints impacting market growth?
Detrimental Health Hazards; Other Restraints.
8. Can you provide examples of recent developments in the market?
June 2022: INEOS is planning to build a world-scale acetic acid manufacturing facility on the gulf coast of the United States. The company started a feasibility study and is currently reviewing several locations for the facility.
9. What pricing options are available for accessing the report?
Pricing options include single-user, multi-user, and enterprise licenses priced at USD 4750, USD 5250, and USD 8750 respectively.
10. Is the market size provided in terms of value or volume?
The market size is provided in terms of value, measured in Million and volume, measured in K Tons.
11. Are there any specific market keywords associated with the report?
Yes, the market keyword associated with the report is "Glacial Acetic Acid Market," which aids in identifying and referencing the specific market segment covered.
12. How do I determine which pricing option suits my needs best?
The pricing options vary based on user requirements and access needs. Individual users may opt for single-user licenses, while businesses requiring broader access may choose multi-user or enterprise licenses for cost-effective access to the report.
13. Are there any additional resources or data provided in the Glacial Acetic Acid Market report?
While the report offers comprehensive insights, it's advisable to review the specific contents or supplementary materials provided to ascertain if additional resources or data are available.
14. How can I stay updated on further developments or reports in the Glacial Acetic Acid Market?
To stay informed about further developments, trends, and reports in the Glacial Acetic Acid Market, consider subscribing to industry newsletters, following relevant companies and organizations, or regularly checking reputable industry news sources and publications.
Methodology
Step 1 - Identification of Relevant Samples Size from Population Database


Step 2 - Approaches for Defining Global Market Size (Value, Volume* & Price*)

Note*: In applicable scenarios
Step 3 - Data Sources
Primary Research
- Web Analytics
- Survey Reports
- Research Institute
- Latest Research Reports
- Opinion Leaders
Secondary Research
- Annual Reports
- White Paper
- Latest Press Release
- Industry Association
- Paid Database
- Investor Presentations

Step 4 - Data Triangulation
Involves using different sources of information in order to increase the validity of a study
These sources are likely to be stakeholders in a program - participants, other researchers, program staff, other community members, and so on.
Then we put all data in single framework & apply various statistical tools to find out the dynamic on the market.
During the analysis stage, feedback from the stakeholder groups would be compared to determine areas of agreement as well as areas of divergence


