

Key Insights
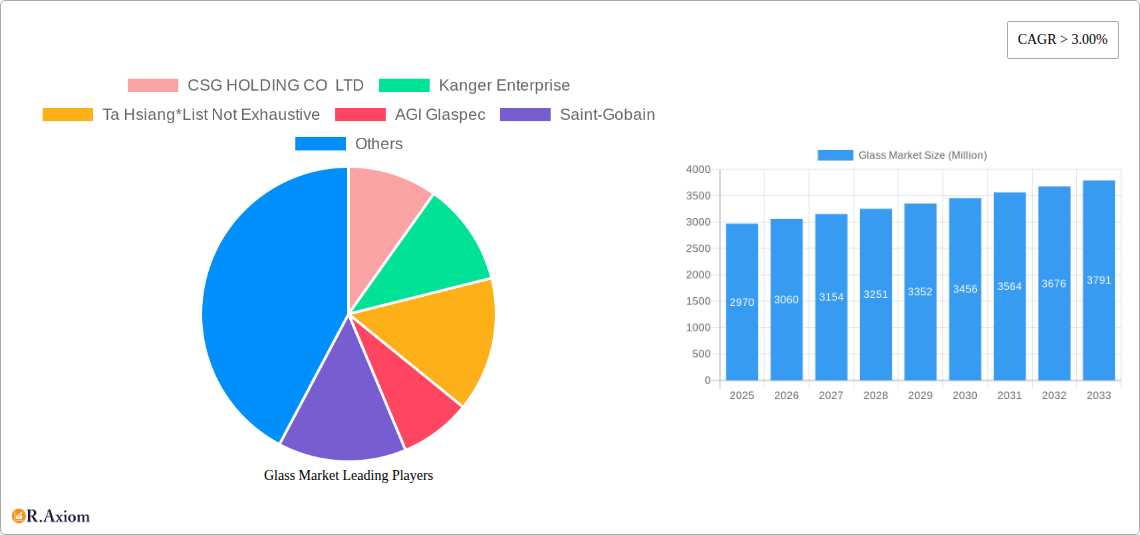
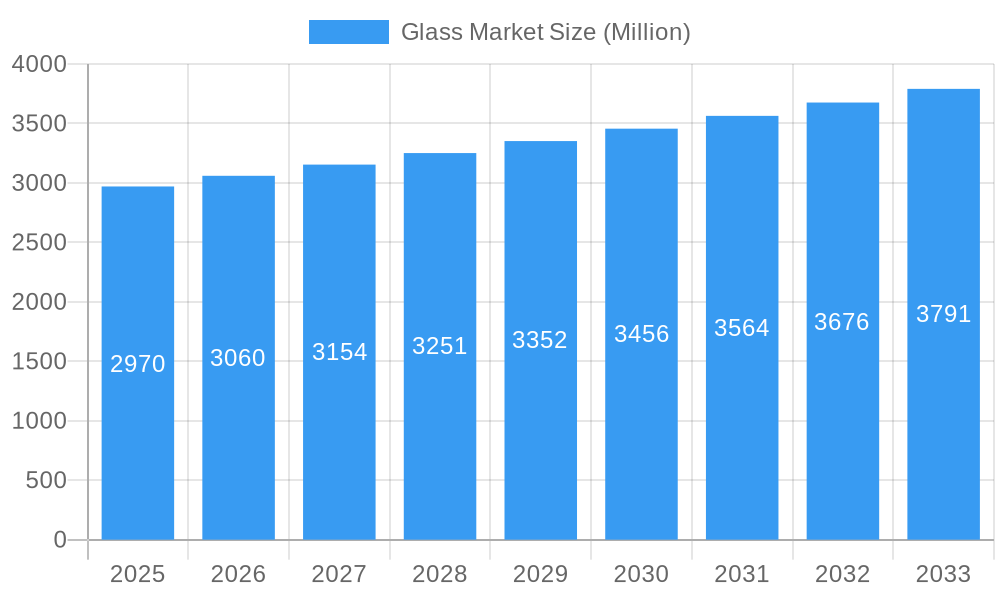
The global glass market, valued at $2.97 billion in 2025, is projected to experience robust growth, driven by a compound annual growth rate (CAGR) exceeding 3.00% from 2025 to 2033. This expansion is fueled by several key factors. The burgeoning construction and infrastructure sectors, particularly in developing economies, are significantly increasing demand for architectural glass and other specialized glass products. Simultaneously, the thriving electronics industry's need for high-quality display screens and telecommunication components is contributing substantially to market growth. Furthermore, the rising adoption of renewable energy technologies, such as solar panels, which heavily rely on glass components, is further bolstering market expansion. The increasing demand for lightweight and durable materials in automotive and aerospace applications also presents significant opportunities. Segment-wise, borosilicate and soda-lime glass dominate the market, although insulated and decorative glass segments are exhibiting faster growth rates due to their enhanced functionality and aesthetic appeal. Key players, including Corning Incorporated, AGC Inc., and Saint-Gobain, are continuously investing in R&D to develop innovative glass solutions with superior properties, which further influences market growth.
Glass Market Market Size (In Billion)
Geographic distribution reveals a strong presence across North America, Europe, and Asia-Pacific. However, rapid industrialization and urbanization in developing regions, such as Southeast Asia and South America, present lucrative growth opportunities for glass manufacturers in the coming years. While increasing raw material costs and stringent environmental regulations pose some challenges, the overall market outlook remains positive, with continued innovation and technological advancements expected to drive further market expansion. Competition within the market is intense, with both established global players and regional manufacturers vying for market share. This competitive landscape is further driven by increasing demand for specialized glass types and a focus on developing sustainable manufacturing processes. The market is therefore expected to see further consolidation in the coming years as companies seek to expand their market share and product offerings.
Glass Market Company Market Share
Glass Market: A Comprehensive Report (2019-2033)
This in-depth report provides a comprehensive analysis of the global Glass Market, offering invaluable insights for industry stakeholders, investors, and businesses seeking to navigate this dynamic sector. The study period covers 2019-2033, with a base year of 2025 and a forecast period of 2025-2033. The report leverages extensive market research and data analysis to deliver actionable intelligence and strategic recommendations. The market is valued at xx Million in 2025 and is projected to reach xx Million by 2033, exhibiting a CAGR of xx%.
Glass Market Concentration & Innovation
The Glass Market is characterized by a moderately concentrated landscape, with a few major players commanding significant market share. However, the presence of numerous smaller, specialized firms ensures a dynamic competitive environment. Innovation plays a crucial role, driven by advancements in materials science, manufacturing processes, and applications.
- Market Concentration: The top 5 players hold an estimated xx% market share in 2025, indicating a moderately consolidated market. Further analysis reveals that regional market concentration varies, with some regions showing higher levels of consolidation than others.
- Innovation Drivers: Key drivers include the development of energy-efficient glass, enhanced durability, and specialized functionalities for niche applications (e.g., self-cleaning glass, smart windows).
- Regulatory Frameworks: Environmental regulations and safety standards significantly impact the industry, driving innovation in sustainable manufacturing practices and product safety features. Variations in regional regulations further shape market dynamics.
- Product Substitutes: The market faces competition from alternative materials in specific applications. For example, plastics pose a threat to certain glass applications, while other materials are used for specialized purposes. This competition is analyzed in detail in the report.
- End-User Trends: Growing demand in construction, automotive, electronics, and renewable energy sectors are shaping the market. The increasing preference for sustainable and energy-efficient products is pushing companies to develop new solutions.
- M&A Activities: The market has witnessed several mergers and acquisitions in recent years, reflecting consolidation and strategic expansion efforts. The total value of M&A deals in the period 2019-2024 is estimated at xx Million, indicating significant consolidation within the sector.
Glass Market Industry Trends & Insights
The Glass Market is experiencing robust growth, propelled by several key factors. Technological advancements in glass production and applications are driving innovation. The increasing demand for energy-efficient buildings and electronics fuels the growth of specialized glass types, including insulated and low-emissivity glass. Consumer preferences are shifting towards sustainable and durable products, creating opportunities for eco-friendly glass solutions. The competitive landscape is dynamic, with companies investing in R&D, expanding production capacity, and adopting strategic partnerships to enhance their market positions. The report deeply analyzes these trends, providing a detailed overview of market growth drivers, technological disruptions, consumer preferences, and competitive dynamics for a comprehensive understanding of the industry's current state and future prospects. Specific metrics such as CAGR and market penetration are provided for all major segments and regions analyzed.
Dominant Markets & Segments in Glass Market
The global Glass Market is characterized by dynamic regional and segmental leadership, influenced by a confluence of economic, developmental, and technological factors. Our comprehensive analysis reveals the following key areas of dominance:
- Leading Region: The Asia-Pacific region is poised to maintain its leadership in the Glass Market through 2033. This sustained dominance is fueled by aggressive infrastructure expansion, rapid urbanization, and a robust surge in demand from the construction, automotive, and burgeoning electronics sectors. Favorable economic growth trajectories, coupled with proactive government policies supporting industrial development, are significant catalysts for the escalating demand for a diverse range of glass products in this region.
- Dominant Country: Within the expansive Asia-Pacific landscape, China is set to remain the preeminent national market. Its leadership is evident in both the scale of glass consumption and its considerable production capacity, underscoring its pivotal role in the global glass supply chain.
- Leading Type Segment: Soda-Lime Glass continues to hold its position as the largest segment, primarily owing to its cost-effectiveness and ubiquitous applications across numerous industries. However, a significant growth trajectory is observed for Borosilicate glass, driven by its increasing adoption in high-specification and specialized applications demanding superior thermal resistance and chemical inertness.
- Leading Application Segment: The construction and building industry remains the most substantial application segment for glass. This is closely followed by the rapidly evolving electronics sector and the continuously innovating automotive industry, both of which are increasingly integrating advanced glass solutions.
Key Drivers of Market Dominance:
- Economic & Policy Frameworks: Strategic government initiatives focused on stimulating infrastructure development, encouraging construction activities, and fostering technological innovation are fundamental to the market’s expansion in its leading regions.
- Global Infrastructure Boom: The ongoing construction boom across various global regions, particularly in developing economies, is a primary driver for glass demand, especially in architectural and structural applications.
- Technological Advancements: Innovations in glass manufacturing processes and the development of new glass types are continuously expanding the market's reach and application possibilities.
Our detailed market analysis offers an in-depth exploration of the underlying factors contributing to the leadership positions of these regions, countries, and specific market segments. This granular insight is crucial for understanding the present landscape and forecasting future market dynamics.
Glass Market Product Developments
The realm of glass product development is currently experiencing a wave of innovation, with a pronounced emphasis on enhancing performance characteristics. Key advancements include the creation of glass with superior thermal insulation properties, self-cleaning surfaces that reduce maintenance needs, and sophisticated optical functionalities for specialized applications. Concurrently, a significant focus is being placed on sustainable production methodologies. This involves the increased incorporation of recycled materials into manufacturing processes and concerted efforts to reduce energy consumption throughout the production cycle. These forward-thinking developments directly address the escalating market demand for glass solutions that are not only energy-efficient and environmentally responsible but also deliver high levels of performance. Furthermore, the integration of smart technologies into glass products is emerging as a pivotal trend, unlocking exciting avenues for novel and intelligent applications across various sectors.
Report Scope & Segmentation Analysis
This report segments the Glass Market by Type (Borosilicate Glass, Soda-Lime Glass, Other Types – including Insulated Glass, Decorative Glass, etc.) and Application (Lighting, Ophthalmic Lenses, Display Screens, Telecommunication, Architecture, Medical Equipments, Renewable Energy, Other Applications – including Beam Splitters, Semiconductor Assemblies, etc.). Each segment's growth projections, market size, and competitive dynamics are analyzed in detail. For example, the Borosilicate glass segment is projected to experience significant growth due to its heat resistance properties driving demand in the pharmaceutical industry, while the architectural applications segment dominates the overall market size, showcasing potential opportunities for further innovation in this sector.
Key Drivers of Glass Market Growth
The robust growth trajectory of the Glass Market is propelled by a multifaceted array of influential factors. Foremost among these is the ongoing trend of increasing urbanization and the subsequent surge in infrastructure development projects worldwide. Coupled with this is the rising global imperative for energy-efficient buildings, which is driving demand for advanced glazing solutions. Technological breakthroughs in glass manufacturing processes are continuously enhancing product capabilities and opening up new applications. The expanding utility of glass across diverse industries, including the ever-evolving electronics, automotive, and the rapidly growing renewable energy sectors, further bolsters market expansion. Supportive government policies and favorable economic conditions in numerous regions around the globe act as significant accelerators for this market's continued growth.
Challenges in the Glass Market Sector
The Glass Market faces challenges, including fluctuating raw material prices, intense competition among manufacturers, stringent environmental regulations, and the potential for substitution by alternative materials. Supply chain disruptions can lead to production delays and increased costs, potentially impacting market stability. These challenges necessitate strategic planning and adaptation among market players.
Emerging Opportunities in Glass Market
The future of the Glass Market is rich with emerging opportunities, largely driven by the pursuit of advanced functionalities and sustainability. Significant potential lies in the development of novel glass materials possessing enhanced capabilities, such as self-cleaning glass that minimizes upkeep, smart windows that can dynamically adjust their opacity or energy transmission, and innovative energy-harvesting glass technologies. The escalating global demand for environmentally sustainable and eco-friendly glass products presents a substantial opportunity for manufacturers to embrace greener production methods and pioneer new sustainable technologies. Moreover, strategic expansion into new and developing markets, particularly within rapidly growing emerging economies, offers considerable untapped growth potential for forward-thinking glass companies.
Leading Players in the Glass Market Market
- CSG HOLDING CO LTD
- Kanger Enterprise
- Ta Hsiang
- AGI Glaspec
- Saint-Gobain
- DWK Life Sciences
- Cardinal Glass Industries Inc
- Fuyao Glass Industry
- Sichuan Shubo (Group) Co Ltd
- Nippon Electric Glass Co Ltd
- AGC Inc
- Gerresheimer AG
- Lino
- Corning Incorporated
- SCHOTT AG
Key Developments in Glass Market Industry
- January 2022: AGI Glaspec, a prominent player in the Indian glass industry, marked a significant expansion by inaugurating its specialty glass division. This strategic move, backed by an investment of USD 4000 Million, substantially strengthens its presence and capabilities within the high-growth specialty glass market in the Asia-Pacific region.
Strategic Outlook for Glass Market Market
The Glass Market is poised for continued growth, driven by ongoing technological advancements, increasing demand from various end-use sectors, and supportive government policies. Strategic investments in R&D, expansion of production capacities, and adoption of sustainable practices are crucial for companies to maintain a competitive edge in this dynamic market. The exploration of new applications and the development of innovative glass products will continue to shape the industry's future growth trajectory.
Glass Market Segmentation
-
1. Type
- 1.1. Borosilicate Glass
- 1.2. Soda-Lime Glass
- 1.3. Other Ty
-
2. Applications
- 2.1. Lighting
- 2.2. Ophthamalic Lenses
- 2.3. Display Screens
- 2.4. Telecommunication
- 2.5. Architecture
- 2.6. Medical Equipments
- 2.7. Renewable Energy
- 2.8. Other Ap
Glass Market Segmentation By Geography
-
1. Asia Pacific
- 1.1. China
- 1.2. India
- 1.3. Japan
- 1.4. South Korea
- 1.5. Malaysia
- 1.6. Thailand
- 1.7. Indonesia
- 1.8. Vietnam
- 1.9. Rest of Asia Pacific
-
2. North America
- 2.1. United States
- 2.2. Canada
- 2.3. Mexico
-
3. Europe
- 3.1. Germany
- 3.2. United Kingdom
- 3.3. Italy
- 3.4. France
- 3.5. Spain
- 3.6. NORDIC
- 3.7. Turkey
- 3.8. Russia
- 3.9. Rest of Europe
-
4. South America
- 4.1. Brazil
- 4.2. Argentina
- 4.3. Colombia
- 4.4. Rest of South America
-
5. Middle East and Africa
- 5.1. Saudi Arabia
- 5.2. South Africa
- 5.3. Nigeria
- 5.4. Qatar
- 5.5. Egypt
- 5.6. UAE
- 5.7. Rest of Middle East and Africa
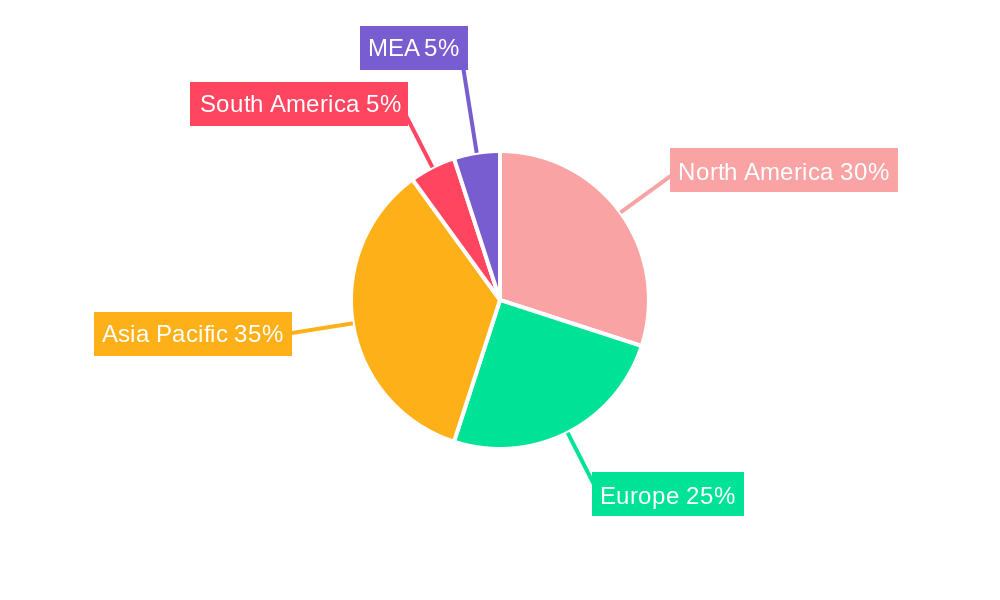
Glass Market Regional Market Share
Geographic Coverage of Glass Market
Glass Market REPORT HIGHLIGHTS
| Aspects | Details |
|---|---|
| Study Period | 2020-2034 |
| Base Year | 2025 |
| Estimated Year | 2026 |
| Forecast Period | 2026-2034 |
| Historical Period | 2020-2025 |
| Growth Rate | CAGR of > 3.00% from 2020-2034 |
| Segmentation |
|
Table of Contents
- 1. Introduction
- 1.1. Research Scope
- 1.2. Market Segmentation
- 1.3. Research Objective
- 1.4. Definitions and Assumptions
- 2. Executive Summary
- 2.1. Market Snapshot
- 3. Market Dynamics
- 3.1. Market Drivers
- 3.2. Market Restrains
- 3.3. Market Trends
- 3.4. Market Opportunities
- 4. Market Factor Analysis
- 4.1. Porters Five Forces
- 4.1.1. Bargaining Power of Suppliers
- 4.1.2. Bargaining Power of Buyers
- 4.1.3. Threat of New Entrants
- 4.1.4. Threat of Substitutes
- 4.1.5. Competitive Rivalry
- 4.2. PESTEL analysis
- 4.3. BCG Analysis
- 4.3.1. Stars (High Growth, High Market Share)
- 4.3.2. Cash Cows (Low Growth, High Market Share)
- 4.3.3. Question Mark (High Growth, Low Market Share)
- 4.3.4. Dogs (Low Growth, Low Market Share)
- 4.4. Ansoff Matrix Analysis
- 4.5. Supply Chain Analysis
- 4.6. Regulatory Landscape
- 4.7. Current Market Potential and Opportunity Assessment (TAM–SAM–SOM Framework)
- 4.8. RAX Analyst Note
- 4.1. Porters Five Forces
- 5. Market Analysis, Insights and Forecast 2021-2033
- 5.1. Market Analysis, Insights and Forecast - by Type
- 5.1.1. Borosilicate Glass
- 5.1.2. Soda-Lime Glass
- 5.1.3. Other Ty
- 5.2. Market Analysis, Insights and Forecast - by Applications
- 5.2.1. Lighting
- 5.2.2. Ophthamalic Lenses
- 5.2.3. Display Screens
- 5.2.4. Telecommunication
- 5.2.5. Architecture
- 5.2.6. Medical Equipments
- 5.2.7. Renewable Energy
- 5.2.8. Other Ap
- 5.3. Market Analysis, Insights and Forecast - by Region
- 5.3.1. Asia Pacific
- 5.3.2. North America
- 5.3.3. Europe
- 5.3.4. South America
- 5.3.5. Middle East and Africa
- 5.1. Market Analysis, Insights and Forecast - by Type
- 6. Global Glass Market Analysis, Insights and Forecast, 2021-2033
- 6.1. Market Analysis, Insights and Forecast - by Type
- 6.1.1. Borosilicate Glass
- 6.1.2. Soda-Lime Glass
- 6.1.3. Other Ty
- 6.2. Market Analysis, Insights and Forecast - by Applications
- 6.2.1. Lighting
- 6.2.2. Ophthamalic Lenses
- 6.2.3. Display Screens
- 6.2.4. Telecommunication
- 6.2.5. Architecture
- 6.2.6. Medical Equipments
- 6.2.7. Renewable Energy
- 6.2.8. Other Ap
- 6.1. Market Analysis, Insights and Forecast - by Type
- 7. Asia Pacific Glass Market Analysis, Insights and Forecast, 2020-2032
- 7.1. Market Analysis, Insights and Forecast - by Type
- 7.1.1. Borosilicate Glass
- 7.1.2. Soda-Lime Glass
- 7.1.3. Other Ty
- 7.2. Market Analysis, Insights and Forecast - by Applications
- 7.2.1. Lighting
- 7.2.2. Ophthamalic Lenses
- 7.2.3. Display Screens
- 7.2.4. Telecommunication
- 7.2.5. Architecture
- 7.2.6. Medical Equipments
- 7.2.7. Renewable Energy
- 7.2.8. Other Ap
- 7.1. Market Analysis, Insights and Forecast - by Type
- 8. North America Glass Market Analysis, Insights and Forecast, 2020-2032
- 8.1. Market Analysis, Insights and Forecast - by Type
- 8.1.1. Borosilicate Glass
- 8.1.2. Soda-Lime Glass
- 8.1.3. Other Ty
- 8.2. Market Analysis, Insights and Forecast - by Applications
- 8.2.1. Lighting
- 8.2.2. Ophthamalic Lenses
- 8.2.3. Display Screens
- 8.2.4. Telecommunication
- 8.2.5. Architecture
- 8.2.6. Medical Equipments
- 8.2.7. Renewable Energy
- 8.2.8. Other Ap
- 8.1. Market Analysis, Insights and Forecast - by Type
- 9. Europe Glass Market Analysis, Insights and Forecast, 2020-2032
- 9.1. Market Analysis, Insights and Forecast - by Type
- 9.1.1. Borosilicate Glass
- 9.1.2. Soda-Lime Glass
- 9.1.3. Other Ty
- 9.2. Market Analysis, Insights and Forecast - by Applications
- 9.2.1. Lighting
- 9.2.2. Ophthamalic Lenses
- 9.2.3. Display Screens
- 9.2.4. Telecommunication
- 9.2.5. Architecture
- 9.2.6. Medical Equipments
- 9.2.7. Renewable Energy
- 9.2.8. Other Ap
- 9.1. Market Analysis, Insights and Forecast - by Type
- 10. South America Glass Market Analysis, Insights and Forecast, 2020-2032
- 10.1. Market Analysis, Insights and Forecast - by Type
- 10.1.1. Borosilicate Glass
- 10.1.2. Soda-Lime Glass
- 10.1.3. Other Ty
- 10.2. Market Analysis, Insights and Forecast - by Applications
- 10.2.1. Lighting
- 10.2.2. Ophthamalic Lenses
- 10.2.3. Display Screens
- 10.2.4. Telecommunication
- 10.2.5. Architecture
- 10.2.6. Medical Equipments
- 10.2.7. Renewable Energy
- 10.2.8. Other Ap
- 10.1. Market Analysis, Insights and Forecast - by Type
- 11. Middle East and Africa Glass Market Analysis, Insights and Forecast, 2020-2032
- 11.1. Market Analysis, Insights and Forecast - by Type
- 11.1.1. Borosilicate Glass
- 11.1.2. Soda-Lime Glass
- 11.1.3. Other Ty
- 11.2. Market Analysis, Insights and Forecast - by Applications
- 11.2.1. Lighting
- 11.2.2. Ophthamalic Lenses
- 11.2.3. Display Screens
- 11.2.4. Telecommunication
- 11.2.5. Architecture
- 11.2.6. Medical Equipments
- 11.2.7. Renewable Energy
- 11.2.8. Other Ap
- 11.1. Market Analysis, Insights and Forecast - by Type
- 12. Competitive Analysis
- 12.1. Company Profiles
- 12.1.1 CSG HOLDING CO LTD
- 12.1.1.1. Company Overview
- 12.1.1.2. Products
- 12.1.1.3. Company Financials
- 12.1.1.4. SWOT Analysis
- 12.1.2 Kanger Enterprise
- 12.1.2.1. Company Overview
- 12.1.2.2. Products
- 12.1.2.3. Company Financials
- 12.1.2.4. SWOT Analysis
- 12.1.3 Ta Hsiang*List Not Exhaustive
- 12.1.3.1. Company Overview
- 12.1.3.2. Products
- 12.1.3.3. Company Financials
- 12.1.3.4. SWOT Analysis
- 12.1.4 AGI Glaspec
- 12.1.4.1. Company Overview
- 12.1.4.2. Products
- 12.1.4.3. Company Financials
- 12.1.4.4. SWOT Analysis
- 12.1.5 Saint-Gobain
- 12.1.5.1. Company Overview
- 12.1.5.2. Products
- 12.1.5.3. Company Financials
- 12.1.5.4. SWOT Analysis
- 12.1.6 DWK Life Sciences
- 12.1.6.1. Company Overview
- 12.1.6.2. Products
- 12.1.6.3. Company Financials
- 12.1.6.4. SWOT Analysis
- 12.1.7 Cardinal Glass Industries Inc
- 12.1.7.1. Company Overview
- 12.1.7.2. Products
- 12.1.7.3. Company Financials
- 12.1.7.4. SWOT Analysis
- 12.1.8 Fuyao Glass Industry
- 12.1.8.1. Company Overview
- 12.1.8.2. Products
- 12.1.8.3. Company Financials
- 12.1.8.4. SWOT Analysis
- 12.1.9 Sichuan Shubo (Group) Co Ltd
- 12.1.9.1. Company Overview
- 12.1.9.2. Products
- 12.1.9.3. Company Financials
- 12.1.9.4. SWOT Analysis
- 12.1.10 Nippon Electric Glass Co Ltd
- 12.1.10.1. Company Overview
- 12.1.10.2. Products
- 12.1.10.3. Company Financials
- 12.1.10.4. SWOT Analysis
- 12.1.11 AGC Inc
- 12.1.11.1. Company Overview
- 12.1.11.2. Products
- 12.1.11.3. Company Financials
- 12.1.11.4. SWOT Analysis
- 12.1.12 Gerresheimer AG
- 12.1.12.1. Company Overview
- 12.1.12.2. Products
- 12.1.12.3. Company Financials
- 12.1.12.4. SWOT Analysis
- 12.1.13 Lino
- 12.1.13.1. Company Overview
- 12.1.13.2. Products
- 12.1.13.3. Company Financials
- 12.1.13.4. SWOT Analysis
- 12.1.14 Corning Incorporated
- 12.1.14.1. Company Overview
- 12.1.14.2. Products
- 12.1.14.3. Company Financials
- 12.1.14.4. SWOT Analysis
- 12.1.15 SCHOTT AG
- 12.1.15.1. Company Overview
- 12.1.15.2. Products
- 12.1.15.3. Company Financials
- 12.1.15.4. SWOT Analysis
- 12.1.1 CSG HOLDING CO LTD
- 12.2. Market Entropy
- 12.2.1 Company's Key Areas Served
- 12.2.2 Recent Developments
- 12.3. Company Market Share Analysis 2025
- 12.3.1 Top 5 Companies Market Share Analysis
- 12.3.2 Top 3 Companies Market Share Analysis
- 12.4. List of Potential Customers
- 13. Research Methodology
List of Figures
- Figure 1: Global Glass Market Revenue Breakdown (Million, %) by Region 2025 & 2033
- Figure 2: Asia Pacific Glass Market Revenue (Million), by Type 2025 & 2033
- Figure 3: Asia Pacific Glass Market Revenue Share (%), by Type 2025 & 2033
- Figure 4: Asia Pacific Glass Market Revenue (Million), by Applications 2025 & 2033
- Figure 5: Asia Pacific Glass Market Revenue Share (%), by Applications 2025 & 2033
- Figure 6: Asia Pacific Glass Market Revenue (Million), by Country 2025 & 2033
- Figure 7: Asia Pacific Glass Market Revenue Share (%), by Country 2025 & 2033
- Figure 8: North America Glass Market Revenue (Million), by Type 2025 & 2033
- Figure 9: North America Glass Market Revenue Share (%), by Type 2025 & 2033
- Figure 10: North America Glass Market Revenue (Million), by Applications 2025 & 2033
- Figure 11: North America Glass Market Revenue Share (%), by Applications 2025 & 2033
- Figure 12: North America Glass Market Revenue (Million), by Country 2025 & 2033
- Figure 13: North America Glass Market Revenue Share (%), by Country 2025 & 2033
- Figure 14: Europe Glass Market Revenue (Million), by Type 2025 & 2033
- Figure 15: Europe Glass Market Revenue Share (%), by Type 2025 & 2033
- Figure 16: Europe Glass Market Revenue (Million), by Applications 2025 & 2033
- Figure 17: Europe Glass Market Revenue Share (%), by Applications 2025 & 2033
- Figure 18: Europe Glass Market Revenue (Million), by Country 2025 & 2033
- Figure 19: Europe Glass Market Revenue Share (%), by Country 2025 & 2033
- Figure 20: South America Glass Market Revenue (Million), by Type 2025 & 2033
- Figure 21: South America Glass Market Revenue Share (%), by Type 2025 & 2033
- Figure 22: South America Glass Market Revenue (Million), by Applications 2025 & 2033
- Figure 23: South America Glass Market Revenue Share (%), by Applications 2025 & 2033
- Figure 24: South America Glass Market Revenue (Million), by Country 2025 & 2033
- Figure 25: South America Glass Market Revenue Share (%), by Country 2025 & 2033
- Figure 26: Middle East and Africa Glass Market Revenue (Million), by Type 2025 & 2033
- Figure 27: Middle East and Africa Glass Market Revenue Share (%), by Type 2025 & 2033
- Figure 28: Middle East and Africa Glass Market Revenue (Million), by Applications 2025 & 2033
- Figure 29: Middle East and Africa Glass Market Revenue Share (%), by Applications 2025 & 2033
- Figure 30: Middle East and Africa Glass Market Revenue (Million), by Country 2025 & 2033
- Figure 31: Middle East and Africa Glass Market Revenue Share (%), by Country 2025 & 2033
List of Tables
- Table 1: Global Glass Market Revenue Million Forecast, by Type 2020 & 2033
- Table 2: Global Glass Market Revenue Million Forecast, by Applications 2020 & 2033
- Table 3: Global Glass Market Revenue Million Forecast, by Region 2020 & 2033
- Table 4: Global Glass Market Revenue Million Forecast, by Type 2020 & 2033
- Table 5: Global Glass Market Revenue Million Forecast, by Applications 2020 & 2033
- Table 6: Global Glass Market Revenue Million Forecast, by Country 2020 & 2033
- Table 7: China Glass Market Revenue (Million) Forecast, by Application 2020 & 2033
- Table 8: India Glass Market Revenue (Million) Forecast, by Application 2020 & 2033
- Table 9: Japan Glass Market Revenue (Million) Forecast, by Application 2020 & 2033
- Table 10: South Korea Glass Market Revenue (Million) Forecast, by Application 2020 & 2033
- Table 11: Malaysia Glass Market Revenue (Million) Forecast, by Application 2020 & 2033
- Table 12: Thailand Glass Market Revenue (Million) Forecast, by Application 2020 & 2033
- Table 13: Indonesia Glass Market Revenue (Million) Forecast, by Application 2020 & 2033
- Table 14: Vietnam Glass Market Revenue (Million) Forecast, by Application 2020 & 2033
- Table 15: Rest of Asia Pacific Glass Market Revenue (Million) Forecast, by Application 2020 & 2033
- Table 16: Global Glass Market Revenue Million Forecast, by Type 2020 & 2033
- Table 17: Global Glass Market Revenue Million Forecast, by Applications 2020 & 2033
- Table 18: Global Glass Market Revenue Million Forecast, by Country 2020 & 2033
- Table 19: United States Glass Market Revenue (Million) Forecast, by Application 2020 & 2033
- Table 20: Canada Glass Market Revenue (Million) Forecast, by Application 2020 & 2033
- Table 21: Mexico Glass Market Revenue (Million) Forecast, by Application 2020 & 2033
- Table 22: Global Glass Market Revenue Million Forecast, by Type 2020 & 2033
- Table 23: Global Glass Market Revenue Million Forecast, by Applications 2020 & 2033
- Table 24: Global Glass Market Revenue Million Forecast, by Country 2020 & 2033
- Table 25: Germany Glass Market Revenue (Million) Forecast, by Application 2020 & 2033
- Table 26: United Kingdom Glass Market Revenue (Million) Forecast, by Application 2020 & 2033
- Table 27: Italy Glass Market Revenue (Million) Forecast, by Application 2020 & 2033
- Table 28: France Glass Market Revenue (Million) Forecast, by Application 2020 & 2033
- Table 29: Spain Glass Market Revenue (Million) Forecast, by Application 2020 & 2033
- Table 30: NORDIC Glass Market Revenue (Million) Forecast, by Application 2020 & 2033
- Table 31: Turkey Glass Market Revenue (Million) Forecast, by Application 2020 & 2033
- Table 32: Russia Glass Market Revenue (Million) Forecast, by Application 2020 & 2033
- Table 33: Rest of Europe Glass Market Revenue (Million) Forecast, by Application 2020 & 2033
- Table 34: Global Glass Market Revenue Million Forecast, by Type 2020 & 2033
- Table 35: Global Glass Market Revenue Million Forecast, by Applications 2020 & 2033
- Table 36: Global Glass Market Revenue Million Forecast, by Country 2020 & 2033
- Table 37: Brazil Glass Market Revenue (Million) Forecast, by Application 2020 & 2033
- Table 38: Argentina Glass Market Revenue (Million) Forecast, by Application 2020 & 2033
- Table 39: Colombia Glass Market Revenue (Million) Forecast, by Application 2020 & 2033
- Table 40: Rest of South America Glass Market Revenue (Million) Forecast, by Application 2020 & 2033
- Table 41: Global Glass Market Revenue Million Forecast, by Type 2020 & 2033
- Table 42: Global Glass Market Revenue Million Forecast, by Applications 2020 & 2033
- Table 43: Global Glass Market Revenue Million Forecast, by Country 2020 & 2033
- Table 44: Saudi Arabia Glass Market Revenue (Million) Forecast, by Application 2020 & 2033
- Table 45: South Africa Glass Market Revenue (Million) Forecast, by Application 2020 & 2033
- Table 46: Nigeria Glass Market Revenue (Million) Forecast, by Application 2020 & 2033
- Table 47: Qatar Glass Market Revenue (Million) Forecast, by Application 2020 & 2033
- Table 48: Egypt Glass Market Revenue (Million) Forecast, by Application 2020 & 2033
- Table 49: UAE Glass Market Revenue (Million) Forecast, by Application 2020 & 2033
- Table 50: Rest of Middle East and Africa Glass Market Revenue (Million) Forecast, by Application 2020 & 2033
Frequently Asked Questions
1. What is the projected Compound Annual Growth Rate (CAGR) of the Glass Market?
The projected CAGR is approximately > 3.00%.
2. Which companies are prominent players in the Glass Market?
Key companies in the market include CSG HOLDING CO LTD, Kanger Enterprise, Ta Hsiang*List Not Exhaustive, AGI Glaspec, Saint-Gobain, DWK Life Sciences, Cardinal Glass Industries Inc, Fuyao Glass Industry, Sichuan Shubo (Group) Co Ltd, Nippon Electric Glass Co Ltd, AGC Inc, Gerresheimer AG, Lino, Corning Incorporated, SCHOTT AG.
3. What are the main segments of the Glass Market?
The market segments include Type, Applications.
4. Can you provide details about the market size?
The market size is estimated to be USD 2.97 Million as of 2022.
5. What are some drivers contributing to market growth?
Rising Demand for Solar Glass in the Renewable Energy and Construction Sector; Increasing Developments in Healthcare Sector; Other Drivers.
6. What are the notable trends driving market growth?
Increasing Emphasis on Utilizing Solar Glass Architecture Construction Application.
7. Are there any restraints impacting market growth?
Stringent environmental regulation regarding air and water pollution standards; Other Restraints.
8. Can you provide examples of recent developments in the market?
January 2022: AGI Glasspec of India inaugurated its specialty glass division with an investment of USD 4000 million. The investment will help the company to expand its specialty glass market in the Asia-Pacific region.
9. What pricing options are available for accessing the report?
Pricing options include single-user, multi-user, and enterprise licenses priced at USD 4750, USD 5250, and USD 8750 respectively.
10. Is the market size provided in terms of value or volume?
The market size is provided in terms of value, measured in Million.
11. Are there any specific market keywords associated with the report?
Yes, the market keyword associated with the report is "Glass Market," which aids in identifying and referencing the specific market segment covered.
12. How do I determine which pricing option suits my needs best?
The pricing options vary based on user requirements and access needs. Individual users may opt for single-user licenses, while businesses requiring broader access may choose multi-user or enterprise licenses for cost-effective access to the report.
13. Are there any additional resources or data provided in the Glass Market report?
While the report offers comprehensive insights, it's advisable to review the specific contents or supplementary materials provided to ascertain if additional resources or data are available.
14. How can I stay updated on further developments or reports in the Glass Market?
To stay informed about further developments, trends, and reports in the Glass Market, consider subscribing to industry newsletters, following relevant companies and organizations, or regularly checking reputable industry news sources and publications.
Methodology
Step 1 - Identification of Relevant Samples Size from Population Database


Step 2 - Approaches for Defining Global Market Size (Value, Volume* & Price*)

Note*: In applicable scenarios
Step 3 - Data Sources
Primary Research
- Web Analytics
- Survey Reports
- Research Institute
- Latest Research Reports
- Opinion Leaders
Secondary Research
- Annual Reports
- White Paper
- Latest Press Release
- Industry Association
- Paid Database
- Investor Presentations

Step 4 - Data Triangulation
Involves using different sources of information in order to increase the validity of a study
These sources are likely to be stakeholders in a program - participants, other researchers, program staff, other community members, and so on.
Then we put all data in single framework & apply various statistical tools to find out the dynamic on the market.
During the analysis stage, feedback from the stakeholder groups would be compared to determine areas of agreement as well as areas of divergence