

Key Insights
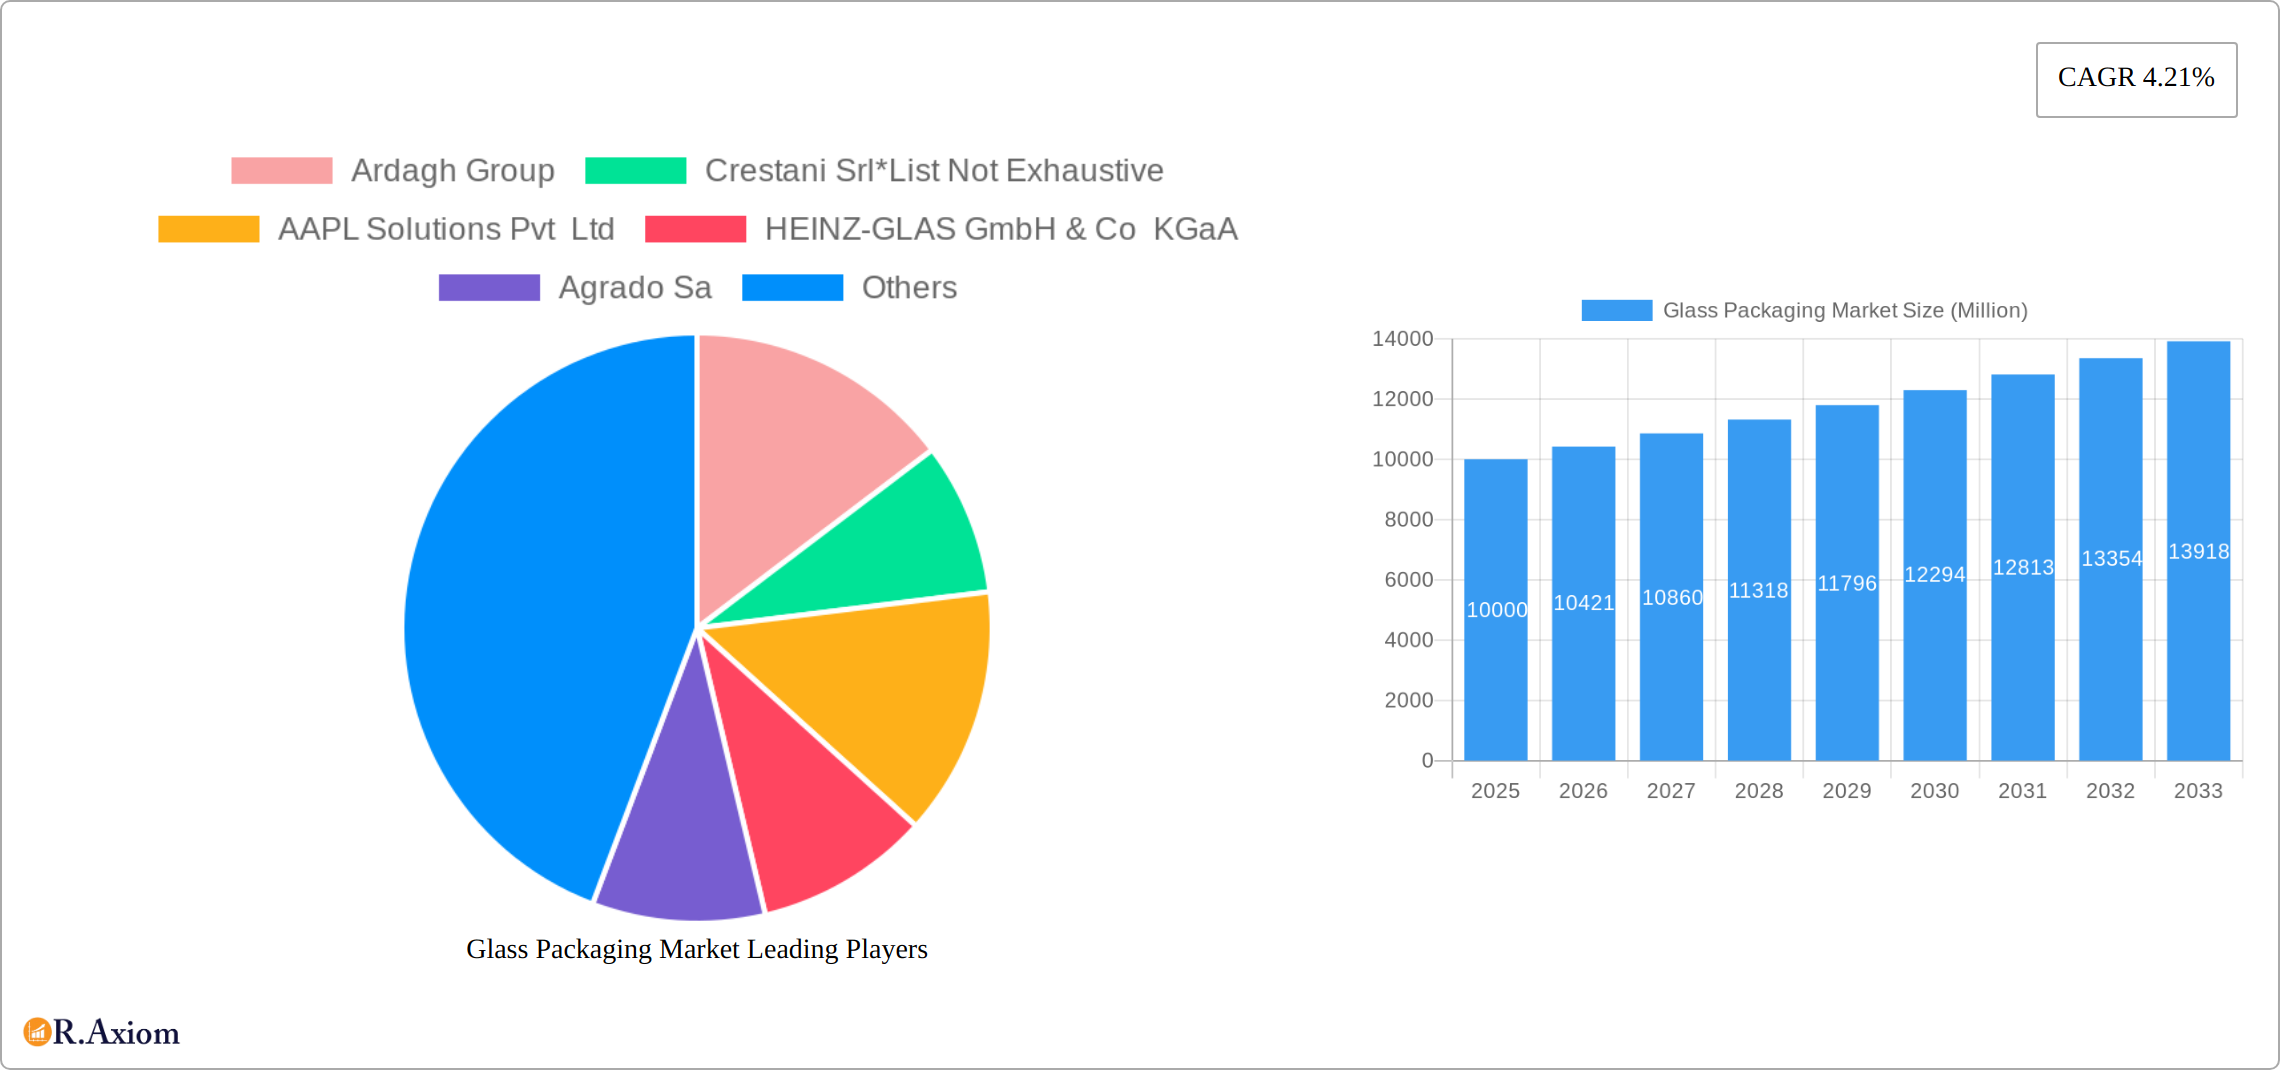
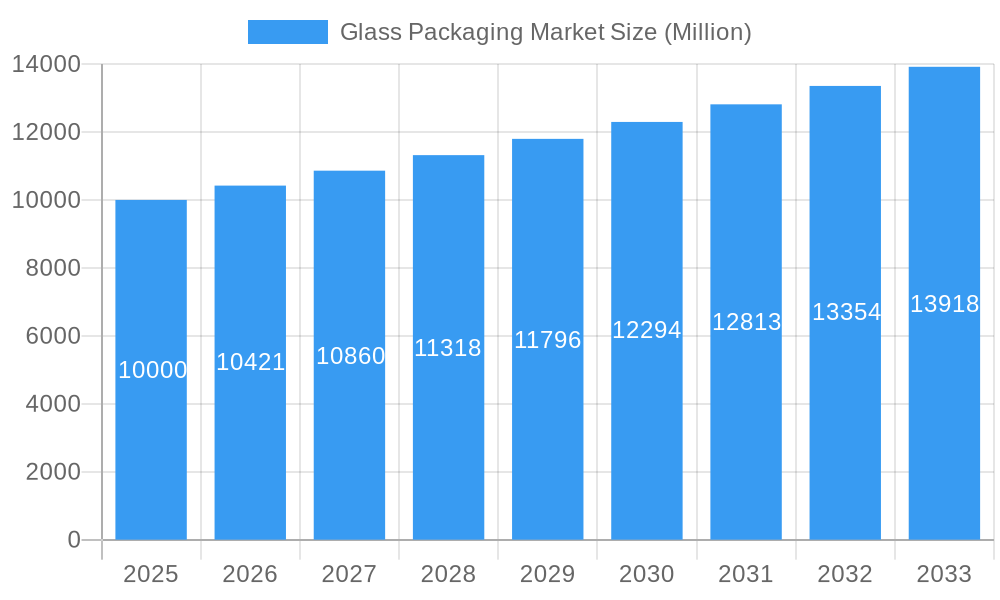
The global glass packaging market, valued at approximately 70.23 billion in 2025, is projected to experience robust growth, exhibiting a compound annual growth rate (CAGR) of 5% from 2025 to 2033. This expansion is primarily driven by the escalating demand for sustainable and eco-friendly packaging solutions, as glass's inherent recyclability and inert properties align with increasing consumer preference for environmentally responsible products. Furthermore, the growing consumption of packaged food and beverages, particularly in emerging economies, is fueling the demand for glass containers across diverse end-use sectors, including food, beverages, personal care, healthcare, and household care. Advancements in glass manufacturing technologies, enabling lighter, more durable, and aesthetically appealing packaging, also support this growth. However, challenges such as higher production and transportation costs compared to alternative materials like plastic, alongside concerns regarding breakage and weight, persist. Despite these limitations, the long-term outlook for glass packaging remains favorable due to the intensified focus on sustainability and the sustained growth of the packaged goods sector.
Glass Packaging Market Market Size (In Billion)
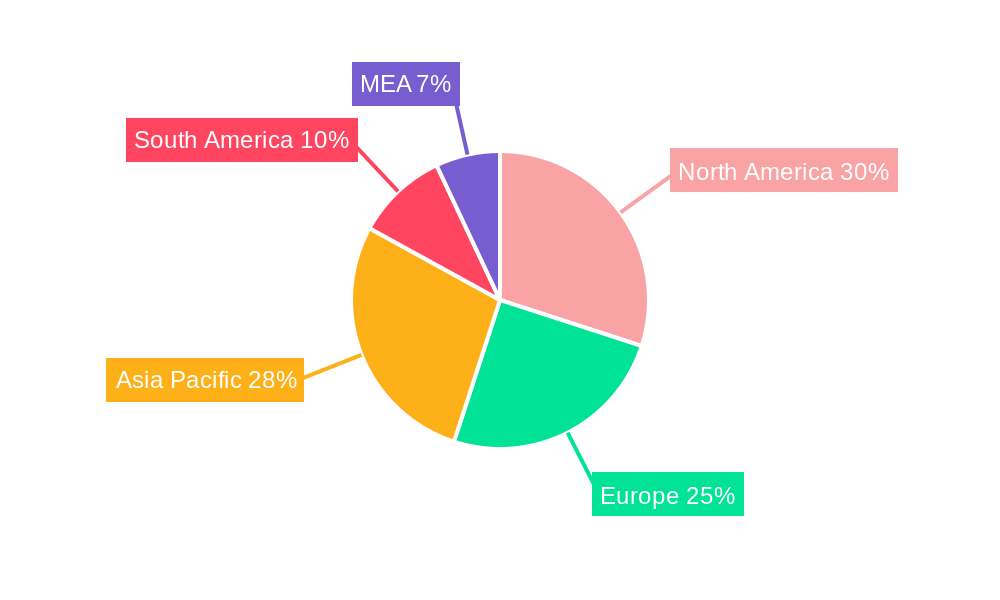
Regionally, North America and Europe currently hold significant market share, attributed to established infrastructure and robust consumer demand. Conversely, the Asia-Pacific region is anticipated to witness substantial growth, propelled by rapid economic development and rising disposable incomes, leading to increased packaged goods consumption. Key market participants, including Ardagh Group, Owens-Illinois Inc., and Gerresheimer AG, compete through technological innovation, production capacity, and global reach. The market is expected to see increased consolidation and strategic collaborations as companies aim to expand their market presence and access new technologies and distribution channels. The food and beverage packaging segment is forecast to lead growth, influenced by evolving consumer preferences and industry trends. Continued emphasis on product differentiation and premiumization further contributes to the market's positive trajectory.
Glass Packaging Market Company Market Share
This comprehensive report offers an in-depth analysis of the global glass packaging market, presenting historical data (2019-2024), current estimations (2025), and future projections (2025-2033). It delivers actionable insights for industry stakeholders, investors, and businesses seeking to understand this dynamic market. The study period encompasses 2019-2033, with 2025 serving as the base and estimated year. The report examines market concentration, innovation, industry trends, dominant segments, product developments, and key players, providing a holistic view of the glass packaging landscape. Market values are presented in billions.
Glass Packaging Market Concentration & Innovation
The glass packaging market exhibits a moderately concentrated structure, with several multinational players holding significant market share. Key players, including Ardagh Group, Owens-Illinois Inc, Gerresheimer AG, and Heinz-Glas GmbH & Co KGaA, compete fiercely, driving innovation and consolidation. Market share data indicates that the top 5 players account for approximately xx% of the global market in 2025, while smaller regional players collectively contribute the remaining xx%. Mergers and acquisitions (M&A) activity has been significant in the recent past, with deal values exceeding xx Million in the last five years. These activities reflect the strategic importance of market consolidation and geographic expansion.
- Innovation Drivers: Sustainability concerns, lightweighting initiatives, and advancements in design and manufacturing technologies are major drivers of innovation. The industry is actively developing products with reduced carbon footprints and enhanced recyclability.
- Regulatory Framework: Growing environmental regulations worldwide are shaping the market, driving demand for eco-friendly packaging solutions. Regulations related to material composition and recyclability are influencing product development and manufacturing practices.
- Product Substitutes: The market faces competition from alternative packaging materials such as plastic and metal. However, the inherent benefits of glass—its recyclability, inertness, and consumer perception—continue to support its market position.
- End-User Trends: Shifting consumer preferences toward premium and sustainable products are favoring glass packaging, particularly in the food and beverage sectors. The growing demand for convenience and on-the-go consumption is also impacting packaging design and functionality.
- M&A Activities: Recent M&A activity primarily focuses on expansion into new geographies, acquiring specialized technologies, and broadening product portfolios. Larger companies are seeking to enhance their scale and diversify their product offerings.
Glass Packaging Market Industry Trends & Insights
The global glass packaging market is projected to witness a Compound Annual Growth Rate (CAGR) of xx% during the forecast period (2025-2033). Market growth is primarily driven by the burgeoning food and beverage industry, increasing consumer preference for sustainable packaging, and technological advancements that enhance manufacturing efficiency and product design. Technological disruptions, such as the adoption of lightweighting technologies and automation in manufacturing, are contributing to enhanced productivity and reduced production costs.
The market penetration of glass packaging in various end-user industries varies significantly, with the food and beverage sector holding the largest share. Consumer preferences toward premium and environmentally responsible products are further propelling the growth. Intense competition among leading players necessitates continuous innovation in product design, manufacturing processes, and sustainability initiatives. Factors such as rising raw material costs, fluctuating energy prices, and geopolitical uncertainties, however, pose challenges to market growth.
Dominant Markets & Segments in Glass Packaging Market
The global glass packaging market is a dynamic landscape, with regional variations in market share and growth drivers. North America currently holds the largest market share, followed by Europe and the rapidly expanding Asia-Pacific region. This distribution reflects established manufacturing infrastructure, consumer preferences, and the maturity of retail sectors in these areas. However, emerging markets in Asia-Pacific are experiencing significant growth, fueled by urbanization and rising disposable incomes.
- North America: This region's dominance is propelled by strong demand for premium food and beverage products, advanced manufacturing capabilities, and a regulatory environment supportive of sustainable packaging. Consumer preference for high-quality, visually appealing packaging also plays a significant role.
- Europe: High consumer awareness of sustainability and eco-conscious choices, coupled with stringent environmental regulations and advanced recycling infrastructure, are key drivers in Europe. The region shows a strong commitment to reducing its environmental impact.
- Asia-Pacific: Rapid economic growth, increasing urbanization, and the burgeoning food and beverage sector are fueling market expansion in this region. The rising middle class is driving demand for premium goods often packaged in glass.
In terms of end-user industries, food and beverage remain the largest consumers of glass packaging, followed by personal care and healthcare. The inherent qualities of glass—its barrier protection, hygiene, and ability to preserve product integrity—make it a preferred choice for many applications.
By End-user Industry:
- Food: Glass packaging's ability to preserve freshness and enhance the perceived quality of food products makes it highly desirable for premium items such as jams, sauces, gourmet foods, and specialty oils. Its visual appeal also contributes to shelf impact.
- Beverage: The alcoholic and non-alcoholic beverage industry relies heavily on glass packaging, particularly for premium spirits, wines, and bottled water. Glass provides a premium aesthetic and protects against light and oxygen degradation.
- Personal Care: Glass packaging's aesthetic appeal, its ability to protect sensitive formulations, and its association with premium brands drives its popularity in the personal care sector. Fragrances, high-end creams, and lotions often utilize glass containers.
- Healthcare: The pharmaceutical and healthcare sectors depend on glass packaging for its inert nature, which prevents contamination and ensures product integrity. This is crucial for maintaining the efficacy and safety of medications.
- Household Care: While holding a smaller market share, glass packaging is also found in certain household care products, particularly where premium positioning or enhanced product preservation is desired. This includes some specialty cleaners and detergents.
Glass Packaging Market Product Developments
Recent product innovations focus on lightweighting designs to reduce transportation costs and environmental impact, while maintaining product integrity and functionality. The incorporation of recycled content is also a major trend, driven by environmental considerations and regulatory pressures. New designs offer enhanced aesthetic appeal and functional features, catering to the diverse needs of various end-user industries. These innovations aim to provide competitive advantages by offering sustainable and cost-effective solutions, while meeting consumer preferences for premium and environmentally responsible packaging.
Report Scope & Segmentation Analysis
This report segments the glass packaging market by end-user industry: Food, Beverage, Personal Care, Healthcare, and Household Care. Each segment's market size, growth projections, and competitive dynamics are analyzed, providing detailed insights into market performance and future trends. Growth projections vary across segments, driven by unique market drivers and consumer preferences in each area. Competitive dynamics are analyzed based on the presence of major players, market concentration, and technological advancements in each segment.
Key Drivers of Glass Packaging Market Growth
Several key factors drive the growth of the glass packaging market. Technological advancements in manufacturing processes result in increased production efficiency and cost reductions. Growing consumer awareness of sustainability and environmental concerns are boosting demand for recyclable and eco-friendly packaging. Stringent government regulations promoting the use of sustainable packaging further contribute to the growth.
Challenges in the Glass Packaging Market Sector
The glass packaging market faces challenges including high raw material costs, fluctuating energy prices, and significant transportation costs. Competition from alternative packaging materials such as plastics and metals also poses a challenge. The impact of these factors on profitability is analyzed in the report, along with strategies for mitigating these challenges.
Emerging Opportunities in Glass Packaging Market
Emerging opportunities include the growth of e-commerce and the increasing demand for premium and sustainable packaging in developing economies. Advancements in lightweighting technologies, as well as innovations in decoration techniques, offer avenues for growth. The increasing demand for customized and personalized packaging further presents opportunities for market players to expand their offerings.
Leading Players in the Glass Packaging Market Market
- Ardagh Group
- Crestani Srl
- AAPL Solutions Pvt Ltd
- HEINZ-GLAS GmbH & Co KGaA
- Agrado Sa
- WestPack LLC
- Piramal Glass Private Limited
- SGD SA (SGD Pharma)
- Hindustan National Glass & Industries Ltd
- Gerresheimer AG
- Owens-Illinois Inc
Key Developments in Glass Packaging Market Industry
- March 2024: O-I Glass launched a 75 cl bottle with a certified carbon footprint and a roadmap for carbon neutrality (Carbon Trust certification). This highlights the industry's increasing focus on sustainability.
- February 2024: Vetropack launched a returnable 0.33-liter bottle, lighter and using more recycled glass than traditional reusable bottles. This signals the growing trend towards lightweighting and increased use of recycled materials in the Austrian brewing sector.
Strategic Outlook for Glass Packaging Market Market
The glass packaging market is poised for continued growth, driven by increasing consumer demand for sustainable and premium packaging solutions. The ongoing focus on innovation, sustainability, and lightweighting will be pivotal in shaping the market's future. Companies that effectively adapt to evolving consumer preferences and regulatory landscapes will be well-positioned for success in this dynamic market.
Glass Packaging Market Segmentation
-
1. End-user Industry
- 1.1. Food
- 1.2. Beverage
- 1.3. Personal Care
- 1.4. Healthcare
- 1.5. Household Care
Glass Packaging Market Segmentation By Geography
-
1. North America
- 1.1. United States
- 1.2. Canada
-
2. Europe
- 2.1. United Kingdom
- 2.2. Germany
- 2.3. France
- 2.4. Italy
- 2.5. Spain
-
3. Asia Pacific
- 3.1. China
- 3.2. India
- 3.3. Japan
- 3.4. Australia and New Zealand
-
4. Latin America
- 4.1. Brazil
- 4.2. Mexico
- 4.3. Argentina
-
5. Middle East and Africa
- 5.1. Saudi Arabia
- 5.2. United Arab Emirates
- 5.3. South Africa
Glass Packaging Market Regional Market Share
Geographic Coverage of Glass Packaging Market
Glass Packaging Market REPORT HIGHLIGHTS
| Aspects | Details |
|---|---|
| Study Period | 2020-2034 |
| Base Year | 2025 |
| Estimated Year | 2026 |
| Forecast Period | 2026-2034 |
| Historical Period | 2020-2025 |
| Growth Rate | CAGR of 5% from 2020-2034 |
| Segmentation |
|
Table of Contents
- 1. Introduction
- 1.1. Research Scope
- 1.2. Market Segmentation
- 1.3. Research Methodology
- 1.4. Definitions and Assumptions
- 2. Executive Summary
- 2.1. Introduction
- 3. Market Dynamics
- 3.1. Introduction
- 3.2. Market Drivers
- 3.2.1. Increasing Demand for Eco-friendly Products; Increasing Demand from the Food and Beverage Industries
- 3.3. Market Restrains
- 3.3.1. Rising Operational Costs; Growing Usage of Substitute Products (Plastic)
- 3.4. Market Trends
- 3.4.1. The Beverage Industry to Hold the Highest Market Share
- 4. Market Factor Analysis
- 4.1. Porters Five Forces
- 4.2. Supply/Value Chain
- 4.3. PESTEL analysis
- 4.4. Market Entropy
- 4.5. Patent/Trademark Analysis
- 5. Global Glass Packaging Market Analysis, Insights and Forecast, 2020-2032
- 5.1. Market Analysis, Insights and Forecast - by End-user Industry
- 5.1.1. Food
- 5.1.2. Beverage
- 5.1.3. Personal Care
- 5.1.4. Healthcare
- 5.1.5. Household Care
- 5.2. Market Analysis, Insights and Forecast - by Region
- 5.2.1. North America
- 5.2.2. Europe
- 5.2.3. Asia Pacific
- 5.2.4. Latin America
- 5.2.5. Middle East and Africa
- 5.1. Market Analysis, Insights and Forecast - by End-user Industry
- 6. North America Glass Packaging Market Analysis, Insights and Forecast, 2020-2032
- 6.1. Market Analysis, Insights and Forecast - by End-user Industry
- 6.1.1. Food
- 6.1.2. Beverage
- 6.1.3. Personal Care
- 6.1.4. Healthcare
- 6.1.5. Household Care
- 6.1. Market Analysis, Insights and Forecast - by End-user Industry
- 7. Europe Glass Packaging Market Analysis, Insights and Forecast, 2020-2032
- 7.1. Market Analysis, Insights and Forecast - by End-user Industry
- 7.1.1. Food
- 7.1.2. Beverage
- 7.1.3. Personal Care
- 7.1.4. Healthcare
- 7.1.5. Household Care
- 7.1. Market Analysis, Insights and Forecast - by End-user Industry
- 8. Asia Pacific Glass Packaging Market Analysis, Insights and Forecast, 2020-2032
- 8.1. Market Analysis, Insights and Forecast - by End-user Industry
- 8.1.1. Food
- 8.1.2. Beverage
- 8.1.3. Personal Care
- 8.1.4. Healthcare
- 8.1.5. Household Care
- 8.1. Market Analysis, Insights and Forecast - by End-user Industry
- 9. Latin America Glass Packaging Market Analysis, Insights and Forecast, 2020-2032
- 9.1. Market Analysis, Insights and Forecast - by End-user Industry
- 9.1.1. Food
- 9.1.2. Beverage
- 9.1.3. Personal Care
- 9.1.4. Healthcare
- 9.1.5. Household Care
- 9.1. Market Analysis, Insights and Forecast - by End-user Industry
- 10. Middle East and Africa Glass Packaging Market Analysis, Insights and Forecast, 2020-2032
- 10.1. Market Analysis, Insights and Forecast - by End-user Industry
- 10.1.1. Food
- 10.1.2. Beverage
- 10.1.3. Personal Care
- 10.1.4. Healthcare
- 10.1.5. Household Care
- 10.1. Market Analysis, Insights and Forecast - by End-user Industry
- 11. Competitive Analysis
- 11.1. Global Market Share Analysis 2025
- 11.2. Company Profiles
- 11.2.1 Ardagh Group
- 11.2.1.1. Overview
- 11.2.1.2. Products
- 11.2.1.3. SWOT Analysis
- 11.2.1.4. Recent Developments
- 11.2.1.5. Financials (Based on Availability)
- 11.2.2 Crestani Srl*List Not Exhaustive
- 11.2.2.1. Overview
- 11.2.2.2. Products
- 11.2.2.3. SWOT Analysis
- 11.2.2.4. Recent Developments
- 11.2.2.5. Financials (Based on Availability)
- 11.2.3 AAPL Solutions Pvt Ltd
- 11.2.3.1. Overview
- 11.2.3.2. Products
- 11.2.3.3. SWOT Analysis
- 11.2.3.4. Recent Developments
- 11.2.3.5. Financials (Based on Availability)
- 11.2.4 HEINZ-GLAS GmbH & Co KGaA
- 11.2.4.1. Overview
- 11.2.4.2. Products
- 11.2.4.3. SWOT Analysis
- 11.2.4.4. Recent Developments
- 11.2.4.5. Financials (Based on Availability)
- 11.2.5 Agrado Sa
- 11.2.5.1. Overview
- 11.2.5.2. Products
- 11.2.5.3. SWOT Analysis
- 11.2.5.4. Recent Developments
- 11.2.5.5. Financials (Based on Availability)
- 11.2.6 WestPack LLC
- 11.2.6.1. Overview
- 11.2.6.2. Products
- 11.2.6.3. SWOT Analysis
- 11.2.6.4. Recent Developments
- 11.2.6.5. Financials (Based on Availability)
- 11.2.7 Piramal Glass Private Limited
- 11.2.7.1. Overview
- 11.2.7.2. Products
- 11.2.7.3. SWOT Analysis
- 11.2.7.4. Recent Developments
- 11.2.7.5. Financials (Based on Availability)
- 11.2.8 SGD SA (SGD Pharma)
- 11.2.8.1. Overview
- 11.2.8.2. Products
- 11.2.8.3. SWOT Analysis
- 11.2.8.4. Recent Developments
- 11.2.8.5. Financials (Based on Availability)
- 11.2.9 Hindustan National Glass & Industries Ltd
- 11.2.9.1. Overview
- 11.2.9.2. Products
- 11.2.9.3. SWOT Analysis
- 11.2.9.4. Recent Developments
- 11.2.9.5. Financials (Based on Availability)
- 11.2.10 Gerresheimer AG
- 11.2.10.1. Overview
- 11.2.10.2. Products
- 11.2.10.3. SWOT Analysis
- 11.2.10.4. Recent Developments
- 11.2.10.5. Financials (Based on Availability)
- 11.2.11 Owens-Illinois Inc
- 11.2.11.1. Overview
- 11.2.11.2. Products
- 11.2.11.3. SWOT Analysis
- 11.2.11.4. Recent Developments
- 11.2.11.5. Financials (Based on Availability)
- 11.2.1 Ardagh Group
List of Figures
- Figure 1: Global Glass Packaging Market Revenue Breakdown (billion, %) by Region 2025 & 2033
- Figure 2: Global Glass Packaging Market Volume Breakdown (Trillion, %) by Region 2025 & 2033
- Figure 3: North America Glass Packaging Market Revenue (billion), by End-user Industry 2025 & 2033
- Figure 4: North America Glass Packaging Market Volume (Trillion), by End-user Industry 2025 & 2033
- Figure 5: North America Glass Packaging Market Revenue Share (%), by End-user Industry 2025 & 2033
- Figure 6: North America Glass Packaging Market Volume Share (%), by End-user Industry 2025 & 2033
- Figure 7: North America Glass Packaging Market Revenue (billion), by Country 2025 & 2033
- Figure 8: North America Glass Packaging Market Volume (Trillion), by Country 2025 & 2033
- Figure 9: North America Glass Packaging Market Revenue Share (%), by Country 2025 & 2033
- Figure 10: North America Glass Packaging Market Volume Share (%), by Country 2025 & 2033
- Figure 11: Europe Glass Packaging Market Revenue (billion), by End-user Industry 2025 & 2033
- Figure 12: Europe Glass Packaging Market Volume (Trillion), by End-user Industry 2025 & 2033
- Figure 13: Europe Glass Packaging Market Revenue Share (%), by End-user Industry 2025 & 2033
- Figure 14: Europe Glass Packaging Market Volume Share (%), by End-user Industry 2025 & 2033
- Figure 15: Europe Glass Packaging Market Revenue (billion), by Country 2025 & 2033
- Figure 16: Europe Glass Packaging Market Volume (Trillion), by Country 2025 & 2033
- Figure 17: Europe Glass Packaging Market Revenue Share (%), by Country 2025 & 2033
- Figure 18: Europe Glass Packaging Market Volume Share (%), by Country 2025 & 2033
- Figure 19: Asia Pacific Glass Packaging Market Revenue (billion), by End-user Industry 2025 & 2033
- Figure 20: Asia Pacific Glass Packaging Market Volume (Trillion), by End-user Industry 2025 & 2033
- Figure 21: Asia Pacific Glass Packaging Market Revenue Share (%), by End-user Industry 2025 & 2033
- Figure 22: Asia Pacific Glass Packaging Market Volume Share (%), by End-user Industry 2025 & 2033
- Figure 23: Asia Pacific Glass Packaging Market Revenue (billion), by Country 2025 & 2033
- Figure 24: Asia Pacific Glass Packaging Market Volume (Trillion), by Country 2025 & 2033
- Figure 25: Asia Pacific Glass Packaging Market Revenue Share (%), by Country 2025 & 2033
- Figure 26: Asia Pacific Glass Packaging Market Volume Share (%), by Country 2025 & 2033
- Figure 27: Latin America Glass Packaging Market Revenue (billion), by End-user Industry 2025 & 2033
- Figure 28: Latin America Glass Packaging Market Volume (Trillion), by End-user Industry 2025 & 2033
- Figure 29: Latin America Glass Packaging Market Revenue Share (%), by End-user Industry 2025 & 2033
- Figure 30: Latin America Glass Packaging Market Volume Share (%), by End-user Industry 2025 & 2033
- Figure 31: Latin America Glass Packaging Market Revenue (billion), by Country 2025 & 2033
- Figure 32: Latin America Glass Packaging Market Volume (Trillion), by Country 2025 & 2033
- Figure 33: Latin America Glass Packaging Market Revenue Share (%), by Country 2025 & 2033
- Figure 34: Latin America Glass Packaging Market Volume Share (%), by Country 2025 & 2033
- Figure 35: Middle East and Africa Glass Packaging Market Revenue (billion), by End-user Industry 2025 & 2033
- Figure 36: Middle East and Africa Glass Packaging Market Volume (Trillion), by End-user Industry 2025 & 2033
- Figure 37: Middle East and Africa Glass Packaging Market Revenue Share (%), by End-user Industry 2025 & 2033
- Figure 38: Middle East and Africa Glass Packaging Market Volume Share (%), by End-user Industry 2025 & 2033
- Figure 39: Middle East and Africa Glass Packaging Market Revenue (billion), by Country 2025 & 2033
- Figure 40: Middle East and Africa Glass Packaging Market Volume (Trillion), by Country 2025 & 2033
- Figure 41: Middle East and Africa Glass Packaging Market Revenue Share (%), by Country 2025 & 2033
- Figure 42: Middle East and Africa Glass Packaging Market Volume Share (%), by Country 2025 & 2033
List of Tables
- Table 1: Global Glass Packaging Market Revenue billion Forecast, by End-user Industry 2020 & 2033
- Table 2: Global Glass Packaging Market Volume Trillion Forecast, by End-user Industry 2020 & 2033
- Table 3: Global Glass Packaging Market Revenue billion Forecast, by Region 2020 & 2033
- Table 4: Global Glass Packaging Market Volume Trillion Forecast, by Region 2020 & 2033
- Table 5: Global Glass Packaging Market Revenue billion Forecast, by End-user Industry 2020 & 2033
- Table 6: Global Glass Packaging Market Volume Trillion Forecast, by End-user Industry 2020 & 2033
- Table 7: Global Glass Packaging Market Revenue billion Forecast, by Country 2020 & 2033
- Table 8: Global Glass Packaging Market Volume Trillion Forecast, by Country 2020 & 2033
- Table 9: United States Glass Packaging Market Revenue (billion) Forecast, by Application 2020 & 2033
- Table 10: United States Glass Packaging Market Volume (Trillion) Forecast, by Application 2020 & 2033
- Table 11: Canada Glass Packaging Market Revenue (billion) Forecast, by Application 2020 & 2033
- Table 12: Canada Glass Packaging Market Volume (Trillion) Forecast, by Application 2020 & 2033
- Table 13: Global Glass Packaging Market Revenue billion Forecast, by End-user Industry 2020 & 2033
- Table 14: Global Glass Packaging Market Volume Trillion Forecast, by End-user Industry 2020 & 2033
- Table 15: Global Glass Packaging Market Revenue billion Forecast, by Country 2020 & 2033
- Table 16: Global Glass Packaging Market Volume Trillion Forecast, by Country 2020 & 2033
- Table 17: United Kingdom Glass Packaging Market Revenue (billion) Forecast, by Application 2020 & 2033
- Table 18: United Kingdom Glass Packaging Market Volume (Trillion) Forecast, by Application 2020 & 2033
- Table 19: Germany Glass Packaging Market Revenue (billion) Forecast, by Application 2020 & 2033
- Table 20: Germany Glass Packaging Market Volume (Trillion) Forecast, by Application 2020 & 2033
- Table 21: France Glass Packaging Market Revenue (billion) Forecast, by Application 2020 & 2033
- Table 22: France Glass Packaging Market Volume (Trillion) Forecast, by Application 2020 & 2033
- Table 23: Italy Glass Packaging Market Revenue (billion) Forecast, by Application 2020 & 2033
- Table 24: Italy Glass Packaging Market Volume (Trillion) Forecast, by Application 2020 & 2033
- Table 25: Spain Glass Packaging Market Revenue (billion) Forecast, by Application 2020 & 2033
- Table 26: Spain Glass Packaging Market Volume (Trillion) Forecast, by Application 2020 & 2033
- Table 27: Global Glass Packaging Market Revenue billion Forecast, by End-user Industry 2020 & 2033
- Table 28: Global Glass Packaging Market Volume Trillion Forecast, by End-user Industry 2020 & 2033
- Table 29: Global Glass Packaging Market Revenue billion Forecast, by Country 2020 & 2033
- Table 30: Global Glass Packaging Market Volume Trillion Forecast, by Country 2020 & 2033
- Table 31: China Glass Packaging Market Revenue (billion) Forecast, by Application 2020 & 2033
- Table 32: China Glass Packaging Market Volume (Trillion) Forecast, by Application 2020 & 2033
- Table 33: India Glass Packaging Market Revenue (billion) Forecast, by Application 2020 & 2033
- Table 34: India Glass Packaging Market Volume (Trillion) Forecast, by Application 2020 & 2033
- Table 35: Japan Glass Packaging Market Revenue (billion) Forecast, by Application 2020 & 2033
- Table 36: Japan Glass Packaging Market Volume (Trillion) Forecast, by Application 2020 & 2033
- Table 37: Australia and New Zealand Glass Packaging Market Revenue (billion) Forecast, by Application 2020 & 2033
- Table 38: Australia and New Zealand Glass Packaging Market Volume (Trillion) Forecast, by Application 2020 & 2033
- Table 39: Global Glass Packaging Market Revenue billion Forecast, by End-user Industry 2020 & 2033
- Table 40: Global Glass Packaging Market Volume Trillion Forecast, by End-user Industry 2020 & 2033
- Table 41: Global Glass Packaging Market Revenue billion Forecast, by Country 2020 & 2033
- Table 42: Global Glass Packaging Market Volume Trillion Forecast, by Country 2020 & 2033
- Table 43: Brazil Glass Packaging Market Revenue (billion) Forecast, by Application 2020 & 2033
- Table 44: Brazil Glass Packaging Market Volume (Trillion) Forecast, by Application 2020 & 2033
- Table 45: Mexico Glass Packaging Market Revenue (billion) Forecast, by Application 2020 & 2033
- Table 46: Mexico Glass Packaging Market Volume (Trillion) Forecast, by Application 2020 & 2033
- Table 47: Argentina Glass Packaging Market Revenue (billion) Forecast, by Application 2020 & 2033
- Table 48: Argentina Glass Packaging Market Volume (Trillion) Forecast, by Application 2020 & 2033
- Table 49: Global Glass Packaging Market Revenue billion Forecast, by End-user Industry 2020 & 2033
- Table 50: Global Glass Packaging Market Volume Trillion Forecast, by End-user Industry 2020 & 2033
- Table 51: Global Glass Packaging Market Revenue billion Forecast, by Country 2020 & 2033
- Table 52: Global Glass Packaging Market Volume Trillion Forecast, by Country 2020 & 2033
- Table 53: Saudi Arabia Glass Packaging Market Revenue (billion) Forecast, by Application 2020 & 2033
- Table 54: Saudi Arabia Glass Packaging Market Volume (Trillion) Forecast, by Application 2020 & 2033
- Table 55: United Arab Emirates Glass Packaging Market Revenue (billion) Forecast, by Application 2020 & 2033
- Table 56: United Arab Emirates Glass Packaging Market Volume (Trillion) Forecast, by Application 2020 & 2033
- Table 57: South Africa Glass Packaging Market Revenue (billion) Forecast, by Application 2020 & 2033
- Table 58: South Africa Glass Packaging Market Volume (Trillion) Forecast, by Application 2020 & 2033
Frequently Asked Questions
1. What is the projected Compound Annual Growth Rate (CAGR) of the Glass Packaging Market?
The projected CAGR is approximately 5%.
2. Which companies are prominent players in the Glass Packaging Market?
Key companies in the market include Ardagh Group, Crestani Srl*List Not Exhaustive, AAPL Solutions Pvt Ltd, HEINZ-GLAS GmbH & Co KGaA, Agrado Sa, WestPack LLC, Piramal Glass Private Limited, SGD SA (SGD Pharma), Hindustan National Glass & Industries Ltd, Gerresheimer AG, Owens-Illinois Inc.
3. What are the main segments of the Glass Packaging Market?
The market segments include End-user Industry.
4. Can you provide details about the market size?
The market size is estimated to be USD 70.23 billion as of 2022.
5. What are some drivers contributing to market growth?
Increasing Demand for Eco-friendly Products; Increasing Demand from the Food and Beverage Industries.
6. What are the notable trends driving market growth?
The Beverage Industry to Hold the Highest Market Share.
7. Are there any restraints impacting market growth?
Rising Operational Costs; Growing Usage of Substitute Products (Plastic).
8. Can you provide examples of recent developments in the market?
March 2024: A 75 cl bottle with a carbon footprint and approach to achieving carbon neutrality was launched by O-I Glass, which has been certified by the Carbon Trust.
9. What pricing options are available for accessing the report?
Pricing options include single-user, multi-user, and enterprise licenses priced at USD 4750, USD 5250, and USD 8750 respectively.
10. Is the market size provided in terms of value or volume?
The market size is provided in terms of value, measured in billion and volume, measured in Trillion.
11. Are there any specific market keywords associated with the report?
Yes, the market keyword associated with the report is "Glass Packaging Market," which aids in identifying and referencing the specific market segment covered.
12. How do I determine which pricing option suits my needs best?
The pricing options vary based on user requirements and access needs. Individual users may opt for single-user licenses, while businesses requiring broader access may choose multi-user or enterprise licenses for cost-effective access to the report.
13. Are there any additional resources or data provided in the Glass Packaging Market report?
While the report offers comprehensive insights, it's advisable to review the specific contents or supplementary materials provided to ascertain if additional resources or data are available.
14. How can I stay updated on further developments or reports in the Glass Packaging Market?
To stay informed about further developments, trends, and reports in the Glass Packaging Market, consider subscribing to industry newsletters, following relevant companies and organizations, or regularly checking reputable industry news sources and publications.
Methodology
Step 1 - Identification of Relevant Samples Size from Population Database


Step 2 - Approaches for Defining Global Market Size (Value, Volume* & Price*)

Note*: In applicable scenarios
Step 3 - Data Sources
Primary Research
- Web Analytics
- Survey Reports
- Research Institute
- Latest Research Reports
- Opinion Leaders
Secondary Research
- Annual Reports
- White Paper
- Latest Press Release
- Industry Association
- Paid Database
- Investor Presentations

Step 4 - Data Triangulation
Involves using different sources of information in order to increase the validity of a study
These sources are likely to be stakeholders in a program - participants, other researchers, program staff, other community members, and so on.
Then we put all data in single framework & apply various statistical tools to find out the dynamic on the market.
During the analysis stage, feedback from the stakeholder groups would be compared to determine areas of agreement as well as areas of divergence