
Key Insights
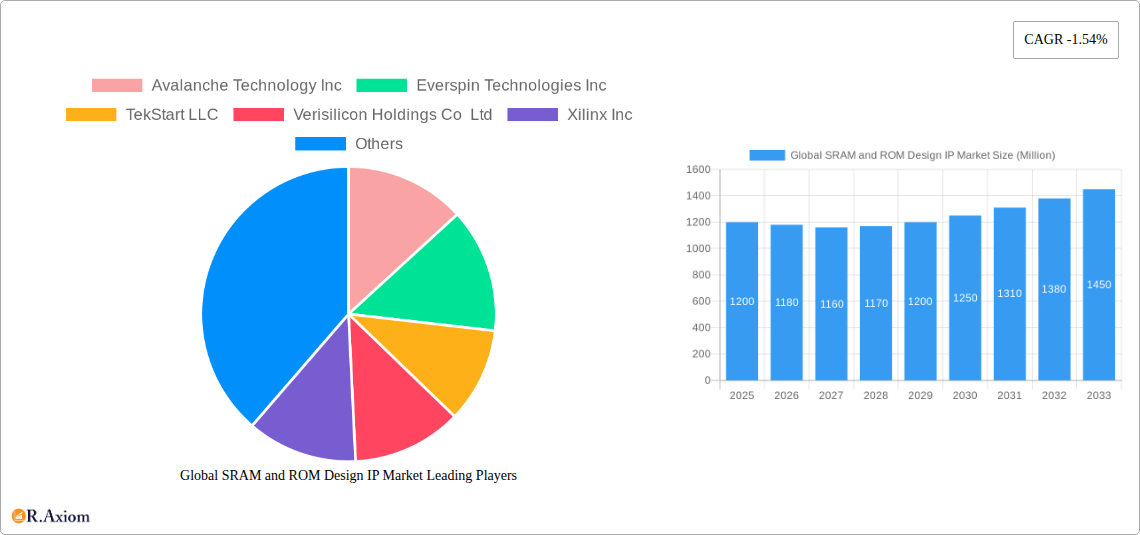
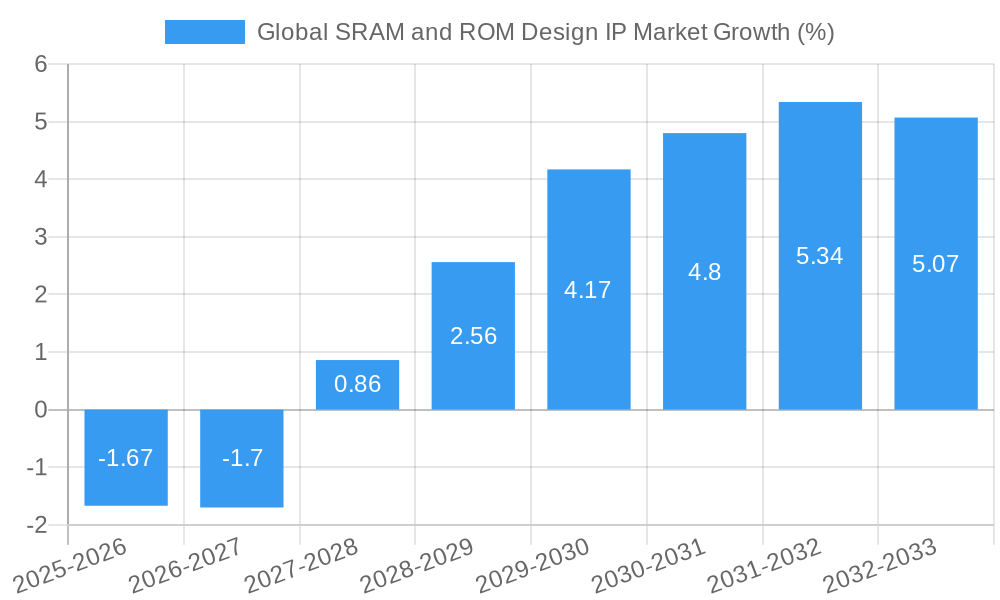
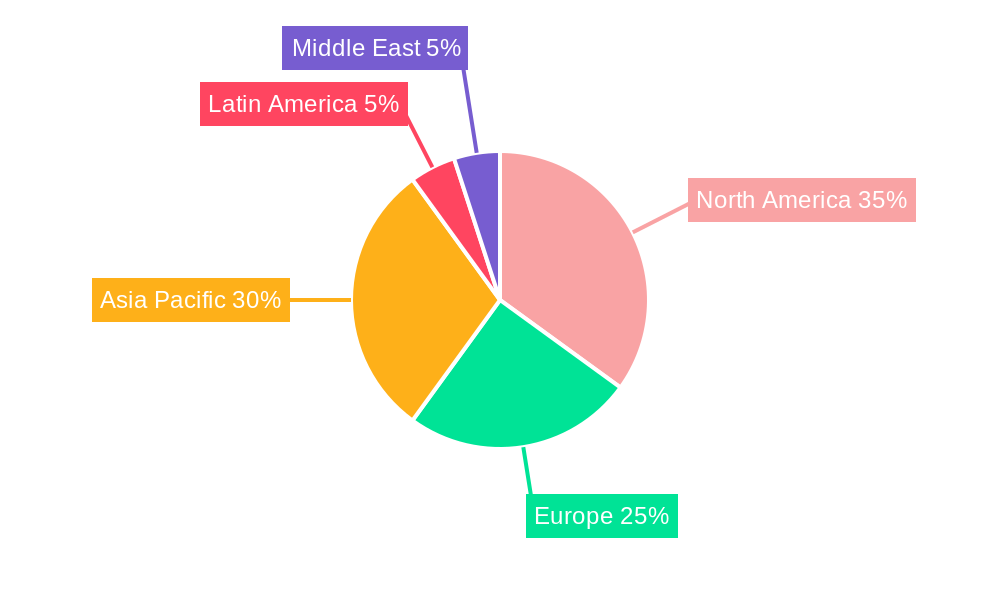
The global SRAM and ROM Design IP market, while exhibiting a slightly negative CAGR of -1.54% from 2019-2024, presents a complex landscape influenced by several interacting factors. The decline likely reflects market maturity in certain segments, particularly in consumer electronics where growth has plateaued. However, strong growth drivers exist in emerging applications like automotive, healthcare, and automation and robotics. These sectors are rapidly adopting advanced memory solutions for enhanced performance and capabilities in autonomous vehicles, medical devices, and industrial robots. The increasing demand for high-performance computing and the Internet of Things (IoT) are also expected to stimulate growth in the coming years. Market segmentation reveals a diverse range of components driving growth, with CPUs and GPUs remaining dominant, while NNPs are emerging as a key growth driver due to their specialized capabilities in AI and machine learning applications. The market is geographically dispersed, with North America and Asia Pacific likely holding the largest market shares due to established technological hubs and strong manufacturing bases. While restraints might include the high cost of development and integration of advanced memory solutions, the long-term potential of the market remains substantial given the continuous advancements in semiconductor technology and the expanding applications across diverse industries.
The forecast period (2025-2033) is expected to witness a shift towards more specialized memory solutions optimized for specific applications. Companies like Xilinx, Arm Holdings, and Renesas Electronics Corporation are key players, leveraging their expertise in IP design and semiconductor technology to cater to evolving industry demands. Strategic partnerships and acquisitions are likely to increase as companies strive for a competitive edge. Furthermore, open-source initiatives and the growing availability of affordable design tools may also impact market dynamics in the forecast period. Overall, while the past few years have seen a slight contraction, the long-term outlook for the SRAM and ROM Design IP market is positive, propelled by growth in high-growth sectors and technological innovation. The market's evolution will depend on the balance between legacy applications and the emergence of new and innovative applications for advanced memory solutions.
This in-depth report provides a comprehensive analysis of the global SRAM and ROM Design IP market, offering valuable insights for industry stakeholders, investors, and market entrants. The study covers the period from 2019 to 2033, with a focus on the forecast period (2025-2033), base year (2025), and estimated year (2025). This report leverages extensive market research, incorporating key performance indicators (KPIs) and detailed segment analysis to present a clear and actionable view of this dynamic market.
Global SRAM and ROM Design IP Market Market Concentration & Innovation
The global SRAM and ROM Design IP market exhibits a moderately concentrated landscape, with a few major players holding significant market share. In 2025, the top five companies are estimated to account for approximately xx% of the total market revenue. This concentration is driven by significant investments in R&D, intellectual property portfolios, and established customer relationships. However, the market is also characterized by ongoing innovation, fueled by the increasing demand for high-performance, low-power memory solutions across various applications. This drives continuous product development and diversification strategies from existing players and encourages the emergence of smaller, niche players specializing in specific memory technologies.
Key innovation drivers include:
- Advancements in semiconductor manufacturing processes (e.g., EUV lithography) enabling higher density and performance.
- Development of new memory architectures (e.g., 3D stacking) to enhance capacity and reduce power consumption.
- Integration of advanced features like error correction codes (ECC) and security mechanisms for enhanced reliability and data protection.
Regulatory frameworks, particularly those related to data security and intellectual property rights, play a crucial role in shaping market dynamics. The presence of substitute technologies, such as embedded flash memory, necessitates continuous innovation to maintain competitive advantage. End-user trends, particularly the growing demand for high-performance computing and the Internet of Things (IoT), significantly impact market growth. M&A activities have played a role in consolidating market share, with notable deals valued at xx Million in the past five years. However, the frequency of such activities is expected to moderate in the forecast period due to increased regulatory scrutiny and a more fragmented competitive landscape.
Global SRAM and ROM Design IP Market Industry Trends & Insights
The global SRAM and ROM Design IP market is experiencing robust growth, driven by the increasing demand for high-performance memory solutions across diverse sectors. The market is projected to register a Compound Annual Growth Rate (CAGR) of xx% during the forecast period (2025-2033). This growth is fueled by several key factors, including:
- The proliferation of smart devices and the IoT, demanding higher memory capacity and faster data access speeds.
- The rapid adoption of advanced driver-assistance systems (ADAS) and autonomous vehicles in the automotive industry.
- The increasing use of AI and machine learning, requiring substantial memory resources for data storage and processing.
- The growing popularity of high-performance computing (HPC) applications, such as cloud computing and big data analytics.
Technological disruptions are shaping market dynamics, with emerging memory technologies like MRAM and ReRAM challenging the dominance of traditional SRAM and ROM. Consumer preferences are shifting towards low-power, high-reliability, and secure memory solutions, influencing product design and development. Competitive dynamics are intense, with major players focusing on strategic partnerships, collaborations, and acquisitions to enhance their product portfolios and market reach. Market penetration of SRAM and ROM design IP in emerging applications, such as healthcare and robotics, is expected to increase significantly, further driving market expansion.
Dominant Markets & Segments in Global SRAM and ROM Design IP Market
The consumer electronics segment dominates the SRAM and ROM Design IP market, accounting for approximately xx% of the total revenue in 2025. This is driven by the high volume of smart devices and electronics produced globally. The automotive industry represents a rapidly growing segment, fueled by the increasing adoption of ADAS and autonomous vehicles.
By Component:
- Central Processing Unit (CPU): High demand for high-performance CPUs in data centers and mobile devices drives significant SRAM and ROM usage.
- Graphics Processing Unit (GPU): The growing popularity of gaming and high-resolution graphics increases the demand for high-bandwidth memory.
- Neural Network Processor (NNP): The expanding AI and machine learning sectors fuel significant growth in NNP-related memory solutions.
- Other Components: This segment includes various memory types used in embedded systems and other applications.
By Application:
- Consumer Electronics: High-volume production of smartphones, tablets, and other consumer devices drives significant market growth.
- Automotive: The increasing integration of electronics in vehicles boosts demand for reliable and high-performance memory solutions.
- Healthcare: Growth in medical devices and healthcare IT infrastructure contributes to the adoption of SRAM and ROM Design IP.
- Automation and Robotics: The increasing use of robots and automated systems in various industries drives demand for robust and reliable memory.
- Other Applications: This segment encompasses industrial automation, networking equipment, and other specialized applications.
Key Drivers (Regional Dominance):
- Strong economic growth in key regions like Asia-Pacific fuels the adoption of advanced electronics.
- Government initiatives supporting the development of high-tech industries contribute to market growth.
- Extensive development of semiconductor manufacturing facilities and supportive infrastructure strengthen the regional dominance.
Global SRAM and ROM Design IP Market Product Developments
Recent product innovations focus on increasing memory density, reducing power consumption, and enhancing performance. New memory architectures and advanced process technologies are being employed to meet the growing demands of high-performance computing and the IoT. The competitive advantage lies in delivering high-performance, low-power, and cost-effective solutions with enhanced reliability and security features. These developments are targeted at various applications, from consumer electronics to high-performance computing and automotive.
Report Scope & Segmentation Analysis
This report comprehensively analyzes the global SRAM and ROM Design IP market across various segments, including:
By Component: Central Processing Unit (CPU), Graphics Processing Unit (GPU), Neural Network Processor (NNP), and Other Components. Each segment's growth trajectory, market size, and competitive dynamics are analyzed. For example, the CPU segment is projected to witness xx% CAGR, driven by the increase in high-performance computing.
By Application: Consumer Electronics, Automotive, Healthcare, Automation and Robotics, and Other Applications. Each application segment is evaluated in terms of its growth potential, market size, and key trends. The automotive sector demonstrates a significant growth rate due to increased adoption of electronic features.
Key Drivers of Global SRAM and ROM Design IP Market Growth
Several factors contribute to the market's growth: the increasing demand for high-performance computing, the proliferation of IoT devices, advancements in semiconductor technology (like 3D stacking and EUV lithography), and government initiatives supporting semiconductor industry development. These factors drive continuous innovation and create opportunities for market expansion.
Challenges in the Global SRAM and ROM Design IP Market Sector
The market faces challenges such as intense competition, increasing design complexity, the need for high reliability and security in critical applications, and potential supply chain disruptions. These factors can impact profitability and hinder market expansion. Regulatory hurdles related to intellectual property and data privacy further add complexity to the market landscape.
Emerging Opportunities in Global SRAM and ROM Design IP Market
Emerging opportunities include the growing demand for memory solutions in the AI/ML market, advancements in emerging memory technologies (like MRAM and ReRAM), and the expansion of the IoT and connected car industries. These factors create new avenues for growth and innovation in the market.
Leading Players in the Global SRAM and ROM Design IP Market Market
- Avalanche Technology Inc
- Everspin Technologies Inc
- TekStart LLC
- Verisilicon Holdings Co Ltd
- Xilinx Inc
- Dolphin Design SAS
- Arm Holdings
- Dolphin Technology Inc
- Surecore Ltd
- Renesas Electronics Corporation
- Synopsys Inc
- TDK Corporation
- eMemory Technology Inc
- Mentor Graphics Corporation
Key Developments in Global SRAM and ROM Design IP Market Industry
- Jan 2023: Xilinx Inc. launched a new line of high-bandwidth memory chips, enhancing performance in data centers.
- Apr 2022: Synopsys Inc. acquired a smaller memory IP company, expanding its product portfolio and market reach.
- Oct 2021: Arm Holdings announced a partnership with a major foundry to develop advanced memory technologies. (Further details on specific deals and dates need to be added based on actual market data).
Strategic Outlook for Global SRAM and ROM Design IP Market Market
The SRAM and ROM Design IP market is poised for significant growth driven by the continued expansion of high-performance computing, the pervasive adoption of the IoT, and continuous advancements in memory technology. The market will continue to witness intense competition and a push towards differentiation through advanced features, high reliability, and optimized power efficiency. The market exhibits considerable potential across diverse sectors, promising lucrative opportunities for both established players and new entrants.
Global SRAM and ROM Design IP Market Segmentation
-
1. Type
- 1.1. High-density SRAM
- 1.2. Low-power SRAM
- 1.3. ROM
-
2. Application
- 2.1. Consumer Electronics
- 2.2. Automotive
- 2.3. Industrial
- 2.4. Enterprise/Data Center
-
3. Geography
- 3.1. North America
- 3.2. Asia-Pacific
- 3.3. Europe
- 3.4. Other Regions
Global SRAM and ROM Design IP Market Segmentation By Geography
-
1. North America
- 1.1. United States
- 1.2. Canada
- 1.3. Mexico
-
2. South America
- 2.1. Brazil
- 2.2. Argentina
- 2.3. Rest of South America
-
3. Europe
- 3.1. United Kingdom
- 3.2. Germany
- 3.3. France
- 3.4. Italy
- 3.5. Spain
- 3.6. Russia
- 3.7. Benelux
- 3.8. Nordics
- 3.9. Rest of Europe
-
4. Middle East & Africa
- 4.1. Turkey
- 4.2. Israel
- 4.3. GCC
- 4.4. North Africa
- 4.5. South Africa
- 4.6. Rest of Middle East & Africa
-
5. Asia Pacific
- 5.1. China
- 5.2. India
- 5.3. Japan
- 5.4. South Korea
- 5.5. ASEAN
- 5.6. Oceania
- 5.7. Rest of Asia Pacific
Global SRAM and ROM Design IP Market REPORT HIGHLIGHTS
| Aspects | Details |
|---|---|
| Study Period | 2019-2033 |
| Base Year | 2024 |
| Estimated Year | 2025 |
| Forecast Period | 2025-2033 |
| Historical Period | 2019-2024 |
| Growth Rate | CAGR of -1.54% from 2019-2033 |
| Segmentation |
|
Table of Contents
- 1. Introduction
- 1.1. Research Scope
- 1.2. Market Segmentation
- 1.3. Research Methodology
- 1.4. Definitions and Assumptions
- 2. Executive Summary
- 2.1. Introduction
- 3. Market Dynamics
- 3.1. Introduction
- 3.2. Market Drivers
- 3.2.1. Increase in Demand for Autonomous Driving Technology; Growth in Edge Analytics for IoT Application
- 3.3. Market Restrains
- 3.3.1. Complexity in Design and AI Interface
- 3.4. Market Trends
- 3.4.1. Increasing Demand For Enterprise Storage Applications to Drive the Growth for MRAM
- 4. Market Factor Analysis
- 4.1. Porters Five Forces
- 4.2. Supply/Value Chain
- 4.3. PESTEL analysis
- 4.4. Market Entropy
- 4.5. Patent/Trademark Analysis
- 5. Global SRAM and ROM Design IP Market Analysis, Insights and Forecast, 2019-2031
- 5.1. Market Analysis, Insights and Forecast - by Type
- 5.1.1. High-density SRAM
- 5.1.2. Low-power SRAM
- 5.1.3. ROM
- 5.2. Market Analysis, Insights and Forecast - by Application
- 5.2.1. Consumer Electronics
- 5.2.2. Automotive
- 5.2.3. Industrial
- 5.2.4. Enterprise/Data Center
- 5.3. Market Analysis, Insights and Forecast - by Geography
- 5.3.1. North America
- 5.3.2. Asia-Pacific
- 5.3.3. Europe
- 5.3.4. Other Regions
- 5.4. Market Analysis, Insights and Forecast - by Region
- 5.4.1. North America
- 5.4.2. South America
- 5.4.3. Europe
- 5.4.4. Middle East & Africa
- 5.4.5. Asia Pacific
- 5.1. Market Analysis, Insights and Forecast - by Type
- 6. North America Global SRAM and ROM Design IP Market Analysis, Insights and Forecast, 2019-2031
- 6.1. Market Analysis, Insights and Forecast - by Type
- 6.1.1. High-density SRAM
- 6.1.2. Low-power SRAM
- 6.1.3. ROM
- 6.2. Market Analysis, Insights and Forecast - by Application
- 6.2.1. Consumer Electronics
- 6.2.2. Automotive
- 6.2.3. Industrial
- 6.2.4. Enterprise/Data Center
- 6.3. Market Analysis, Insights and Forecast - by Geography
- 6.3.1. North America
- 6.3.2. Asia-Pacific
- 6.3.3. Europe
- 6.3.4. Other Regions
- 6.1. Market Analysis, Insights and Forecast - by Type
- 7. South America Global SRAM and ROM Design IP Market Analysis, Insights and Forecast, 2019-2031
- 7.1. Market Analysis, Insights and Forecast - by Type
- 7.1.1. High-density SRAM
- 7.1.2. Low-power SRAM
- 7.1.3. ROM
- 7.2. Market Analysis, Insights and Forecast - by Application
- 7.2.1. Consumer Electronics
- 7.2.2. Automotive
- 7.2.3. Industrial
- 7.2.4. Enterprise/Data Center
- 7.3. Market Analysis, Insights and Forecast - by Geography
- 7.3.1. North America
- 7.3.2. Asia-Pacific
- 7.3.3. Europe
- 7.3.4. Other Regions
- 7.1. Market Analysis, Insights and Forecast - by Type
- 8. Europe Global SRAM and ROM Design IP Market Analysis, Insights and Forecast, 2019-2031
- 8.1. Market Analysis, Insights and Forecast - by Type
- 8.1.1. High-density SRAM
- 8.1.2. Low-power SRAM
- 8.1.3. ROM
- 8.2. Market Analysis, Insights and Forecast - by Application
- 8.2.1. Consumer Electronics
- 8.2.2. Automotive
- 8.2.3. Industrial
- 8.2.4. Enterprise/Data Center
- 8.3. Market Analysis, Insights and Forecast - by Geography
- 8.3.1. North America
- 8.3.2. Asia-Pacific
- 8.3.3. Europe
- 8.3.4. Other Regions
- 8.1. Market Analysis, Insights and Forecast - by Type
- 9. Middle East & Africa Global SRAM and ROM Design IP Market Analysis, Insights and Forecast, 2019-2031
- 9.1. Market Analysis, Insights and Forecast - by Type
- 9.1.1. High-density SRAM
- 9.1.2. Low-power SRAM
- 9.1.3. ROM
- 9.2. Market Analysis, Insights and Forecast - by Application
- 9.2.1. Consumer Electronics
- 9.2.2. Automotive
- 9.2.3. Industrial
- 9.2.4. Enterprise/Data Center
- 9.3. Market Analysis, Insights and Forecast - by Geography
- 9.3.1. North America
- 9.3.2. Asia-Pacific
- 9.3.3. Europe
- 9.3.4. Other Regions
- 9.1. Market Analysis, Insights and Forecast - by Type
- 10. Asia Pacific Global SRAM and ROM Design IP Market Analysis, Insights and Forecast, 2019-2031
- 10.1. Market Analysis, Insights and Forecast - by Type
- 10.1.1. High-density SRAM
- 10.1.2. Low-power SRAM
- 10.1.3. ROM
- 10.2. Market Analysis, Insights and Forecast - by Application
- 10.2.1. Consumer Electronics
- 10.2.2. Automotive
- 10.2.3. Industrial
- 10.2.4. Enterprise/Data Center
- 10.3. Market Analysis, Insights and Forecast - by Geography
- 10.3.1. North America
- 10.3.2. Asia-Pacific
- 10.3.3. Europe
- 10.3.4. Other Regions
- 10.1. Market Analysis, Insights and Forecast - by Type
- 11. North America Global SRAM and ROM Design IP Market Analysis, Insights and Forecast, 2019-2031
- 11.1. Market Analysis, Insights and Forecast - By Country/Sub-region
- 11.1.1.
- 12. Europe Global SRAM and ROM Design IP Market Analysis, Insights and Forecast, 2019-2031
- 12.1. Market Analysis, Insights and Forecast - By Country/Sub-region
- 12.1.1.
- 13. Asia Pacific Global SRAM and ROM Design IP Market Analysis, Insights and Forecast, 2019-2031
- 13.1. Market Analysis, Insights and Forecast - By Country/Sub-region
- 13.1.1.
- 14. Latin America Global SRAM and ROM Design IP Market Analysis, Insights and Forecast, 2019-2031
- 14.1. Market Analysis, Insights and Forecast - By Country/Sub-region
- 14.1.1.
- 15. Middle East Global SRAM and ROM Design IP Market Analysis, Insights and Forecast, 2019-2031
- 15.1. Market Analysis, Insights and Forecast - By Country/Sub-region
- 15.1.1.
- 16. Competitive Analysis
- 16.1. Market Share Analysis 2024
- 16.2. Company Profiles
- 16.2.1 Avalanche Technology Inc
- 16.2.1.1. Overview
- 16.2.1.2. Products
- 16.2.1.3. SWOT Analysis
- 16.2.1.4. Recent Developments
- 16.2.1.5. Financials (Based on Availability)
- 16.2.2 Everspin Technologies Inc
- 16.2.2.1. Overview
- 16.2.2.2. Products
- 16.2.2.3. SWOT Analysis
- 16.2.2.4. Recent Developments
- 16.2.2.5. Financials (Based on Availability)
- 16.2.3 TekStart LLC
- 16.2.3.1. Overview
- 16.2.3.2. Products
- 16.2.3.3. SWOT Analysis
- 16.2.3.4. Recent Developments
- 16.2.3.5. Financials (Based on Availability)
- 16.2.4 Verisilicon Holdings Co Ltd
- 16.2.4.1. Overview
- 16.2.4.2. Products
- 16.2.4.3. SWOT Analysis
- 16.2.4.4. Recent Developments
- 16.2.4.5. Financials (Based on Availability)
- 16.2.5 Xilinx Inc
- 16.2.5.1. Overview
- 16.2.5.2. Products
- 16.2.5.3. SWOT Analysis
- 16.2.5.4. Recent Developments
- 16.2.5.5. Financials (Based on Availability)
- 16.2.6 Dolphin Design SAS
- 16.2.6.1. Overview
- 16.2.6.2. Products
- 16.2.6.3. SWOT Analysis
- 16.2.6.4. Recent Developments
- 16.2.6.5. Financials (Based on Availability)
- 16.2.7 Arm Holdings
- 16.2.7.1. Overview
- 16.2.7.2. Products
- 16.2.7.3. SWOT Analysis
- 16.2.7.4. Recent Developments
- 16.2.7.5. Financials (Based on Availability)
- 16.2.8 Dolphin Technology Inc
- 16.2.8.1. Overview
- 16.2.8.2. Products
- 16.2.8.3. SWOT Analysis
- 16.2.8.4. Recent Developments
- 16.2.8.5. Financials (Based on Availability)
- 16.2.9 Surecore Ltd
- 16.2.9.1. Overview
- 16.2.9.2. Products
- 16.2.9.3. SWOT Analysis
- 16.2.9.4. Recent Developments
- 16.2.9.5. Financials (Based on Availability)
- 16.2.10 Renesas Electronics Corporation
- 16.2.10.1. Overview
- 16.2.10.2. Products
- 16.2.10.3. SWOT Analysis
- 16.2.10.4. Recent Developments
- 16.2.10.5. Financials (Based on Availability)
- 16.2.11 Synopsys Inc
- 16.2.11.1. Overview
- 16.2.11.2. Products
- 16.2.11.3. SWOT Analysis
- 16.2.11.4. Recent Developments
- 16.2.11.5. Financials (Based on Availability)
- 16.2.12 TDK Corporation
- 16.2.12.1. Overview
- 16.2.12.2. Products
- 16.2.12.3. SWOT Analysis
- 16.2.12.4. Recent Developments
- 16.2.12.5. Financials (Based on Availability)
- 16.2.13 eMemory Technology Inc
- 16.2.13.1. Overview
- 16.2.13.2. Products
- 16.2.13.3. SWOT Analysis
- 16.2.13.4. Recent Developments
- 16.2.13.5. Financials (Based on Availability)
- 16.2.14 Mentor Graphics Corporation
- 16.2.14.1. Overview
- 16.2.14.2. Products
- 16.2.14.3. SWOT Analysis
- 16.2.14.4. Recent Developments
- 16.2.14.5. Financials (Based on Availability)
- 16.2.1 Avalanche Technology Inc
List of Figures
- Figure 1: Global Global SRAM and ROM Design IP Market Revenue Breakdown (Million, %) by Region 2024 & 2032
- Figure 2: Global Global SRAM and ROM Design IP Market Volume Breakdown (K Unit, %) by Region 2024 & 2032
- Figure 3: North America Global SRAM and ROM Design IP Market Revenue (Million), by Country 2024 & 2032
- Figure 4: North America Global SRAM and ROM Design IP Market Volume (K Unit), by Country 2024 & 2032
- Figure 5: North America Global SRAM and ROM Design IP Market Revenue Share (%), by Country 2024 & 2032
- Figure 6: North America Global SRAM and ROM Design IP Market Volume Share (%), by Country 2024 & 2032
- Figure 7: Europe Global SRAM and ROM Design IP Market Revenue (Million), by Country 2024 & 2032
- Figure 8: Europe Global SRAM and ROM Design IP Market Volume (K Unit), by Country 2024 & 2032
- Figure 9: Europe Global SRAM and ROM Design IP Market Revenue Share (%), by Country 2024 & 2032
- Figure 10: Europe Global SRAM and ROM Design IP Market Volume Share (%), by Country 2024 & 2032
- Figure 11: Asia Pacific Global SRAM and ROM Design IP Market Revenue (Million), by Country 2024 & 2032
- Figure 12: Asia Pacific Global SRAM and ROM Design IP Market Volume (K Unit), by Country 2024 & 2032
- Figure 13: Asia Pacific Global SRAM and ROM Design IP Market Revenue Share (%), by Country 2024 & 2032
- Figure 14: Asia Pacific Global SRAM and ROM Design IP Market Volume Share (%), by Country 2024 & 2032
- Figure 15: Latin America Global SRAM and ROM Design IP Market Revenue (Million), by Country 2024 & 2032
- Figure 16: Latin America Global SRAM and ROM Design IP Market Volume (K Unit), by Country 2024 & 2032
- Figure 17: Latin America Global SRAM and ROM Design IP Market Revenue Share (%), by Country 2024 & 2032
- Figure 18: Latin America Global SRAM and ROM Design IP Market Volume Share (%), by Country 2024 & 2032
- Figure 19: Middle East Global SRAM and ROM Design IP Market Revenue (Million), by Country 2024 & 2032
- Figure 20: Middle East Global SRAM and ROM Design IP Market Volume (K Unit), by Country 2024 & 2032
- Figure 21: Middle East Global SRAM and ROM Design IP Market Revenue Share (%), by Country 2024 & 2032
- Figure 22: Middle East Global SRAM and ROM Design IP Market Volume Share (%), by Country 2024 & 2032
- Figure 23: North America Global SRAM and ROM Design IP Market Revenue (Million), by Type 2024 & 2032
- Figure 24: North America Global SRAM and ROM Design IP Market Volume (K Unit), by Type 2024 & 2032
- Figure 25: North America Global SRAM and ROM Design IP Market Revenue Share (%), by Type 2024 & 2032
- Figure 26: North America Global SRAM and ROM Design IP Market Volume Share (%), by Type 2024 & 2032
- Figure 27: North America Global SRAM and ROM Design IP Market Revenue (Million), by Application 2024 & 2032
- Figure 28: North America Global SRAM and ROM Design IP Market Volume (K Unit), by Application 2024 & 2032
- Figure 29: North America Global SRAM and ROM Design IP Market Revenue Share (%), by Application 2024 & 2032
- Figure 30: North America Global SRAM and ROM Design IP Market Volume Share (%), by Application 2024 & 2032
- Figure 31: North America Global SRAM and ROM Design IP Market Revenue (Million), by Geography 2024 & 2032
- Figure 32: North America Global SRAM and ROM Design IP Market Volume (K Unit), by Geography 2024 & 2032
- Figure 33: North America Global SRAM and ROM Design IP Market Revenue Share (%), by Geography 2024 & 2032
- Figure 34: North America Global SRAM and ROM Design IP Market Volume Share (%), by Geography 2024 & 2032
- Figure 35: North America Global SRAM and ROM Design IP Market Revenue (Million), by Country 2024 & 2032
- Figure 36: North America Global SRAM and ROM Design IP Market Volume (K Unit), by Country 2024 & 2032
- Figure 37: North America Global SRAM and ROM Design IP Market Revenue Share (%), by Country 2024 & 2032
- Figure 38: North America Global SRAM and ROM Design IP Market Volume Share (%), by Country 2024 & 2032
- Figure 39: South America Global SRAM and ROM Design IP Market Revenue (Million), by Type 2024 & 2032
- Figure 40: South America Global SRAM and ROM Design IP Market Volume (K Unit), by Type 2024 & 2032
- Figure 41: South America Global SRAM and ROM Design IP Market Revenue Share (%), by Type 2024 & 2032
- Figure 42: South America Global SRAM and ROM Design IP Market Volume Share (%), by Type 2024 & 2032
- Figure 43: South America Global SRAM and ROM Design IP Market Revenue (Million), by Application 2024 & 2032
- Figure 44: South America Global SRAM and ROM Design IP Market Volume (K Unit), by Application 2024 & 2032
- Figure 45: South America Global SRAM and ROM Design IP Market Revenue Share (%), by Application 2024 & 2032
- Figure 46: South America Global SRAM and ROM Design IP Market Volume Share (%), by Application 2024 & 2032
- Figure 47: South America Global SRAM and ROM Design IP Market Revenue (Million), by Geography 2024 & 2032
- Figure 48: South America Global SRAM and ROM Design IP Market Volume (K Unit), by Geography 2024 & 2032
- Figure 49: South America Global SRAM and ROM Design IP Market Revenue Share (%), by Geography 2024 & 2032
- Figure 50: South America Global SRAM and ROM Design IP Market Volume Share (%), by Geography 2024 & 2032
- Figure 51: South America Global SRAM and ROM Design IP Market Revenue (Million), by Country 2024 & 2032
- Figure 52: South America Global SRAM and ROM Design IP Market Volume (K Unit), by Country 2024 & 2032
- Figure 53: South America Global SRAM and ROM Design IP Market Revenue Share (%), by Country 2024 & 2032
- Figure 54: South America Global SRAM and ROM Design IP Market Volume Share (%), by Country 2024 & 2032
- Figure 55: Europe Global SRAM and ROM Design IP Market Revenue (Million), by Type 2024 & 2032
- Figure 56: Europe Global SRAM and ROM Design IP Market Volume (K Unit), by Type 2024 & 2032
- Figure 57: Europe Global SRAM and ROM Design IP Market Revenue Share (%), by Type 2024 & 2032
- Figure 58: Europe Global SRAM and ROM Design IP Market Volume Share (%), by Type 2024 & 2032
- Figure 59: Europe Global SRAM and ROM Design IP Market Revenue (Million), by Application 2024 & 2032
- Figure 60: Europe Global SRAM and ROM Design IP Market Volume (K Unit), by Application 2024 & 2032
- Figure 61: Europe Global SRAM and ROM Design IP Market Revenue Share (%), by Application 2024 & 2032
- Figure 62: Europe Global SRAM and ROM Design IP Market Volume Share (%), by Application 2024 & 2032
- Figure 63: Europe Global SRAM and ROM Design IP Market Revenue (Million), by Geography 2024 & 2032
- Figure 64: Europe Global SRAM and ROM Design IP Market Volume (K Unit), by Geography 2024 & 2032
- Figure 65: Europe Global SRAM and ROM Design IP Market Revenue Share (%), by Geography 2024 & 2032
- Figure 66: Europe Global SRAM and ROM Design IP Market Volume Share (%), by Geography 2024 & 2032
- Figure 67: Europe Global SRAM and ROM Design IP Market Revenue (Million), by Country 2024 & 2032
- Figure 68: Europe Global SRAM and ROM Design IP Market Volume (K Unit), by Country 2024 & 2032
- Figure 69: Europe Global SRAM and ROM Design IP Market Revenue Share (%), by Country 2024 & 2032
- Figure 70: Europe Global SRAM and ROM Design IP Market Volume Share (%), by Country 2024 & 2032
- Figure 71: Middle East & Africa Global SRAM and ROM Design IP Market Revenue (Million), by Type 2024 & 2032
- Figure 72: Middle East & Africa Global SRAM and ROM Design IP Market Volume (K Unit), by Type 2024 & 2032
- Figure 73: Middle East & Africa Global SRAM and ROM Design IP Market Revenue Share (%), by Type 2024 & 2032
- Figure 74: Middle East & Africa Global SRAM and ROM Design IP Market Volume Share (%), by Type 2024 & 2032
- Figure 75: Middle East & Africa Global SRAM and ROM Design IP Market Revenue (Million), by Application 2024 & 2032
- Figure 76: Middle East & Africa Global SRAM and ROM Design IP Market Volume (K Unit), by Application 2024 & 2032
- Figure 77: Middle East & Africa Global SRAM and ROM Design IP Market Revenue Share (%), by Application 2024 & 2032
- Figure 78: Middle East & Africa Global SRAM and ROM Design IP Market Volume Share (%), by Application 2024 & 2032
- Figure 79: Middle East & Africa Global SRAM and ROM Design IP Market Revenue (Million), by Geography 2024 & 2032
- Figure 80: Middle East & Africa Global SRAM and ROM Design IP Market Volume (K Unit), by Geography 2024 & 2032
- Figure 81: Middle East & Africa Global SRAM and ROM Design IP Market Revenue Share (%), by Geography 2024 & 2032
- Figure 82: Middle East & Africa Global SRAM and ROM Design IP Market Volume Share (%), by Geography 2024 & 2032
- Figure 83: Middle East & Africa Global SRAM and ROM Design IP Market Revenue (Million), by Country 2024 & 2032
- Figure 84: Middle East & Africa Global SRAM and ROM Design IP Market Volume (K Unit), by Country 2024 & 2032
- Figure 85: Middle East & Africa Global SRAM and ROM Design IP Market Revenue Share (%), by Country 2024 & 2032
- Figure 86: Middle East & Africa Global SRAM and ROM Design IP Market Volume Share (%), by Country 2024 & 2032
- Figure 87: Asia Pacific Global SRAM and ROM Design IP Market Revenue (Million), by Type 2024 & 2032
- Figure 88: Asia Pacific Global SRAM and ROM Design IP Market Volume (K Unit), by Type 2024 & 2032
- Figure 89: Asia Pacific Global SRAM and ROM Design IP Market Revenue Share (%), by Type 2024 & 2032
- Figure 90: Asia Pacific Global SRAM and ROM Design IP Market Volume Share (%), by Type 2024 & 2032
- Figure 91: Asia Pacific Global SRAM and ROM Design IP Market Revenue (Million), by Application 2024 & 2032
- Figure 92: Asia Pacific Global SRAM and ROM Design IP Market Volume (K Unit), by Application 2024 & 2032
- Figure 93: Asia Pacific Global SRAM and ROM Design IP Market Revenue Share (%), by Application 2024 & 2032
- Figure 94: Asia Pacific Global SRAM and ROM Design IP Market Volume Share (%), by Application 2024 & 2032
- Figure 95: Asia Pacific Global SRAM and ROM Design IP Market Revenue (Million), by Geography 2024 & 2032
- Figure 96: Asia Pacific Global SRAM and ROM Design IP Market Volume (K Unit), by Geography 2024 & 2032
- Figure 97: Asia Pacific Global SRAM and ROM Design IP Market Revenue Share (%), by Geography 2024 & 2032
- Figure 98: Asia Pacific Global SRAM and ROM Design IP Market Volume Share (%), by Geography 2024 & 2032
- Figure 99: Asia Pacific Global SRAM and ROM Design IP Market Revenue (Million), by Country 2024 & 2032
- Figure 100: Asia Pacific Global SRAM and ROM Design IP Market Volume (K Unit), by Country 2024 & 2032
- Figure 101: Asia Pacific Global SRAM and ROM Design IP Market Revenue Share (%), by Country 2024 & 2032
- Figure 102: Asia Pacific Global SRAM and ROM Design IP Market Volume Share (%), by Country 2024 & 2032
List of Tables
- Table 1: Global SRAM and ROM Design IP Market Revenue Million Forecast, by Region 2019 & 2032
- Table 2: Global SRAM and ROM Design IP Market Volume K Unit Forecast, by Region 2019 & 2032
- Table 3: Global SRAM and ROM Design IP Market Revenue Million Forecast, by Type 2019 & 2032
- Table 4: Global SRAM and ROM Design IP Market Volume K Unit Forecast, by Type 2019 & 2032
- Table 5: Global SRAM and ROM Design IP Market Revenue Million Forecast, by Application 2019 & 2032
- Table 6: Global SRAM and ROM Design IP Market Volume K Unit Forecast, by Application 2019 & 2032
- Table 7: Global SRAM and ROM Design IP Market Revenue Million Forecast, by Geography 2019 & 2032
- Table 8: Global SRAM and ROM Design IP Market Volume K Unit Forecast, by Geography 2019 & 2032
- Table 9: Global SRAM and ROM Design IP Market Revenue Million Forecast, by Region 2019 & 2032
- Table 10: Global SRAM and ROM Design IP Market Volume K Unit Forecast, by Region 2019 & 2032
- Table 11: Global SRAM and ROM Design IP Market Revenue Million Forecast, by Country 2019 & 2032
- Table 12: Global SRAM and ROM Design IP Market Volume K Unit Forecast, by Country 2019 & 2032
- Table 13: Global SRAM and ROM Design IP Market Revenue (Million) Forecast, by Application 2019 & 2032
- Table 14: Global SRAM and ROM Design IP Market Volume (K Unit) Forecast, by Application 2019 & 2032
- Table 15: Global SRAM and ROM Design IP Market Revenue Million Forecast, by Country 2019 & 2032
- Table 16: Global SRAM and ROM Design IP Market Volume K Unit Forecast, by Country 2019 & 2032
- Table 17: Global SRAM and ROM Design IP Market Revenue (Million) Forecast, by Application 2019 & 2032
- Table 18: Global SRAM and ROM Design IP Market Volume (K Unit) Forecast, by Application 2019 & 2032
- Table 19: Global SRAM and ROM Design IP Market Revenue Million Forecast, by Country 2019 & 2032
- Table 20: Global SRAM and ROM Design IP Market Volume K Unit Forecast, by Country 2019 & 2032
- Table 21: Global SRAM and ROM Design IP Market Revenue (Million) Forecast, by Application 2019 & 2032
- Table 22: Global SRAM and ROM Design IP Market Volume (K Unit) Forecast, by Application 2019 & 2032
- Table 23: Global SRAM and ROM Design IP Market Revenue Million Forecast, by Country 2019 & 2032
- Table 24: Global SRAM and ROM Design IP Market Volume K Unit Forecast, by Country 2019 & 2032
- Table 25: Global SRAM and ROM Design IP Market Revenue (Million) Forecast, by Application 2019 & 2032
- Table 26: Global SRAM and ROM Design IP Market Volume (K Unit) Forecast, by Application 2019 & 2032
- Table 27: Global SRAM and ROM Design IP Market Revenue Million Forecast, by Country 2019 & 2032
- Table 28: Global SRAM and ROM Design IP Market Volume K Unit Forecast, by Country 2019 & 2032
- Table 29: Global SRAM and ROM Design IP Market Revenue (Million) Forecast, by Application 2019 & 2032
- Table 30: Global SRAM and ROM Design IP Market Volume (K Unit) Forecast, by Application 2019 & 2032
- Table 31: Global SRAM and ROM Design IP Market Revenue Million Forecast, by Type 2019 & 2032
- Table 32: Global SRAM and ROM Design IP Market Volume K Unit Forecast, by Type 2019 & 2032
- Table 33: Global SRAM and ROM Design IP Market Revenue Million Forecast, by Application 2019 & 2032
- Table 34: Global SRAM and ROM Design IP Market Volume K Unit Forecast, by Application 2019 & 2032
- Table 35: Global SRAM and ROM Design IP Market Revenue Million Forecast, by Geography 2019 & 2032
- Table 36: Global SRAM and ROM Design IP Market Volume K Unit Forecast, by Geography 2019 & 2032
- Table 37: Global SRAM and ROM Design IP Market Revenue Million Forecast, by Country 2019 & 2032
- Table 38: Global SRAM and ROM Design IP Market Volume K Unit Forecast, by Country 2019 & 2032
- Table 39: United States Global SRAM and ROM Design IP Market Revenue (Million) Forecast, by Application 2019 & 2032
- Table 40: United States Global SRAM and ROM Design IP Market Volume (K Unit) Forecast, by Application 2019 & 2032
- Table 41: Canada Global SRAM and ROM Design IP Market Revenue (Million) Forecast, by Application 2019 & 2032
- Table 42: Canada Global SRAM and ROM Design IP Market Volume (K Unit) Forecast, by Application 2019 & 2032
- Table 43: Mexico Global SRAM and ROM Design IP Market Revenue (Million) Forecast, by Application 2019 & 2032
- Table 44: Mexico Global SRAM and ROM Design IP Market Volume (K Unit) Forecast, by Application 2019 & 2032
- Table 45: Global SRAM and ROM Design IP Market Revenue Million Forecast, by Type 2019 & 2032
- Table 46: Global SRAM and ROM Design IP Market Volume K Unit Forecast, by Type 2019 & 2032
- Table 47: Global SRAM and ROM Design IP Market Revenue Million Forecast, by Application 2019 & 2032
- Table 48: Global SRAM and ROM Design IP Market Volume K Unit Forecast, by Application 2019 & 2032
- Table 49: Global SRAM and ROM Design IP Market Revenue Million Forecast, by Geography 2019 & 2032
- Table 50: Global SRAM and ROM Design IP Market Volume K Unit Forecast, by Geography 2019 & 2032
- Table 51: Global SRAM and ROM Design IP Market Revenue Million Forecast, by Country 2019 & 2032
- Table 52: Global SRAM and ROM Design IP Market Volume K Unit Forecast, by Country 2019 & 2032
- Table 53: Brazil Global SRAM and ROM Design IP Market Revenue (Million) Forecast, by Application 2019 & 2032
- Table 54: Brazil Global SRAM and ROM Design IP Market Volume (K Unit) Forecast, by Application 2019 & 2032
- Table 55: Argentina Global SRAM and ROM Design IP Market Revenue (Million) Forecast, by Application 2019 & 2032
- Table 56: Argentina Global SRAM and ROM Design IP Market Volume (K Unit) Forecast, by Application 2019 & 2032
- Table 57: Rest of South America Global SRAM and ROM Design IP Market Revenue (Million) Forecast, by Application 2019 & 2032
- Table 58: Rest of South America Global SRAM and ROM Design IP Market Volume (K Unit) Forecast, by Application 2019 & 2032
- Table 59: Global SRAM and ROM Design IP Market Revenue Million Forecast, by Type 2019 & 2032
- Table 60: Global SRAM and ROM Design IP Market Volume K Unit Forecast, by Type 2019 & 2032
- Table 61: Global SRAM and ROM Design IP Market Revenue Million Forecast, by Application 2019 & 2032
- Table 62: Global SRAM and ROM Design IP Market Volume K Unit Forecast, by Application 2019 & 2032
- Table 63: Global SRAM and ROM Design IP Market Revenue Million Forecast, by Geography 2019 & 2032
- Table 64: Global SRAM and ROM Design IP Market Volume K Unit Forecast, by Geography 2019 & 2032
- Table 65: Global SRAM and ROM Design IP Market Revenue Million Forecast, by Country 2019 & 2032
- Table 66: Global SRAM and ROM Design IP Market Volume K Unit Forecast, by Country 2019 & 2032
- Table 67: United Kingdom Global SRAM and ROM Design IP Market Revenue (Million) Forecast, by Application 2019 & 2032
- Table 68: United Kingdom Global SRAM and ROM Design IP Market Volume (K Unit) Forecast, by Application 2019 & 2032
- Table 69: Germany Global SRAM and ROM Design IP Market Revenue (Million) Forecast, by Application 2019 & 2032
- Table 70: Germany Global SRAM and ROM Design IP Market Volume (K Unit) Forecast, by Application 2019 & 2032
- Table 71: France Global SRAM and ROM Design IP Market Revenue (Million) Forecast, by Application 2019 & 2032
- Table 72: France Global SRAM and ROM Design IP Market Volume (K Unit) Forecast, by Application 2019 & 2032
- Table 73: Italy Global SRAM and ROM Design IP Market Revenue (Million) Forecast, by Application 2019 & 2032
- Table 74: Italy Global SRAM and ROM Design IP Market Volume (K Unit) Forecast, by Application 2019 & 2032
- Table 75: Spain Global SRAM and ROM Design IP Market Revenue (Million) Forecast, by Application 2019 & 2032
- Table 76: Spain Global SRAM and ROM Design IP Market Volume (K Unit) Forecast, by Application 2019 & 2032
- Table 77: Russia Global SRAM and ROM Design IP Market Revenue (Million) Forecast, by Application 2019 & 2032
- Table 78: Russia Global SRAM and ROM Design IP Market Volume (K Unit) Forecast, by Application 2019 & 2032
- Table 79: Benelux Global SRAM and ROM Design IP Market Revenue (Million) Forecast, by Application 2019 & 2032
- Table 80: Benelux Global SRAM and ROM Design IP Market Volume (K Unit) Forecast, by Application 2019 & 2032
- Table 81: Nordics Global SRAM and ROM Design IP Market Revenue (Million) Forecast, by Application 2019 & 2032
- Table 82: Nordics Global SRAM and ROM Design IP Market Volume (K Unit) Forecast, by Application 2019 & 2032
- Table 83: Rest of Europe Global SRAM and ROM Design IP Market Revenue (Million) Forecast, by Application 2019 & 2032
- Table 84: Rest of Europe Global SRAM and ROM Design IP Market Volume (K Unit) Forecast, by Application 2019 & 2032
- Table 85: Global SRAM and ROM Design IP Market Revenue Million Forecast, by Type 2019 & 2032
- Table 86: Global SRAM and ROM Design IP Market Volume K Unit Forecast, by Type 2019 & 2032
- Table 87: Global SRAM and ROM Design IP Market Revenue Million Forecast, by Application 2019 & 2032
- Table 88: Global SRAM and ROM Design IP Market Volume K Unit Forecast, by Application 2019 & 2032
- Table 89: Global SRAM and ROM Design IP Market Revenue Million Forecast, by Geography 2019 & 2032
- Table 90: Global SRAM and ROM Design IP Market Volume K Unit Forecast, by Geography 2019 & 2032
- Table 91: Global SRAM and ROM Design IP Market Revenue Million Forecast, by Country 2019 & 2032
- Table 92: Global SRAM and ROM Design IP Market Volume K Unit Forecast, by Country 2019 & 2032
- Table 93: Turkey Global SRAM and ROM Design IP Market Revenue (Million) Forecast, by Application 2019 & 2032
- Table 94: Turkey Global SRAM and ROM Design IP Market Volume (K Unit) Forecast, by Application 2019 & 2032
- Table 95: Israel Global SRAM and ROM Design IP Market Revenue (Million) Forecast, by Application 2019 & 2032
- Table 96: Israel Global SRAM and ROM Design IP Market Volume (K Unit) Forecast, by Application 2019 & 2032
- Table 97: GCC Global SRAM and ROM Design IP Market Revenue (Million) Forecast, by Application 2019 & 2032
- Table 98: GCC Global SRAM and ROM Design IP Market Volume (K Unit) Forecast, by Application 2019 & 2032
- Table 99: North Africa Global SRAM and ROM Design IP Market Revenue (Million) Forecast, by Application 2019 & 2032
- Table 100: North Africa Global SRAM and ROM Design IP Market Volume (K Unit) Forecast, by Application 2019 & 2032
- Table 101: South Africa Global SRAM and ROM Design IP Market Revenue (Million) Forecast, by Application 2019 & 2032
- Table 102: South Africa Global SRAM and ROM Design IP Market Volume (K Unit) Forecast, by Application 2019 & 2032
- Table 103: Rest of Middle East & Africa Global SRAM and ROM Design IP Market Revenue (Million) Forecast, by Application 2019 & 2032
- Table 104: Rest of Middle East & Africa Global SRAM and ROM Design IP Market Volume (K Unit) Forecast, by Application 2019 & 2032
- Table 105: Global SRAM and ROM Design IP Market Revenue Million Forecast, by Type 2019 & 2032
- Table 106: Global SRAM and ROM Design IP Market Volume K Unit Forecast, by Type 2019 & 2032
- Table 107: Global SRAM and ROM Design IP Market Revenue Million Forecast, by Application 2019 & 2032
- Table 108: Global SRAM and ROM Design IP Market Volume K Unit Forecast, by Application 2019 & 2032
- Table 109: Global SRAM and ROM Design IP Market Revenue Million Forecast, by Geography 2019 & 2032
- Table 110: Global SRAM and ROM Design IP Market Volume K Unit Forecast, by Geography 2019 & 2032
- Table 111: Global SRAM and ROM Design IP Market Revenue Million Forecast, by Country 2019 & 2032
- Table 112: Global SRAM and ROM Design IP Market Volume K Unit Forecast, by Country 2019 & 2032
- Table 113: China Global SRAM and ROM Design IP Market Revenue (Million) Forecast, by Application 2019 & 2032
- Table 114: China Global SRAM and ROM Design IP Market Volume (K Unit) Forecast, by Application 2019 & 2032
- Table 115: India Global SRAM and ROM Design IP Market Revenue (Million) Forecast, by Application 2019 & 2032
- Table 116: India Global SRAM and ROM Design IP Market Volume (K Unit) Forecast, by Application 2019 & 2032
- Table 117: Japan Global SRAM and ROM Design IP Market Revenue (Million) Forecast, by Application 2019 & 2032
- Table 118: Japan Global SRAM and ROM Design IP Market Volume (K Unit) Forecast, by Application 2019 & 2032
- Table 119: South Korea Global SRAM and ROM Design IP Market Revenue (Million) Forecast, by Application 2019 & 2032
- Table 120: South Korea Global SRAM and ROM Design IP Market Volume (K Unit) Forecast, by Application 2019 & 2032
- Table 121: ASEAN Global SRAM and ROM Design IP Market Revenue (Million) Forecast, by Application 2019 & 2032
- Table 122: ASEAN Global SRAM and ROM Design IP Market Volume (K Unit) Forecast, by Application 2019 & 2032
- Table 123: Oceania Global SRAM and ROM Design IP Market Revenue (Million) Forecast, by Application 2019 & 2032
- Table 124: Oceania Global SRAM and ROM Design IP Market Volume (K Unit) Forecast, by Application 2019 & 2032
- Table 125: Rest of Asia Pacific Global SRAM and ROM Design IP Market Revenue (Million) Forecast, by Application 2019 & 2032
- Table 126: Rest of Asia Pacific Global SRAM and ROM Design IP Market Volume (K Unit) Forecast, by Application 2019 & 2032
Frequently Asked Questions
1. What is the projected Compound Annual Growth Rate (CAGR) of the Global SRAM and ROM Design IP Market?
The projected CAGR is approximately -1.54%.
2. Which companies are prominent players in the Global SRAM and ROM Design IP Market?
Key companies in the market include Avalanche Technology Inc, Everspin Technologies Inc, TekStart LLC, Verisilicon Holdings Co Ltd, Xilinx Inc, Dolphin Design SAS, Arm Holdings, Dolphin Technology Inc, Surecore Ltd, Renesas Electronics Corporation, Synopsys Inc, TDK Corporation, eMemory Technology Inc, Mentor Graphics Corporation.
3. What are the main segments of the Global SRAM and ROM Design IP Market?
The market segments include Type, Application, Geography.
4. Can you provide details about the market size?
The market size is estimated to be USD XX Million as of 2022.
5. What are some drivers contributing to market growth?
Increase in Demand for Autonomous Driving Technology; Growth in Edge Analytics for IoT Application.
6. What are the notable trends driving market growth?
Increasing Demand For Enterprise Storage Applications to Drive the Growth for MRAM.
7. Are there any restraints impacting market growth?
Complexity in Design and AI Interface.
8. Can you provide examples of recent developments in the market?
N/A
9. What pricing options are available for accessing the report?
Pricing options include single-user, multi-user, and enterprise licenses priced at USD 3800, USD 4500, and USD 5800 respectively.
10. Is the market size provided in terms of value or volume?
The market size is provided in terms of value, measured in Million and volume, measured in K Unit.
11. Are there any specific market keywords associated with the report?
Yes, the market keyword associated with the report is "Global SRAM and ROM Design IP Market," which aids in identifying and referencing the specific market segment covered.
12. How do I determine which pricing option suits my needs best?
The pricing options vary based on user requirements and access needs. Individual users may opt for single-user licenses, while businesses requiring broader access may choose multi-user or enterprise licenses for cost-effective access to the report.
13. Are there any additional resources or data provided in the Global SRAM and ROM Design IP Market report?
While the report offers comprehensive insights, it's advisable to review the specific contents or supplementary materials provided to ascertain if additional resources or data are available.
14. How can I stay updated on further developments or reports in the Global SRAM and ROM Design IP Market?
To stay informed about further developments, trends, and reports in the Global SRAM and ROM Design IP Market, consider subscribing to industry newsletters, following relevant companies and organizations, or regularly checking reputable industry news sources and publications.
Methodology
Step 1 - Identification of Relevant Samples Size from Population Database


Step 2 - Approaches for Defining Global Market Size (Value, Volume* & Price*)

Note*: In applicable scenarios
Step 3 - Data Sources
Primary Research
- Web Analytics
- Survey Reports
- Research Institute
- Latest Research Reports
- Opinion Leaders
Secondary Research
- Annual Reports
- White Paper
- Latest Press Release
- Industry Association
- Paid Database
- Investor Presentations

Step 4 - Data Triangulation
Involves using different sources of information in order to increase the validity of a study
These sources are likely to be stakeholders in a program - participants, other researchers, program staff, other community members, and so on.
Then we put all data in single framework & apply various statistical tools to find out the dynamic on the market.
During the analysis stage, feedback from the stakeholder groups would be compared to determine areas of agreement as well as areas of divergence


