
Key Insights
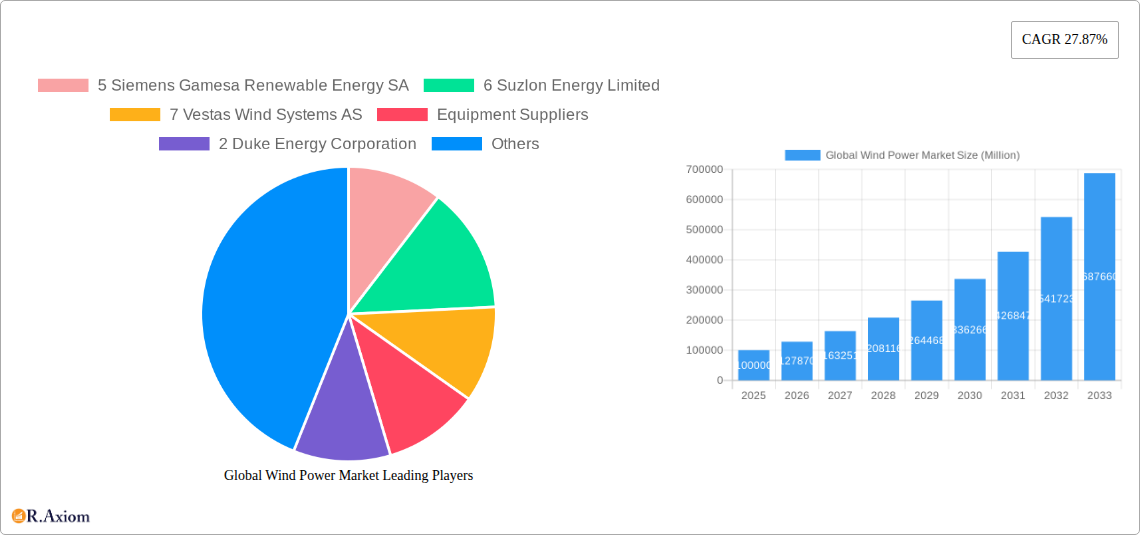
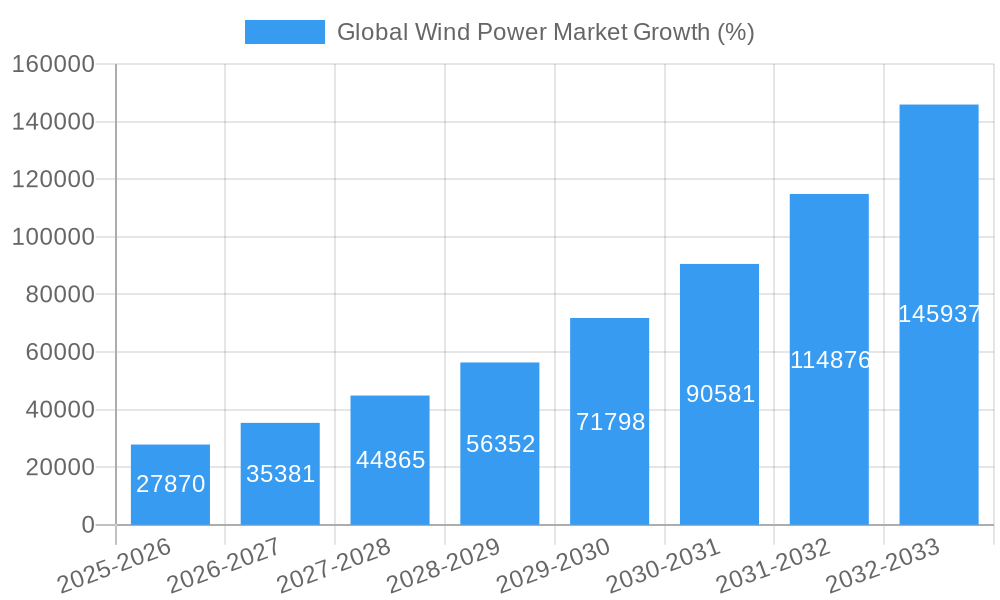
The global wind power market is experiencing robust growth, driven by increasing concerns about climate change and the urgent need for renewable energy sources. A 27.87% CAGR indicates a rapidly expanding market, projected to reach substantial value over the forecast period (2025-2033). Key drivers include supportive government policies promoting renewable energy adoption, decreasing wind turbine costs, and advancements in wind turbine technology leading to increased efficiency and capacity. Emerging trends include the rise of offshore wind farms, which offer higher capacity factors and less visual impact compared to onshore installations, and the integration of wind power into smart grids for improved energy management. While geographic expansion continues, particularly in developing economies with high energy demands, challenges remain. These include the intermittent nature of wind power, requiring robust energy storage solutions and grid infrastructure upgrades, and the environmental concerns associated with large-scale wind farm construction, especially in sensitive ecosystems. The market is segmented by location (onshore and offshore) and key players include major turbine manufacturers like Siemens Gamesa, Vestas, and Goldwind, along with significant wind farm operators like Orsted and NextEra Energy. Competitive landscape analysis reveals a dynamic market with companies focusing on innovation, technological advancements, and strategic partnerships to maintain market share and capture emerging opportunities. The market's future trajectory strongly depends on continued technological progress, policy support, and successful grid integration strategies, indicating substantial potential for further expansion in the coming years.
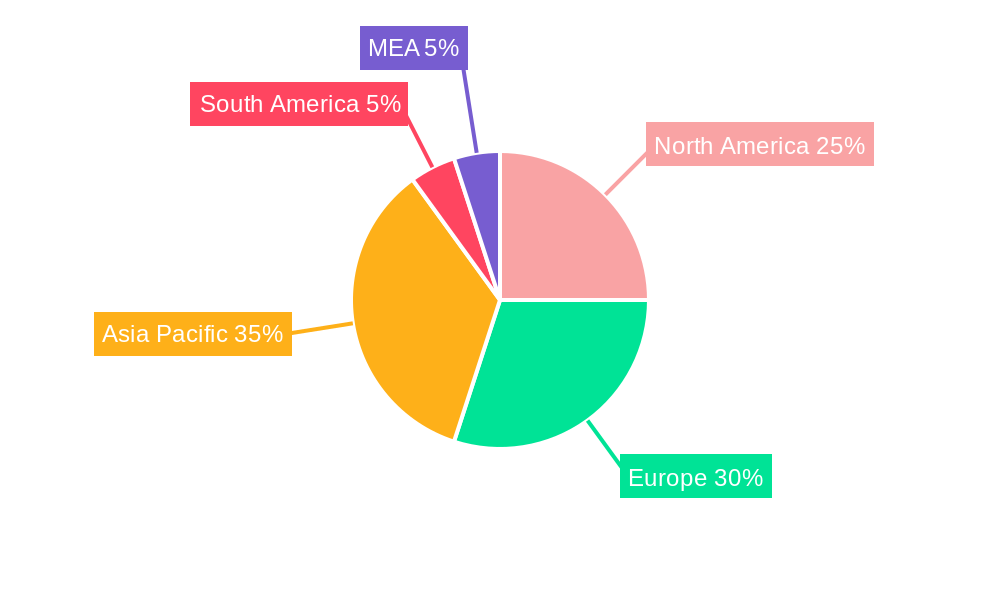
The market's regional distribution reveals a diverse landscape, with North America, Europe, and Asia Pacific representing the major markets. North America benefits from established infrastructure and supportive policies, while Europe leads in offshore wind technology and deployment. Asia Pacific, especially China and India, shows immense growth potential due to rapidly increasing energy demand and government initiatives to diversify energy sources. South America and the Middle East and Africa regions also present promising opportunities, although their development is subject to factors such as investment levels, grid infrastructure, and regulatory frameworks. The historical period (2019-2024) provides a baseline for assessing the market's current position and understanding past growth trends, allowing for more accurate projections of future market performance. Analyzing the market share of key players allows for insights into competitive dynamics and identifies potential areas for growth and disruption.
Global Wind Power Market: A Comprehensive Report (2019-2033)
This in-depth report provides a comprehensive analysis of the global wind power market, encompassing market size, growth projections, competitive landscape, and key industry trends from 2019 to 2033. The study period covers the historical period (2019-2024), the base year (2025), and the forecast period (2025-2033). This report is an essential resource for industry stakeholders, investors, and anyone seeking a detailed understanding of this rapidly evolving sector.
Global Wind Power Market Market Concentration & Innovation
This section analyzes the market concentration, identifying key players and their market share, and explores the drivers of innovation within the wind power sector. We examine regulatory frameworks, product substitutes, end-user trends, and mergers and acquisitions (M&A) activities that shape the market landscape. We quantify market concentration using metrics like the Herfindahl-Hirschman Index (HHI) where possible (xx if unavailable) and analyze M&A deal values, revealing the strategic shifts within the industry.
- Market Concentration: The global wind power market exhibits a (xx) level of concentration, with (xx) players dominating the market share. This is largely influenced by the significant capital investments required for manufacturing and deploying wind turbines.
- Innovation Drivers: Technological advancements in turbine design (e.g., larger rotor diameters, improved blade aerodynamics) and energy storage solutions are key drivers of innovation, enhancing efficiency and reducing costs. Government regulations and incentives (e.g., renewable portfolio standards, tax credits) also play a crucial role.
- Regulatory Frameworks: Government policies and regulations concerning renewable energy targets, emissions reduction goals, and grid integration standards directly influence market growth and technological development. Variations in these frameworks across different regions create diverse market dynamics.
- Product Substitutes: While solar power is a key competitor, wind power offers advantages in specific geographical locations and is often integrated into hybrid renewable energy projects. The cost competitiveness of wind power compared to fossil fuels remains a significant growth driver.
- End-User Trends: A growing emphasis on decarbonization across various sectors, including energy, transportation, and industry, is boosting demand for wind power. The increasing awareness of climate change and the need for sustainable energy solutions is a major end-user trend fueling market expansion.
- M&A Activities: The wind power sector has witnessed significant M&A activity, reflecting the strategic consolidation of the industry and the quest for economies of scale. While the exact figures vary, deal values typically range in the (xx Million) range, indicating considerable capital investment and market consolidation.
Global Wind Power Market Industry Trends & Insights
This section delves into the key industry trends influencing the global wind power market. We analyze market growth drivers, technological disruptions, evolving consumer preferences, and the competitive dynamics at play. We explore the impact of factors such as fluctuating energy prices, geopolitical events, and technological advancements on the overall market trajectory. Specific metrics like the Compound Annual Growth Rate (CAGR) and market penetration rates are provided for key segments. The analysis includes detailed exploration of (XXX). For instance, the increasing adoption of offshore wind farms, driven by technological advancements in turbine design and the availability of suitable sites, is a crucial trend. Further, the integration of wind power with smart grids and energy storage systems is creating new opportunities for growth and efficiency. The industry is witnessing a gradual shift toward larger and more efficient wind turbines, impacting both onshore and offshore projects.
Dominant Markets & Segments in Global Wind Power Market
This section identifies the leading regions, countries, and segments (Onshore and Offshore) within the global wind power market. We provide a comprehensive analysis of the factors driving the dominance of specific markets and segments.
Onshore Wind:
- Key Drivers: Established infrastructure, lower installation costs compared to offshore, supportive government policies in certain regions.
- Dominance Analysis: Onshore wind continues to be a significant segment, but growth rates are expected to (xx) due to land availability constraints in some regions.
Offshore Wind:
- Key Drivers: Higher capacity factors due to consistent wind speeds, access to large-scale energy resources, increasing government support and subsidies (as evidenced by the November 2023 UK government announcement).
- Dominance Analysis: Offshore wind is experiencing rapid growth, driven by technological advancements and significant policy support in several regions.
Global Wind Power Market Product Developments
Recent product innovations focus on increasing turbine capacity, improving efficiency through advanced blade designs and control systems, and reducing the levelized cost of energy (LCOE). The integration of smart technologies and digital solutions for predictive maintenance and optimized operations is gaining traction. These advancements contribute to enhanced reliability, performance, and reduced operational costs, making wind power increasingly competitive with traditional energy sources.
Report Scope & Segmentation Analysis
This report segments the global wind power market by location: onshore and offshore.
Onshore Wind: This segment covers wind turbines installed on land, addressing various factors including land availability, regulatory approvals, grid connection, and local environmental considerations. Growth in this segment is projected to reach (xx Million) by 2033, driven by cost reductions and continued government support in developing nations.
Offshore Wind: This segment focuses on wind turbines installed in coastal waters, deeper waters, and even floating platforms. The growth trajectory in this segment is significantly higher, with a projected value of (xx Million) by 2033, fueled by technological advancements (larger turbines, floating platforms), supportive government policies (e.g., increased subsidies as highlighted by the UK's November 2023 announcement), and the potential to harness vast offshore wind resources.
Key Drivers of Global Wind Power Market Growth
Several factors drive the growth of the global wind power market. These include decreasing costs of wind turbine technology, increasing government support and subsidies for renewable energy projects, growing awareness of climate change and the need for sustainable energy solutions, the growing demand for renewable energy in various sectors, and technological advancements such as improved turbine designs and energy storage solutions that enhance efficiency and reduce costs. The commitment from organizations like Mahindra Group (April 2024 investment) signifies the increasing private sector investment in the renewable energy sector further boosting the market.
Challenges in the Global Wind Power Market Sector
Challenges include the intermittency of wind power, dependence on favorable wind conditions, the high initial capital investment required for wind farm development, land acquisition and permitting challenges for onshore projects, grid infrastructure limitations, and competition from other renewable energy sources. Supply chain disruptions and the volatility of raw material prices can also impact project timelines and costs. These factors can negatively impact the overall growth rate and profitability of the sector, with potential economic effects measured in (xx Million) in lost investment or delayed projects.
Emerging Opportunities in Global Wind Power Market
Emerging opportunities include the expansion of offshore wind farms into deeper waters, the increasing use of hybrid renewable energy systems (as exemplified by Mahindra Group’s project), the development of advanced energy storage solutions to address the intermittency of wind power, and the integration of wind power with smart grids. Further, exploring new markets in developing countries with high renewable energy potential and leveraging advancements in artificial intelligence for optimized wind farm operations will create significant growth opportunities.
Leading Players in the Global Wind Power Market Market
- Siemens Gamesa Renewable Energy SA
- Suzlon Energy Limited
- Vestas Wind Systems AS
- Duke Energy Corporation
- E.ON SE
- NextEra Energy Inc
- Xinjiang Goldwind Science & Technology Co Ltd (Goldwind)
- Envision Energy
- Orsted AS
- EDF SA
- Dongfang Electric Corporation
- General Electric Company
- Aerodyn Energiesysteme GmbH
- Acciona Energia SA
Key Developments in Global Wind Power Market Industry
November 2023: The UK government significantly increased offshore wind farm subsidies, boosting the sector's attractiveness and accelerating project development. This policy change has immediate and long-term impacts on investment decisions, potentially attracting (xx Million) in additional investment.
April 2024: Mahindra Group's investment of USD 144 Million in solar and wind energy projects highlights the increasing private sector interest and signifies growing confidence in the renewable energy sector's profitability. This investment signals a move toward diversification and hybridization within the renewable energy space.
Strategic Outlook for Global Wind Power Market Market
The global wind power market is poised for significant growth, driven by the increasing demand for clean energy, supportive government policies, and technological advancements. The continued decrease in the cost of wind energy, coupled with the development of innovative solutions such as floating offshore wind farms, will further expand market potential. The focus on sustainable energy and the global transition to net-zero emissions will be pivotal in shaping the sector's long-term growth trajectory, promising a significant expansion of the market in the coming years.
Global Wind Power Market Segmentation
-
1. Location
- 1.1. Onshore
- 1.2. Offshore
Global Wind Power Market Segmentation By Geography
-
1. North America
- 1.1. United States
- 1.2. Canada
- 1.3. Rest of North America
-
2. Europe
- 2.1. United Kingdom
- 2.2. France
- 2.3. Norway
- 2.4. Germany
- 2.5. Spain
- 2.6. Turkey
- 2.7. Russia
- 2.8. NORDIC
- 2.9. Rest of Europe
-
3. Asia Pacific
- 3.1. China
- 3.2. India
- 3.3. Japan
- 3.4. Malaysia
- 3.5. Thailand
- 3.6. Indonesia
- 3.7. Vietnam
- 4. Rest of Asia Pacific
-
5. Middle East and Africa
- 5.1. United Arab Emirates
- 5.2. Egypt
- 5.3. Saudi Arabia
- 5.4. Nigeria
- 5.5. Qatar
- 6. Rest of Middle East and Africa
-
7. South America
- 7.1. Brazil
- 7.2. Chile
- 7.3. Argentina
- 7.4. Colombia
- 7.5. Rest of South America
Global Wind Power Market REPORT HIGHLIGHTS
| Aspects | Details |
|---|---|
| Study Period | 2019-2033 |
| Base Year | 2024 |
| Estimated Year | 2025 |
| Forecast Period | 2025-2033 |
| Historical Period | 2019-2024 |
| Growth Rate | CAGR of 27.87% from 2019-2033 |
| Segmentation |
|
Table of Contents
- 1. Introduction
- 1.1. Research Scope
- 1.2. Market Segmentation
- 1.3. Research Methodology
- 1.4. Definitions and Assumptions
- 2. Executive Summary
- 2.1. Introduction
- 3. Market Dynamics
- 3.1. Introduction
- 3.2. Market Drivers
- 3.2.1. 4.; Increasing Investments in Offshore Wind Power Projects4.; Supportive Government Policies
- 3.3. Market Restrains
- 3.3.1. 4.; Increasing Adopting of Alternative Clean Energy Sources (Ex
- 3.4. Market Trends
- 3.4.1. The Offshore Wind Power Sector is Expected to Witness Significant Growth
- 4. Market Factor Analysis
- 4.1. Porters Five Forces
- 4.2. Supply/Value Chain
- 4.3. PESTEL analysis
- 4.4. Market Entropy
- 4.5. Patent/Trademark Analysis
- 5. Global Wind Power Market Analysis, Insights and Forecast, 2019-2031
- 5.1. Market Analysis, Insights and Forecast - by Location
- 5.1.1. Onshore
- 5.1.2. Offshore
- 5.2. Market Analysis, Insights and Forecast - by Region
- 5.2.1. North America
- 5.2.2. Europe
- 5.2.3. Asia Pacific
- 5.2.4. Rest of Asia Pacific
- 5.2.5. Middle East and Africa
- 5.2.6. Rest of Middle East and Africa
- 5.2.7. South America
- 5.1. Market Analysis, Insights and Forecast - by Location
- 6. North America Global Wind Power Market Analysis, Insights and Forecast, 2019-2031
- 6.1. Market Analysis, Insights and Forecast - by Location
- 6.1.1. Onshore
- 6.1.2. Offshore
- 6.1. Market Analysis, Insights and Forecast - by Location
- 7. Europe Global Wind Power Market Analysis, Insights and Forecast, 2019-2031
- 7.1. Market Analysis, Insights and Forecast - by Location
- 7.1.1. Onshore
- 7.1.2. Offshore
- 7.1. Market Analysis, Insights and Forecast - by Location
- 8. Asia Pacific Global Wind Power Market Analysis, Insights and Forecast, 2019-2031
- 8.1. Market Analysis, Insights and Forecast - by Location
- 8.1.1. Onshore
- 8.1.2. Offshore
- 8.1. Market Analysis, Insights and Forecast - by Location
- 9. Rest of Asia Pacific Global Wind Power Market Analysis, Insights and Forecast, 2019-2031
- 9.1. Market Analysis, Insights and Forecast - by Location
- 9.1.1. Onshore
- 9.1.2. Offshore
- 9.1. Market Analysis, Insights and Forecast - by Location
- 10. Middle East and Africa Global Wind Power Market Analysis, Insights and Forecast, 2019-2031
- 10.1. Market Analysis, Insights and Forecast - by Location
- 10.1.1. Onshore
- 10.1.2. Offshore
- 10.1. Market Analysis, Insights and Forecast - by Location
- 11. Rest of Middle East and Africa Global Wind Power Market Analysis, Insights and Forecast, 2019-2031
- 11.1. Market Analysis, Insights and Forecast - by Location
- 11.1.1. Onshore
- 11.1.2. Offshore
- 11.1. Market Analysis, Insights and Forecast - by Location
- 12. South America Global Wind Power Market Analysis, Insights and Forecast, 2019-2031
- 12.1. Market Analysis, Insights and Forecast - by Location
- 12.1.1. Onshore
- 12.1.2. Offshore
- 12.1. Market Analysis, Insights and Forecast - by Location
- 13. North America Global Wind Power Market Analysis, Insights and Forecast, 2019-2031
- 13.1. Market Analysis, Insights and Forecast - By Country/Sub-region
- 13.1.1 United States
- 13.1.2 Canada
- 13.1.3 Mexico
- 14. Europe Global Wind Power Market Analysis, Insights and Forecast, 2019-2031
- 14.1. Market Analysis, Insights and Forecast - By Country/Sub-region
- 14.1.1 Germany
- 14.1.2 United Kingdom
- 14.1.3 France
- 14.1.4 Spain
- 14.1.5 Italy
- 14.1.6 Spain
- 14.1.7 Belgium
- 14.1.8 Netherland
- 14.1.9 Nordics
- 14.1.10 Rest of Europe
- 15. Asia Pacific Global Wind Power Market Analysis, Insights and Forecast, 2019-2031
- 15.1. Market Analysis, Insights and Forecast - By Country/Sub-region
- 15.1.1 China
- 15.1.2 Japan
- 15.1.3 India
- 15.1.4 South Korea
- 15.1.5 Southeast Asia
- 15.1.6 Australia
- 15.1.7 Indonesia
- 15.1.8 Phillipes
- 15.1.9 Singapore
- 15.1.10 Thailandc
- 15.1.11 Rest of Asia Pacific
- 16. South America Global Wind Power Market Analysis, Insights and Forecast, 2019-2031
- 16.1. Market Analysis, Insights and Forecast - By Country/Sub-region
- 16.1.1 Brazil
- 16.1.2 Argentina
- 16.1.3 Peru
- 16.1.4 Chile
- 16.1.5 Colombia
- 16.1.6 Ecuador
- 16.1.7 Venezuela
- 16.1.8 Rest of South America
- 17. North America Global Wind Power Market Analysis, Insights and Forecast, 2019-2031
- 17.1. Market Analysis, Insights and Forecast - By Country/Sub-region
- 17.1.1 United States
- 17.1.2 Canada
- 17.1.3 Mexico
- 18. MEA Global Wind Power Market Analysis, Insights and Forecast, 2019-2031
- 18.1. Market Analysis, Insights and Forecast - By Country/Sub-region
- 18.1.1 United Arab Emirates
- 18.1.2 Saudi Arabia
- 18.1.3 South Africa
- 18.1.4 Rest of Middle East and Africa
- 19. Competitive Analysis
- 19.1. Market Share Analysis 2024
- 19.2. Company Profiles
- 19.2.1 5 Siemens Gamesa Renewable Energy SA
- 19.2.1.1. Overview
- 19.2.1.2. Products
- 19.2.1.3. SWOT Analysis
- 19.2.1.4. Recent Developments
- 19.2.1.5. Financials (Based on Availability)
- 19.2.2 6 Suzlon Energy Limited
- 19.2.2.1. Overview
- 19.2.2.2. Products
- 19.2.2.3. SWOT Analysis
- 19.2.2.4. Recent Developments
- 19.2.2.5. Financials (Based on Availability)
- 19.2.3 7 Vestas Wind Systems AS
- 19.2.3.1. Overview
- 19.2.3.2. Products
- 19.2.3.3. SWOT Analysis
- 19.2.3.4. Recent Developments
- 19.2.3.5. Financials (Based on Availability)
- 19.2.4 Equipment Suppliers
- 19.2.4.1. Overview
- 19.2.4.2. Products
- 19.2.4.3. SWOT Analysis
- 19.2.4.4. Recent Developments
- 19.2.4.5. Financials (Based on Availability)
- 19.2.5 2 Duke Energy Corporation
- 19.2.5.1. Overview
- 19.2.5.2. Products
- 19.2.5.3. SWOT Analysis
- 19.2.5.4. Recent Developments
- 19.2.5.5. Financials (Based on Availability)
- 19.2.6 6 E ON SE
- 19.2.6.1. Overview
- 19.2.6.2. Products
- 19.2.6.3. SWOT Analysis
- 19.2.6.4. Recent Developments
- 19.2.6.5. Financials (Based on Availability)
- 19.2.7 5 NextEra Energy Inc
- 19.2.7.1. Overview
- 19.2.7.2. Products
- 19.2.7.3. SWOT Analysis
- 19.2.7.4. Recent Developments
- 19.2.7.5. Financials (Based on Availability)
- 19.2.8 4 Xinjiang Goldwind Science & Technology Co Ltd (Goldwind)
- 19.2.8.1. Overview
- 19.2.8.2. Products
- 19.2.8.3. SWOT Analysis
- 19.2.8.4. Recent Developments
- 19.2.8.5. Financials (Based on Availability)
- 19.2.9 2 Envision Energy
- 19.2.9.1. Overview
- 19.2.9.2. Products
- 19.2.9.3. SWOT Analysis
- 19.2.9.4. Recent Developments
- 19.2.9.5. Financials (Based on Availability)
- 19.2.10 4 Orsted AS
- 19.2.10.1. Overview
- 19.2.10.2. Products
- 19.2.10.3. SWOT Analysis
- 19.2.10.4. Recent Developments
- 19.2.10.5. Financials (Based on Availability)
- 19.2.11 Wind Farm Operators
- 19.2.11.1. Overview
- 19.2.11.2. Products
- 19.2.11.3. SWOT Analysis
- 19.2.11.4. Recent Developments
- 19.2.11.5. Financials (Based on Availability)
- 19.2.12 3 EDF SA
- 19.2.12.1. Overview
- 19.2.12.2. Products
- 19.2.12.3. SWOT Analysis
- 19.2.12.4. Recent Developments
- 19.2.12.5. Financials (Based on Availability)
- 19.2.13 8 Dongfang Electric Corporation*List Not Exhaustive 6 5 Market Share/Ranking Analysi
- 19.2.13.1. Overview
- 19.2.13.2. Products
- 19.2.13.3. SWOT Analysis
- 19.2.13.4. Recent Developments
- 19.2.13.5. Financials (Based on Availability)
- 19.2.14 3 General Electric Company
- 19.2.14.1. Overview
- 19.2.14.2. Products
- 19.2.14.3. SWOT Analysis
- 19.2.14.4. Recent Developments
- 19.2.14.5. Financials (Based on Availability)
- 19.2.15 1 Aerodyn Energiesysteme GmbH
- 19.2.15.1. Overview
- 19.2.15.2. Products
- 19.2.15.3. SWOT Analysis
- 19.2.15.4. Recent Developments
- 19.2.15.5. Financials (Based on Availability)
- 19.2.16 1 Acciona Energia SA
- 19.2.16.1. Overview
- 19.2.16.2. Products
- 19.2.16.3. SWOT Analysis
- 19.2.16.4. Recent Developments
- 19.2.16.5. Financials (Based on Availability)
- 19.2.1 5 Siemens Gamesa Renewable Energy SA
List of Figures
- Figure 1: Global Global Wind Power Market Revenue Breakdown (Million, %) by Region 2024 & 2032
- Figure 2: Global Global Wind Power Market Volume Breakdown (Thousand, %) by Region 2024 & 2032
- Figure 3: North America Global Wind Power Market Revenue (Million), by Country 2024 & 2032
- Figure 4: North America Global Wind Power Market Volume (Thousand), by Country 2024 & 2032
- Figure 5: North America Global Wind Power Market Revenue Share (%), by Country 2024 & 2032
- Figure 6: North America Global Wind Power Market Volume Share (%), by Country 2024 & 2032
- Figure 7: Europe Global Wind Power Market Revenue (Million), by Country 2024 & 2032
- Figure 8: Europe Global Wind Power Market Volume (Thousand), by Country 2024 & 2032
- Figure 9: Europe Global Wind Power Market Revenue Share (%), by Country 2024 & 2032
- Figure 10: Europe Global Wind Power Market Volume Share (%), by Country 2024 & 2032
- Figure 11: Asia Pacific Global Wind Power Market Revenue (Million), by Country 2024 & 2032
- Figure 12: Asia Pacific Global Wind Power Market Volume (Thousand), by Country 2024 & 2032
- Figure 13: Asia Pacific Global Wind Power Market Revenue Share (%), by Country 2024 & 2032
- Figure 14: Asia Pacific Global Wind Power Market Volume Share (%), by Country 2024 & 2032
- Figure 15: South America Global Wind Power Market Revenue (Million), by Country 2024 & 2032
- Figure 16: South America Global Wind Power Market Volume (Thousand), by Country 2024 & 2032
- Figure 17: South America Global Wind Power Market Revenue Share (%), by Country 2024 & 2032
- Figure 18: South America Global Wind Power Market Volume Share (%), by Country 2024 & 2032
- Figure 19: North America Global Wind Power Market Revenue (Million), by Country 2024 & 2032
- Figure 20: North America Global Wind Power Market Volume (Thousand), by Country 2024 & 2032
- Figure 21: North America Global Wind Power Market Revenue Share (%), by Country 2024 & 2032
- Figure 22: North America Global Wind Power Market Volume Share (%), by Country 2024 & 2032
- Figure 23: MEA Global Wind Power Market Revenue (Million), by Country 2024 & 2032
- Figure 24: MEA Global Wind Power Market Volume (Thousand), by Country 2024 & 2032
- Figure 25: MEA Global Wind Power Market Revenue Share (%), by Country 2024 & 2032
- Figure 26: MEA Global Wind Power Market Volume Share (%), by Country 2024 & 2032
- Figure 27: North America Global Wind Power Market Revenue (Million), by Location 2024 & 2032
- Figure 28: North America Global Wind Power Market Volume (Thousand), by Location 2024 & 2032
- Figure 29: North America Global Wind Power Market Revenue Share (%), by Location 2024 & 2032
- Figure 30: North America Global Wind Power Market Volume Share (%), by Location 2024 & 2032
- Figure 31: North America Global Wind Power Market Revenue (Million), by Country 2024 & 2032
- Figure 32: North America Global Wind Power Market Volume (Thousand), by Country 2024 & 2032
- Figure 33: North America Global Wind Power Market Revenue Share (%), by Country 2024 & 2032
- Figure 34: North America Global Wind Power Market Volume Share (%), by Country 2024 & 2032
- Figure 35: Europe Global Wind Power Market Revenue (Million), by Location 2024 & 2032
- Figure 36: Europe Global Wind Power Market Volume (Thousand), by Location 2024 & 2032
- Figure 37: Europe Global Wind Power Market Revenue Share (%), by Location 2024 & 2032
- Figure 38: Europe Global Wind Power Market Volume Share (%), by Location 2024 & 2032
- Figure 39: Europe Global Wind Power Market Revenue (Million), by Country 2024 & 2032
- Figure 40: Europe Global Wind Power Market Volume (Thousand), by Country 2024 & 2032
- Figure 41: Europe Global Wind Power Market Revenue Share (%), by Country 2024 & 2032
- Figure 42: Europe Global Wind Power Market Volume Share (%), by Country 2024 & 2032
- Figure 43: Asia Pacific Global Wind Power Market Revenue (Million), by Location 2024 & 2032
- Figure 44: Asia Pacific Global Wind Power Market Volume (Thousand), by Location 2024 & 2032
- Figure 45: Asia Pacific Global Wind Power Market Revenue Share (%), by Location 2024 & 2032
- Figure 46: Asia Pacific Global Wind Power Market Volume Share (%), by Location 2024 & 2032
- Figure 47: Asia Pacific Global Wind Power Market Revenue (Million), by Country 2024 & 2032
- Figure 48: Asia Pacific Global Wind Power Market Volume (Thousand), by Country 2024 & 2032
- Figure 49: Asia Pacific Global Wind Power Market Revenue Share (%), by Country 2024 & 2032
- Figure 50: Asia Pacific Global Wind Power Market Volume Share (%), by Country 2024 & 2032
- Figure 51: Rest of Asia Pacific Global Wind Power Market Revenue (Million), by Location 2024 & 2032
- Figure 52: Rest of Asia Pacific Global Wind Power Market Volume (Thousand), by Location 2024 & 2032
- Figure 53: Rest of Asia Pacific Global Wind Power Market Revenue Share (%), by Location 2024 & 2032
- Figure 54: Rest of Asia Pacific Global Wind Power Market Volume Share (%), by Location 2024 & 2032
- Figure 55: Rest of Asia Pacific Global Wind Power Market Revenue (Million), by Country 2024 & 2032
- Figure 56: Rest of Asia Pacific Global Wind Power Market Volume (Thousand), by Country 2024 & 2032
- Figure 57: Rest of Asia Pacific Global Wind Power Market Revenue Share (%), by Country 2024 & 2032
- Figure 58: Rest of Asia Pacific Global Wind Power Market Volume Share (%), by Country 2024 & 2032
- Figure 59: Middle East and Africa Global Wind Power Market Revenue (Million), by Location 2024 & 2032
- Figure 60: Middle East and Africa Global Wind Power Market Volume (Thousand), by Location 2024 & 2032
- Figure 61: Middle East and Africa Global Wind Power Market Revenue Share (%), by Location 2024 & 2032
- Figure 62: Middle East and Africa Global Wind Power Market Volume Share (%), by Location 2024 & 2032
- Figure 63: Middle East and Africa Global Wind Power Market Revenue (Million), by Country 2024 & 2032
- Figure 64: Middle East and Africa Global Wind Power Market Volume (Thousand), by Country 2024 & 2032
- Figure 65: Middle East and Africa Global Wind Power Market Revenue Share (%), by Country 2024 & 2032
- Figure 66: Middle East and Africa Global Wind Power Market Volume Share (%), by Country 2024 & 2032
- Figure 67: Rest of Middle East and Africa Global Wind Power Market Revenue (Million), by Location 2024 & 2032
- Figure 68: Rest of Middle East and Africa Global Wind Power Market Volume (Thousand), by Location 2024 & 2032
- Figure 69: Rest of Middle East and Africa Global Wind Power Market Revenue Share (%), by Location 2024 & 2032
- Figure 70: Rest of Middle East and Africa Global Wind Power Market Volume Share (%), by Location 2024 & 2032
- Figure 71: Rest of Middle East and Africa Global Wind Power Market Revenue (Million), by Country 2024 & 2032
- Figure 72: Rest of Middle East and Africa Global Wind Power Market Volume (Thousand), by Country 2024 & 2032
- Figure 73: Rest of Middle East and Africa Global Wind Power Market Revenue Share (%), by Country 2024 & 2032
- Figure 74: Rest of Middle East and Africa Global Wind Power Market Volume Share (%), by Country 2024 & 2032
- Figure 75: South America Global Wind Power Market Revenue (Million), by Location 2024 & 2032
- Figure 76: South America Global Wind Power Market Volume (Thousand), by Location 2024 & 2032
- Figure 77: South America Global Wind Power Market Revenue Share (%), by Location 2024 & 2032
- Figure 78: South America Global Wind Power Market Volume Share (%), by Location 2024 & 2032
- Figure 79: South America Global Wind Power Market Revenue (Million), by Country 2024 & 2032
- Figure 80: South America Global Wind Power Market Volume (Thousand), by Country 2024 & 2032
- Figure 81: South America Global Wind Power Market Revenue Share (%), by Country 2024 & 2032
- Figure 82: South America Global Wind Power Market Volume Share (%), by Country 2024 & 2032
List of Tables
- Table 1: Global Wind Power Market Revenue Million Forecast, by Region 2019 & 2032
- Table 2: Global Wind Power Market Volume Thousand Forecast, by Region 2019 & 2032
- Table 3: Global Wind Power Market Revenue Million Forecast, by Location 2019 & 2032
- Table 4: Global Wind Power Market Volume Thousand Forecast, by Location 2019 & 2032
- Table 5: Global Wind Power Market Revenue Million Forecast, by Region 2019 & 2032
- Table 6: Global Wind Power Market Volume Thousand Forecast, by Region 2019 & 2032
- Table 7: Global Wind Power Market Revenue Million Forecast, by Country 2019 & 2032
- Table 8: Global Wind Power Market Volume Thousand Forecast, by Country 2019 & 2032
- Table 9: United States Global Wind Power Market Revenue (Million) Forecast, by Application 2019 & 2032
- Table 10: United States Global Wind Power Market Volume (Thousand) Forecast, by Application 2019 & 2032
- Table 11: Canada Global Wind Power Market Revenue (Million) Forecast, by Application 2019 & 2032
- Table 12: Canada Global Wind Power Market Volume (Thousand) Forecast, by Application 2019 & 2032
- Table 13: Mexico Global Wind Power Market Revenue (Million) Forecast, by Application 2019 & 2032
- Table 14: Mexico Global Wind Power Market Volume (Thousand) Forecast, by Application 2019 & 2032
- Table 15: Global Wind Power Market Revenue Million Forecast, by Country 2019 & 2032
- Table 16: Global Wind Power Market Volume Thousand Forecast, by Country 2019 & 2032
- Table 17: Germany Global Wind Power Market Revenue (Million) Forecast, by Application 2019 & 2032
- Table 18: Germany Global Wind Power Market Volume (Thousand) Forecast, by Application 2019 & 2032
- Table 19: United Kingdom Global Wind Power Market Revenue (Million) Forecast, by Application 2019 & 2032
- Table 20: United Kingdom Global Wind Power Market Volume (Thousand) Forecast, by Application 2019 & 2032
- Table 21: France Global Wind Power Market Revenue (Million) Forecast, by Application 2019 & 2032
- Table 22: France Global Wind Power Market Volume (Thousand) Forecast, by Application 2019 & 2032
- Table 23: Spain Global Wind Power Market Revenue (Million) Forecast, by Application 2019 & 2032
- Table 24: Spain Global Wind Power Market Volume (Thousand) Forecast, by Application 2019 & 2032
- Table 25: Italy Global Wind Power Market Revenue (Million) Forecast, by Application 2019 & 2032
- Table 26: Italy Global Wind Power Market Volume (Thousand) Forecast, by Application 2019 & 2032
- Table 27: Spain Global Wind Power Market Revenue (Million) Forecast, by Application 2019 & 2032
- Table 28: Spain Global Wind Power Market Volume (Thousand) Forecast, by Application 2019 & 2032
- Table 29: Belgium Global Wind Power Market Revenue (Million) Forecast, by Application 2019 & 2032
- Table 30: Belgium Global Wind Power Market Volume (Thousand) Forecast, by Application 2019 & 2032
- Table 31: Netherland Global Wind Power Market Revenue (Million) Forecast, by Application 2019 & 2032
- Table 32: Netherland Global Wind Power Market Volume (Thousand) Forecast, by Application 2019 & 2032
- Table 33: Nordics Global Wind Power Market Revenue (Million) Forecast, by Application 2019 & 2032
- Table 34: Nordics Global Wind Power Market Volume (Thousand) Forecast, by Application 2019 & 2032
- Table 35: Rest of Europe Global Wind Power Market Revenue (Million) Forecast, by Application 2019 & 2032
- Table 36: Rest of Europe Global Wind Power Market Volume (Thousand) Forecast, by Application 2019 & 2032
- Table 37: Global Wind Power Market Revenue Million Forecast, by Country 2019 & 2032
- Table 38: Global Wind Power Market Volume Thousand Forecast, by Country 2019 & 2032
- Table 39: China Global Wind Power Market Revenue (Million) Forecast, by Application 2019 & 2032
- Table 40: China Global Wind Power Market Volume (Thousand) Forecast, by Application 2019 & 2032
- Table 41: Japan Global Wind Power Market Revenue (Million) Forecast, by Application 2019 & 2032
- Table 42: Japan Global Wind Power Market Volume (Thousand) Forecast, by Application 2019 & 2032
- Table 43: India Global Wind Power Market Revenue (Million) Forecast, by Application 2019 & 2032
- Table 44: India Global Wind Power Market Volume (Thousand) Forecast, by Application 2019 & 2032
- Table 45: South Korea Global Wind Power Market Revenue (Million) Forecast, by Application 2019 & 2032
- Table 46: South Korea Global Wind Power Market Volume (Thousand) Forecast, by Application 2019 & 2032
- Table 47: Southeast Asia Global Wind Power Market Revenue (Million) Forecast, by Application 2019 & 2032
- Table 48: Southeast Asia Global Wind Power Market Volume (Thousand) Forecast, by Application 2019 & 2032
- Table 49: Australia Global Wind Power Market Revenue (Million) Forecast, by Application 2019 & 2032
- Table 50: Australia Global Wind Power Market Volume (Thousand) Forecast, by Application 2019 & 2032
- Table 51: Indonesia Global Wind Power Market Revenue (Million) Forecast, by Application 2019 & 2032
- Table 52: Indonesia Global Wind Power Market Volume (Thousand) Forecast, by Application 2019 & 2032
- Table 53: Phillipes Global Wind Power Market Revenue (Million) Forecast, by Application 2019 & 2032
- Table 54: Phillipes Global Wind Power Market Volume (Thousand) Forecast, by Application 2019 & 2032
- Table 55: Singapore Global Wind Power Market Revenue (Million) Forecast, by Application 2019 & 2032
- Table 56: Singapore Global Wind Power Market Volume (Thousand) Forecast, by Application 2019 & 2032
- Table 57: Thailandc Global Wind Power Market Revenue (Million) Forecast, by Application 2019 & 2032
- Table 58: Thailandc Global Wind Power Market Volume (Thousand) Forecast, by Application 2019 & 2032
- Table 59: Rest of Asia Pacific Global Wind Power Market Revenue (Million) Forecast, by Application 2019 & 2032
- Table 60: Rest of Asia Pacific Global Wind Power Market Volume (Thousand) Forecast, by Application 2019 & 2032
- Table 61: Global Wind Power Market Revenue Million Forecast, by Country 2019 & 2032
- Table 62: Global Wind Power Market Volume Thousand Forecast, by Country 2019 & 2032
- Table 63: Brazil Global Wind Power Market Revenue (Million) Forecast, by Application 2019 & 2032
- Table 64: Brazil Global Wind Power Market Volume (Thousand) Forecast, by Application 2019 & 2032
- Table 65: Argentina Global Wind Power Market Revenue (Million) Forecast, by Application 2019 & 2032
- Table 66: Argentina Global Wind Power Market Volume (Thousand) Forecast, by Application 2019 & 2032
- Table 67: Peru Global Wind Power Market Revenue (Million) Forecast, by Application 2019 & 2032
- Table 68: Peru Global Wind Power Market Volume (Thousand) Forecast, by Application 2019 & 2032
- Table 69: Chile Global Wind Power Market Revenue (Million) Forecast, by Application 2019 & 2032
- Table 70: Chile Global Wind Power Market Volume (Thousand) Forecast, by Application 2019 & 2032
- Table 71: Colombia Global Wind Power Market Revenue (Million) Forecast, by Application 2019 & 2032
- Table 72: Colombia Global Wind Power Market Volume (Thousand) Forecast, by Application 2019 & 2032
- Table 73: Ecuador Global Wind Power Market Revenue (Million) Forecast, by Application 2019 & 2032
- Table 74: Ecuador Global Wind Power Market Volume (Thousand) Forecast, by Application 2019 & 2032
- Table 75: Venezuela Global Wind Power Market Revenue (Million) Forecast, by Application 2019 & 2032
- Table 76: Venezuela Global Wind Power Market Volume (Thousand) Forecast, by Application 2019 & 2032
- Table 77: Rest of South America Global Wind Power Market Revenue (Million) Forecast, by Application 2019 & 2032
- Table 78: Rest of South America Global Wind Power Market Volume (Thousand) Forecast, by Application 2019 & 2032
- Table 79: Global Wind Power Market Revenue Million Forecast, by Country 2019 & 2032
- Table 80: Global Wind Power Market Volume Thousand Forecast, by Country 2019 & 2032
- Table 81: United States Global Wind Power Market Revenue (Million) Forecast, by Application 2019 & 2032
- Table 82: United States Global Wind Power Market Volume (Thousand) Forecast, by Application 2019 & 2032
- Table 83: Canada Global Wind Power Market Revenue (Million) Forecast, by Application 2019 & 2032
- Table 84: Canada Global Wind Power Market Volume (Thousand) Forecast, by Application 2019 & 2032
- Table 85: Mexico Global Wind Power Market Revenue (Million) Forecast, by Application 2019 & 2032
- Table 86: Mexico Global Wind Power Market Volume (Thousand) Forecast, by Application 2019 & 2032
- Table 87: Global Wind Power Market Revenue Million Forecast, by Country 2019 & 2032
- Table 88: Global Wind Power Market Volume Thousand Forecast, by Country 2019 & 2032
- Table 89: United Arab Emirates Global Wind Power Market Revenue (Million) Forecast, by Application 2019 & 2032
- Table 90: United Arab Emirates Global Wind Power Market Volume (Thousand) Forecast, by Application 2019 & 2032
- Table 91: Saudi Arabia Global Wind Power Market Revenue (Million) Forecast, by Application 2019 & 2032
- Table 92: Saudi Arabia Global Wind Power Market Volume (Thousand) Forecast, by Application 2019 & 2032
- Table 93: South Africa Global Wind Power Market Revenue (Million) Forecast, by Application 2019 & 2032
- Table 94: South Africa Global Wind Power Market Volume (Thousand) Forecast, by Application 2019 & 2032
- Table 95: Rest of Middle East and Africa Global Wind Power Market Revenue (Million) Forecast, by Application 2019 & 2032
- Table 96: Rest of Middle East and Africa Global Wind Power Market Volume (Thousand) Forecast, by Application 2019 & 2032
- Table 97: Global Wind Power Market Revenue Million Forecast, by Location 2019 & 2032
- Table 98: Global Wind Power Market Volume Thousand Forecast, by Location 2019 & 2032
- Table 99: Global Wind Power Market Revenue Million Forecast, by Country 2019 & 2032
- Table 100: Global Wind Power Market Volume Thousand Forecast, by Country 2019 & 2032
- Table 101: United States Global Wind Power Market Revenue (Million) Forecast, by Application 2019 & 2032
- Table 102: United States Global Wind Power Market Volume (Thousand) Forecast, by Application 2019 & 2032
- Table 103: Canada Global Wind Power Market Revenue (Million) Forecast, by Application 2019 & 2032
- Table 104: Canada Global Wind Power Market Volume (Thousand) Forecast, by Application 2019 & 2032
- Table 105: Rest of North America Global Wind Power Market Revenue (Million) Forecast, by Application 2019 & 2032
- Table 106: Rest of North America Global Wind Power Market Volume (Thousand) Forecast, by Application 2019 & 2032
- Table 107: Global Wind Power Market Revenue Million Forecast, by Location 2019 & 2032
- Table 108: Global Wind Power Market Volume Thousand Forecast, by Location 2019 & 2032
- Table 109: Global Wind Power Market Revenue Million Forecast, by Country 2019 & 2032
- Table 110: Global Wind Power Market Volume Thousand Forecast, by Country 2019 & 2032
- Table 111: United Kingdom Global Wind Power Market Revenue (Million) Forecast, by Application 2019 & 2032
- Table 112: United Kingdom Global Wind Power Market Volume (Thousand) Forecast, by Application 2019 & 2032
- Table 113: France Global Wind Power Market Revenue (Million) Forecast, by Application 2019 & 2032
- Table 114: France Global Wind Power Market Volume (Thousand) Forecast, by Application 2019 & 2032
- Table 115: Norway Global Wind Power Market Revenue (Million) Forecast, by Application 2019 & 2032
- Table 116: Norway Global Wind Power Market Volume (Thousand) Forecast, by Application 2019 & 2032
- Table 117: Germany Global Wind Power Market Revenue (Million) Forecast, by Application 2019 & 2032
- Table 118: Germany Global Wind Power Market Volume (Thousand) Forecast, by Application 2019 & 2032
- Table 119: Spain Global Wind Power Market Revenue (Million) Forecast, by Application 2019 & 2032
- Table 120: Spain Global Wind Power Market Volume (Thousand) Forecast, by Application 2019 & 2032
- Table 121: Turkey Global Wind Power Market Revenue (Million) Forecast, by Application 2019 & 2032
- Table 122: Turkey Global Wind Power Market Volume (Thousand) Forecast, by Application 2019 & 2032
- Table 123: Russia Global Wind Power Market Revenue (Million) Forecast, by Application 2019 & 2032
- Table 124: Russia Global Wind Power Market Volume (Thousand) Forecast, by Application 2019 & 2032
- Table 125: NORDIC Global Wind Power Market Revenue (Million) Forecast, by Application 2019 & 2032
- Table 126: NORDIC Global Wind Power Market Volume (Thousand) Forecast, by Application 2019 & 2032
- Table 127: Rest of Europe Global Wind Power Market Revenue (Million) Forecast, by Application 2019 & 2032
- Table 128: Rest of Europe Global Wind Power Market Volume (Thousand) Forecast, by Application 2019 & 2032
- Table 129: Global Wind Power Market Revenue Million Forecast, by Location 2019 & 2032
- Table 130: Global Wind Power Market Volume Thousand Forecast, by Location 2019 & 2032
- Table 131: Global Wind Power Market Revenue Million Forecast, by Country 2019 & 2032
- Table 132: Global Wind Power Market Volume Thousand Forecast, by Country 2019 & 2032
- Table 133: China Global Wind Power Market Revenue (Million) Forecast, by Application 2019 & 2032
- Table 134: China Global Wind Power Market Volume (Thousand) Forecast, by Application 2019 & 2032
- Table 135: India Global Wind Power Market Revenue (Million) Forecast, by Application 2019 & 2032
- Table 136: India Global Wind Power Market Volume (Thousand) Forecast, by Application 2019 & 2032
- Table 137: Japan Global Wind Power Market Revenue (Million) Forecast, by Application 2019 & 2032
- Table 138: Japan Global Wind Power Market Volume (Thousand) Forecast, by Application 2019 & 2032
- Table 139: Malaysia Global Wind Power Market Revenue (Million) Forecast, by Application 2019 & 2032
- Table 140: Malaysia Global Wind Power Market Volume (Thousand) Forecast, by Application 2019 & 2032
- Table 141: Thailand Global Wind Power Market Revenue (Million) Forecast, by Application 2019 & 2032
- Table 142: Thailand Global Wind Power Market Volume (Thousand) Forecast, by Application 2019 & 2032
- Table 143: Indonesia Global Wind Power Market Revenue (Million) Forecast, by Application 2019 & 2032
- Table 144: Indonesia Global Wind Power Market Volume (Thousand) Forecast, by Application 2019 & 2032
- Table 145: Vietnam Global Wind Power Market Revenue (Million) Forecast, by Application 2019 & 2032
- Table 146: Vietnam Global Wind Power Market Volume (Thousand) Forecast, by Application 2019 & 2032
- Table 147: Global Wind Power Market Revenue Million Forecast, by Location 2019 & 2032
- Table 148: Global Wind Power Market Volume Thousand Forecast, by Location 2019 & 2032
- Table 149: Global Wind Power Market Revenue Million Forecast, by Country 2019 & 2032
- Table 150: Global Wind Power Market Volume Thousand Forecast, by Country 2019 & 2032
- Table 151: Global Wind Power Market Revenue Million Forecast, by Location 2019 & 2032
- Table 152: Global Wind Power Market Volume Thousand Forecast, by Location 2019 & 2032
- Table 153: Global Wind Power Market Revenue Million Forecast, by Country 2019 & 2032
- Table 154: Global Wind Power Market Volume Thousand Forecast, by Country 2019 & 2032
- Table 155: United Arab Emirates Global Wind Power Market Revenue (Million) Forecast, by Application 2019 & 2032
- Table 156: United Arab Emirates Global Wind Power Market Volume (Thousand) Forecast, by Application 2019 & 2032
- Table 157: Egypt Global Wind Power Market Revenue (Million) Forecast, by Application 2019 & 2032
- Table 158: Egypt Global Wind Power Market Volume (Thousand) Forecast, by Application 2019 & 2032
- Table 159: Saudi Arabia Global Wind Power Market Revenue (Million) Forecast, by Application 2019 & 2032
- Table 160: Saudi Arabia Global Wind Power Market Volume (Thousand) Forecast, by Application 2019 & 2032
- Table 161: Nigeria Global Wind Power Market Revenue (Million) Forecast, by Application 2019 & 2032
- Table 162: Nigeria Global Wind Power Market Volume (Thousand) Forecast, by Application 2019 & 2032
- Table 163: Qatar Global Wind Power Market Revenue (Million) Forecast, by Application 2019 & 2032
- Table 164: Qatar Global Wind Power Market Volume (Thousand) Forecast, by Application 2019 & 2032
- Table 165: Global Wind Power Market Revenue Million Forecast, by Location 2019 & 2032
- Table 166: Global Wind Power Market Volume Thousand Forecast, by Location 2019 & 2032
- Table 167: Global Wind Power Market Revenue Million Forecast, by Country 2019 & 2032
- Table 168: Global Wind Power Market Volume Thousand Forecast, by Country 2019 & 2032
- Table 169: Global Wind Power Market Revenue Million Forecast, by Location 2019 & 2032
- Table 170: Global Wind Power Market Volume Thousand Forecast, by Location 2019 & 2032
- Table 171: Global Wind Power Market Revenue Million Forecast, by Country 2019 & 2032
- Table 172: Global Wind Power Market Volume Thousand Forecast, by Country 2019 & 2032
- Table 173: Brazil Global Wind Power Market Revenue (Million) Forecast, by Application 2019 & 2032
- Table 174: Brazil Global Wind Power Market Volume (Thousand) Forecast, by Application 2019 & 2032
- Table 175: Chile Global Wind Power Market Revenue (Million) Forecast, by Application 2019 & 2032
- Table 176: Chile Global Wind Power Market Volume (Thousand) Forecast, by Application 2019 & 2032
- Table 177: Argentina Global Wind Power Market Revenue (Million) Forecast, by Application 2019 & 2032
- Table 178: Argentina Global Wind Power Market Volume (Thousand) Forecast, by Application 2019 & 2032
- Table 179: Colombia Global Wind Power Market Revenue (Million) Forecast, by Application 2019 & 2032
- Table 180: Colombia Global Wind Power Market Volume (Thousand) Forecast, by Application 2019 & 2032
- Table 181: Rest of South America Global Wind Power Market Revenue (Million) Forecast, by Application 2019 & 2032
- Table 182: Rest of South America Global Wind Power Market Volume (Thousand) Forecast, by Application 2019 & 2032
Frequently Asked Questions
1. What is the projected Compound Annual Growth Rate (CAGR) of the Global Wind Power Market?
The projected CAGR is approximately 27.87%.
2. Which companies are prominent players in the Global Wind Power Market?
Key companies in the market include 5 Siemens Gamesa Renewable Energy SA, 6 Suzlon Energy Limited, 7 Vestas Wind Systems AS, Equipment Suppliers, 2 Duke Energy Corporation, 6 E ON SE, 5 NextEra Energy Inc, 4 Xinjiang Goldwind Science & Technology Co Ltd (Goldwind), 2 Envision Energy, 4 Orsted AS, Wind Farm Operators, 3 EDF SA, 8 Dongfang Electric Corporation*List Not Exhaustive 6 5 Market Share/Ranking Analysi, 3 General Electric Company, 1 Aerodyn Energiesysteme GmbH, 1 Acciona Energia SA.
3. What are the main segments of the Global Wind Power Market?
The market segments include Location.
4. Can you provide details about the market size?
The market size is estimated to be USD XX Million as of 2022.
5. What are some drivers contributing to market growth?
4.; Increasing Investments in Offshore Wind Power Projects4.; Supportive Government Policies.
6. What are the notable trends driving market growth?
The Offshore Wind Power Sector is Expected to Witness Significant Growth.
7. Are there any restraints impacting market growth?
4.; Increasing Adopting of Alternative Clean Energy Sources (Ex: Solar. Hydro).
8. Can you provide examples of recent developments in the market?
April 2024: Mahindra Group, a conglomerate that spans technology to tractor manufacture, announced an investment of INR 12 billion (USD 144 million) in the establishment of solar and wind energy projects. The renewable projects are likely to be developed by Mahindra Susten, the group's renewable, with a hybrid capacity of 150 megawatts (MW).
9. What pricing options are available for accessing the report?
Pricing options include single-user, multi-user, and enterprise licenses priced at USD 4750, USD 5250, and USD 8750 respectively.
10. Is the market size provided in terms of value or volume?
The market size is provided in terms of value, measured in Million and volume, measured in Thousand.
11. Are there any specific market keywords associated with the report?
Yes, the market keyword associated with the report is "Global Wind Power Market," which aids in identifying and referencing the specific market segment covered.
12. How do I determine which pricing option suits my needs best?
The pricing options vary based on user requirements and access needs. Individual users may opt for single-user licenses, while businesses requiring broader access may choose multi-user or enterprise licenses for cost-effective access to the report.
13. Are there any additional resources or data provided in the Global Wind Power Market report?
While the report offers comprehensive insights, it's advisable to review the specific contents or supplementary materials provided to ascertain if additional resources or data are available.
14. How can I stay updated on further developments or reports in the Global Wind Power Market?
To stay informed about further developments, trends, and reports in the Global Wind Power Market, consider subscribing to industry newsletters, following relevant companies and organizations, or regularly checking reputable industry news sources and publications.
Methodology
Step 1 - Identification of Relevant Samples Size from Population Database


Step 2 - Approaches for Defining Global Market Size (Value, Volume* & Price*)

Note*: In applicable scenarios
Step 3 - Data Sources
Primary Research
- Web Analytics
- Survey Reports
- Research Institute
- Latest Research Reports
- Opinion Leaders
Secondary Research
- Annual Reports
- White Paper
- Latest Press Release
- Industry Association
- Paid Database
- Investor Presentations

Step 4 - Data Triangulation
Involves using different sources of information in order to increase the validity of a study
These sources are likely to be stakeholders in a program - participants, other researchers, program staff, other community members, and so on.
Then we put all data in single framework & apply various statistical tools to find out the dynamic on the market.
During the analysis stage, feedback from the stakeholder groups would be compared to determine areas of agreement as well as areas of divergence


