

Key Insights
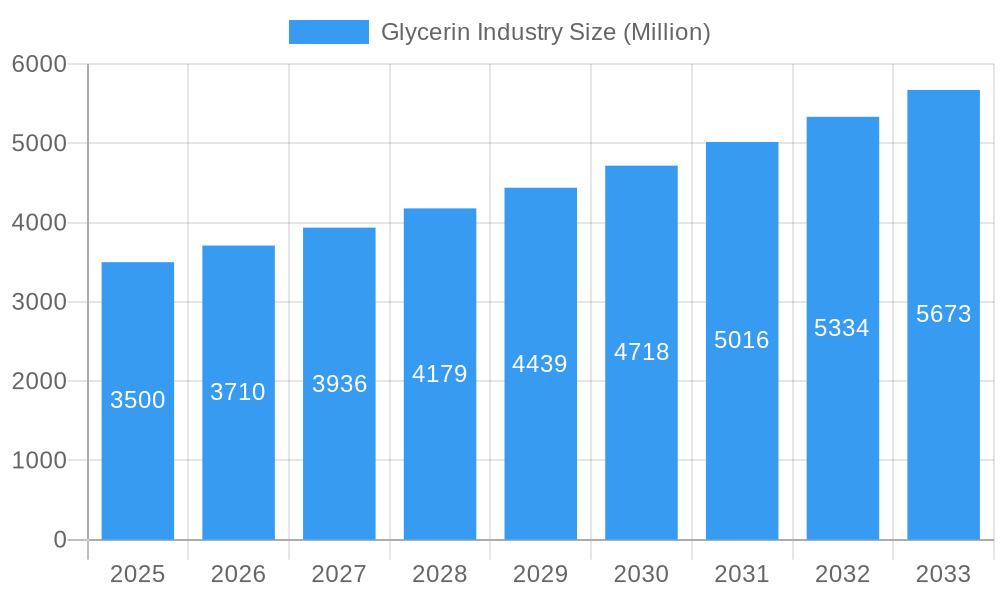
The global glycerin market is poised for significant expansion, fueled by escalating demand across a broad spectrum of industries. Projections indicate a Compound Annual Growth Rate (CAGR) of >6.00%. The market size is estimated at $4.78 billion in the base year 2025, driven by key sectors such as pharmaceuticals and personal care, leveraging glycerin's humectant and emollient properties. The burgeoning biofuels industry, a major glycerin byproduct source, further propels market growth. The food and beverage sector, utilizing glycerin as a sweetener and stabilizer, also contributes substantially to demand. A notable emerging trend is the increasing adoption of sustainable and bio-based glycerin production, driven by heightened environmental consciousness and advancements in refining technologies and alternative feedstock exploration.
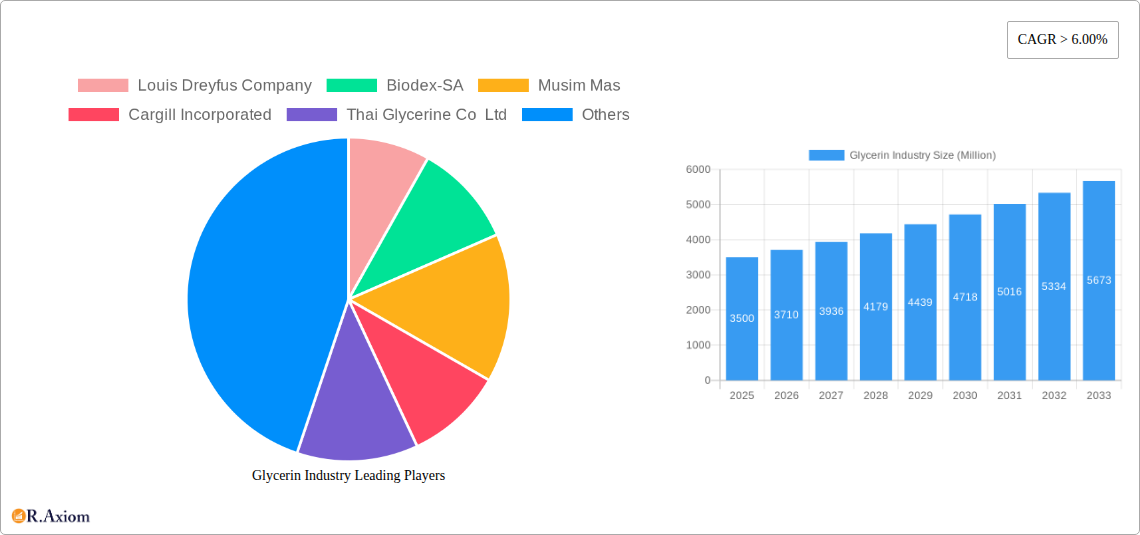
Glycerin Industry Market Size (In Million)
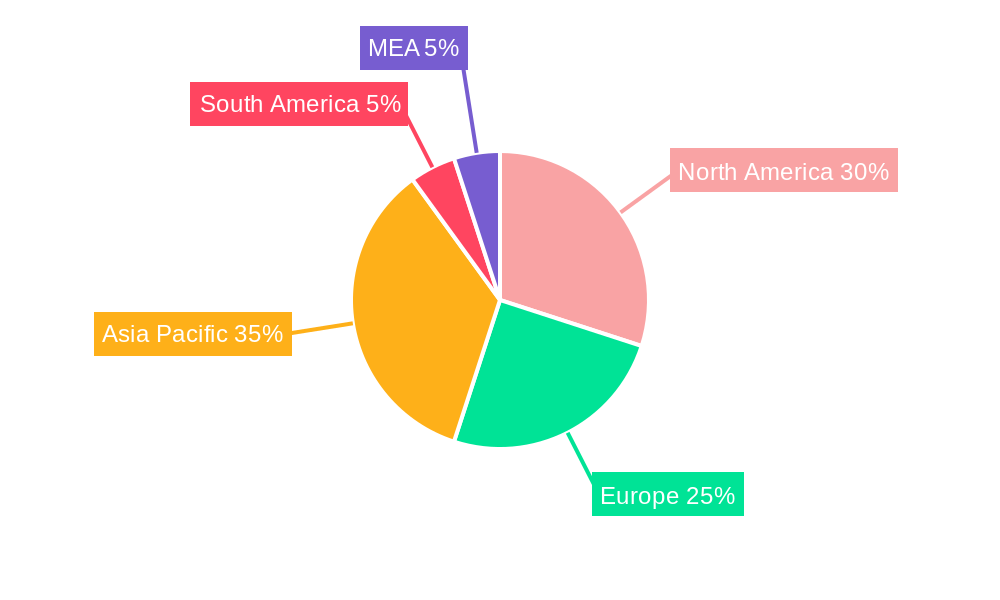
Market segmentation highlights the distinction between refined and crude glycerin, with refined grades commanding premium pricing due to their purity for specialized applications. Biodiesel remains the primary glycerin source, complemented by contributions from fatty acids and alcohols. Geographically, North America and Asia-Pacific are leading markets, with China and the United States as major consumer hubs. The competitive landscape is characterized by the presence of prominent global players such as Cargill, BASF, and Wilmar International. Future market trajectory will be shaped by sustained end-user demand, technological innovations enhancing efficiency and sustainability, and adept management of supply chain dynamics, including raw material sourcing and price volatility.
Glycerin Industry Company Market Share
Glycerin Industry Market Report: 2019-2033
This comprehensive report provides an in-depth analysis of the global glycerin industry, offering valuable insights for stakeholders, investors, and industry professionals. Covering the period from 2019 to 2033, with a focus on 2025, this report dissects market trends, competitive dynamics, and future growth potential. The report meticulously examines key segments, including application, grade, and source, and profiles leading players such as Cargill Incorporated, Wilmar International Ltd, and BASF SE, among others.
Glycerin Industry Market Concentration & Innovation
This section analyzes the competitive landscape of the glycerin industry, examining market concentration, innovation drivers, regulatory frameworks, and M&A activities. The market is characterized by a mix of large multinational corporations and smaller specialized players. Market share data reveals a moderately concentrated market, with the top five players holding approximately xx% of the global market share in 2024. Innovation is driven by the need for sustainable and high-quality glycerin sources, coupled with the demand for specialized grades for various applications. Regulatory frameworks concerning biofuel production and environmental sustainability significantly impact the industry. Product substitutes, such as propylene glycol, pose a competitive challenge, though glycerin's bio-based nature and versatility remain key advantages. Significant M&A activity has been observed, with deals valued at over USD xx Million in the last five years, reflecting consolidation efforts and expansion strategies within the industry.
- Market Concentration: Top 5 players hold approximately xx% market share (2024).
- M&A Activity: USD xx Million in deal value over the past five years.
- Innovation Drivers: Sustainability, specialized grades, and cost optimization.
- Regulatory Impact: Biofuel mandates and environmental regulations.
Glycerin Industry Industry Trends & Insights
The global glycerin market exhibits robust growth, driven by increasing demand across diverse sectors. The Compound Annual Growth Rate (CAGR) is projected at xx% during the forecast period (2025-2033). Rising consumer preference for natural and sustainable products fuels demand in personal care and food & beverage applications. Technological advancements in biodiesel production and downstream processing improve glycerin yield and quality. However, price volatility in raw materials and competition from synthetic substitutes present challenges. Market penetration in emerging economies is increasing as awareness of glycerin’s applications grows. The competitive landscape is dynamic, with ongoing innovation and strategic partnerships shaping industry dynamics.
Dominant Markets & Segments in Glycerin Industry
The personal care and cosmetics segment dominates the glycerin application market, driven by its humectant properties and increasing demand for natural ingredients. The refined glycerin grade holds the largest market share due to its higher purity and suitability for various applications. Biodiesel remains the primary source of glycerin, although other sources like fatty acids are gaining traction. Geographically, Asia-Pacific leads the global glycerin market due to its substantial biodiesel production and growing demand across various industries.
- Dominant Application: Personal Care & Cosmetics (driven by rising demand for natural ingredients).
- Dominant Grade: Refined Glycerin (due to its high purity and versatility).
- Dominant Source: Biodiesels (large-scale biodiesel production).
- Dominant Region: Asia-Pacific (strong biodiesel production and diverse industry demand).
Key Drivers for Dominance:
- Asia-Pacific: Rapid economic growth, expanding personal care market, increasing biodiesel production.
- Personal Care & Cosmetics: Growing consumer preference for natural and sustainable products.
- Refined Glycerin: Superior purity and versatility for diverse applications.
Glycerin Industry Product Developments
Recent product developments focus on high-purity glycerin grades tailored for specific applications. Innovations in glycerin purification and processing techniques enhance product quality and reduce production costs. New applications are emerging in the pharmaceutical and industrial chemicals sectors, driven by the need for sustainable and bio-based alternatives. Companies are strategically investing in research and development to improve glycerin’s performance and expand its applications.
Report Scope & Segmentation Analysis
This report segments the glycerin market by application (Pharmaceuticals, Food and Beverage, Alkyd Resins, Personal Care and Cosmetics, Industrial Chemicals, Polyether Polyols, Tobacco Humectants, Other Applications), grade (Crude Glycerin, Refined Glycerin), and source (Biodiesels, Fatty Acids, Fatty Alcohols, Other Sources). Each segment's growth projections, market sizes, and competitive dynamics are analyzed, offering a granular understanding of market opportunities.
Key Drivers of Glycerin Industry Growth
The glycerin market is driven by increasing demand from various sectors, particularly personal care and food & beverage. Rising biodiesel production globally leads to increased glycerin availability. Technological advancements in production and purification enhance efficiency and reduce costs. Favorable government policies and initiatives promoting bio-based materials further stimulate market growth.
Challenges in the Glycerin Industry Sector
Price fluctuations in raw materials, particularly crude glycerin, pose a significant challenge. Competition from synthetic substitutes and environmental regulations concerning biodiesel production impact profitability. Supply chain disruptions and logistical challenges can affect market stability. The industry also faces challenges related to efficient purification and the development of new applications for glycerin. Market penetration in some regions is hampered by a lack of awareness and limited infrastructure.
Emerging Opportunities in Glycerin Industry
Growing demand for sustainable and bio-based products presents significant opportunities. Innovations in glycerin-based formulations and applications, such as in bioplastics and pharmaceuticals, are expanding the market. Emerging economies offer substantial growth potential as consumer awareness and purchasing power increase. Strategic partnerships and investments in research and development will drive future market growth.
Leading Players in the Glycerin Industry Market
- Cargill Incorporated
- Wilmar International Ltd
- BASF SE
- Louis Dreyfus Company
- Biodex-SA
- Musim Mas
- Thai Glycerine Co Ltd
- RB FUELS
- Vantage Specialty Chemicals
- KLK OLEO
- Sebacic India Limited
- IOI Corporation Berhad
- P&G Chemicals
- Archer Daniels Midland Company
- Emery Oleochemicals
- Dow
- Munzer Bioindustrie GmbH
- Godrej Industries Limited
- Oleon NV
- Vance Group Ltd
- Kao Corporation
- Aemetis
Key Developments in Glycerin Industry Industry
- December 2022: Oleon invested USD 50 Million to acquire a blending plant, strengthening its oleochemicals division.
- October 2021: IOI Corporation Berhad announced the construction of a new 110,000 MT per year oleochemical plant, expected to be completed by Q2 2022.
Strategic Outlook for Glycerin Industry Market
The glycerin market is poised for continued growth, driven by increasing demand across various applications. Innovations in processing, purification, and formulation will drive market expansion. Investment in sustainable and efficient production methods will be critical for long-term success. Strategic partnerships and acquisitions will shape the competitive landscape, as companies strive to enhance their market positions and capture growth opportunities.
Glycerin Industry Segmentation
-
1. Grade
- 1.1. Crude Glycerin
- 1.2. Refined Glycerin
-
2. Source
- 2.1. Biodiesels
- 2.2. Fatty Acids
- 2.3. Fatty Alcohols
- 2.4. Other Sources
-
3. Application
- 3.1. Pharmaceuticals
- 3.2. Food and Beverage
- 3.3. Alkyd Resins
- 3.4. Personal Care and Cosmetics
- 3.5. Industrial Chemicals
- 3.6. Polyether Polyols
- 3.7. Tobacco Humectants
- 3.8. Other Applications
Glycerin Industry Segmentation By Geography
-
1. Asia Pacific
- 1.1. China
- 1.2. India
- 1.3. Japan
- 1.4. South Korea
- 1.5. Rest of Asia Pacific
-
2. North America
- 2.1. United States
- 2.2. Canada
- 2.3. Mexico
- 2.4. Rest of North America
-
3. Europe
- 3.1. Germany
- 3.2. United Kingdom
- 3.3. Italy
- 3.4. France
- 3.5. Rest of Europe
-
4. South America
- 4.1. Brazil
- 4.2. Argentina
- 4.3. Rest of South America
-
5. Middle East and Africa
- 5.1. Saudi Arabia
- 5.2. South Africa
- 5.3. United Arab Emirates
- 5.4. Rest of Middle East and Africa
Glycerin Industry Regional Market Share
Geographic Coverage of Glycerin Industry
Glycerin Industry REPORT HIGHLIGHTS
| Aspects | Details |
|---|---|
| Study Period | 2020-2034 |
| Base Year | 2025 |
| Estimated Year | 2026 |
| Forecast Period | 2026-2034 |
| Historical Period | 2020-2025 |
| Growth Rate | CAGR of 4.5% from 2020-2034 |
| Segmentation |
|
Table of Contents
- 1. Introduction
- 1.1. Research Scope
- 1.2. Market Segmentation
- 1.3. Research Objective
- 1.4. Definitions and Assumptions
- 2. Executive Summary
- 2.1. Market Snapshot
- 3. Market Dynamics
- 3.1. Market Drivers
- 3.2. Market Restrains
- 3.3. Market Trends
- 3.4. Market Opportunities
- 4. Market Factor Analysis
- 4.1. Porters Five Forces
- 4.1.1. Bargaining Power of Suppliers
- 4.1.2. Bargaining Power of Buyers
- 4.1.3. Threat of New Entrants
- 4.1.4. Threat of Substitutes
- 4.1.5. Competitive Rivalry
- 4.2. PESTEL analysis
- 4.3. BCG Analysis
- 4.3.1. Stars (High Growth, High Market Share)
- 4.3.2. Cash Cows (Low Growth, High Market Share)
- 4.3.3. Question Mark (High Growth, Low Market Share)
- 4.3.4. Dogs (Low Growth, Low Market Share)
- 4.4. Ansoff Matrix Analysis
- 4.5. Supply Chain Analysis
- 4.6. Regulatory Landscape
- 4.7. Current Market Potential and Opportunity Assessment (TAM–SAM–SOM Framework)
- 4.8. RAX Analyst Note
- 4.1. Porters Five Forces
- 5. Market Analysis, Insights and Forecast 2021-2033
- 5.1. Market Analysis, Insights and Forecast - by Grade
- 5.1.1. Crude Glycerin
- 5.1.2. Refined Glycerin
- 5.2. Market Analysis, Insights and Forecast - by Source
- 5.2.1. Biodiesels
- 5.2.2. Fatty Acids
- 5.2.3. Fatty Alcohols
- 5.2.4. Other Sources
- 5.3. Market Analysis, Insights and Forecast - by Application
- 5.3.1. Pharmaceuticals
- 5.3.2. Food and Beverage
- 5.3.3. Alkyd Resins
- 5.3.4. Personal Care and Cosmetics
- 5.3.5. Industrial Chemicals
- 5.3.6. Polyether Polyols
- 5.3.7. Tobacco Humectants
- 5.3.8. Other Applications
- 5.4. Market Analysis, Insights and Forecast - by Region
- 5.4.1. Asia Pacific
- 5.4.2. North America
- 5.4.3. Europe
- 5.4.4. South America
- 5.4.5. Middle East and Africa
- 5.1. Market Analysis, Insights and Forecast - by Grade
- 6. Global Glycerin Industry Analysis, Insights and Forecast, 2021-2033
- 6.1. Market Analysis, Insights and Forecast - by Grade
- 6.1.1. Crude Glycerin
- 6.1.2. Refined Glycerin
- 6.2. Market Analysis, Insights and Forecast - by Source
- 6.2.1. Biodiesels
- 6.2.2. Fatty Acids
- 6.2.3. Fatty Alcohols
- 6.2.4. Other Sources
- 6.3. Market Analysis, Insights and Forecast - by Application
- 6.3.1. Pharmaceuticals
- 6.3.2. Food and Beverage
- 6.3.3. Alkyd Resins
- 6.3.4. Personal Care and Cosmetics
- 6.3.5. Industrial Chemicals
- 6.3.6. Polyether Polyols
- 6.3.7. Tobacco Humectants
- 6.3.8. Other Applications
- 6.1. Market Analysis, Insights and Forecast - by Grade
- 7. Asia Pacific Glycerin Industry Analysis, Insights and Forecast, 2020-2032
- 7.1. Market Analysis, Insights and Forecast - by Grade
- 7.1.1. Crude Glycerin
- 7.1.2. Refined Glycerin
- 7.2. Market Analysis, Insights and Forecast - by Source
- 7.2.1. Biodiesels
- 7.2.2. Fatty Acids
- 7.2.3. Fatty Alcohols
- 7.2.4. Other Sources
- 7.3. Market Analysis, Insights and Forecast - by Application
- 7.3.1. Pharmaceuticals
- 7.3.2. Food and Beverage
- 7.3.3. Alkyd Resins
- 7.3.4. Personal Care and Cosmetics
- 7.3.5. Industrial Chemicals
- 7.3.6. Polyether Polyols
- 7.3.7. Tobacco Humectants
- 7.3.8. Other Applications
- 7.1. Market Analysis, Insights and Forecast - by Grade
- 8. North America Glycerin Industry Analysis, Insights and Forecast, 2020-2032
- 8.1. Market Analysis, Insights and Forecast - by Grade
- 8.1.1. Crude Glycerin
- 8.1.2. Refined Glycerin
- 8.2. Market Analysis, Insights and Forecast - by Source
- 8.2.1. Biodiesels
- 8.2.2. Fatty Acids
- 8.2.3. Fatty Alcohols
- 8.2.4. Other Sources
- 8.3. Market Analysis, Insights and Forecast - by Application
- 8.3.1. Pharmaceuticals
- 8.3.2. Food and Beverage
- 8.3.3. Alkyd Resins
- 8.3.4. Personal Care and Cosmetics
- 8.3.5. Industrial Chemicals
- 8.3.6. Polyether Polyols
- 8.3.7. Tobacco Humectants
- 8.3.8. Other Applications
- 8.1. Market Analysis, Insights and Forecast - by Grade
- 9. Europe Glycerin Industry Analysis, Insights and Forecast, 2020-2032
- 9.1. Market Analysis, Insights and Forecast - by Grade
- 9.1.1. Crude Glycerin
- 9.1.2. Refined Glycerin
- 9.2. Market Analysis, Insights and Forecast - by Source
- 9.2.1. Biodiesels
- 9.2.2. Fatty Acids
- 9.2.3. Fatty Alcohols
- 9.2.4. Other Sources
- 9.3. Market Analysis, Insights and Forecast - by Application
- 9.3.1. Pharmaceuticals
- 9.3.2. Food and Beverage
- 9.3.3. Alkyd Resins
- 9.3.4. Personal Care and Cosmetics
- 9.3.5. Industrial Chemicals
- 9.3.6. Polyether Polyols
- 9.3.7. Tobacco Humectants
- 9.3.8. Other Applications
- 9.1. Market Analysis, Insights and Forecast - by Grade
- 10. South America Glycerin Industry Analysis, Insights and Forecast, 2020-2032
- 10.1. Market Analysis, Insights and Forecast - by Grade
- 10.1.1. Crude Glycerin
- 10.1.2. Refined Glycerin
- 10.2. Market Analysis, Insights and Forecast - by Source
- 10.2.1. Biodiesels
- 10.2.2. Fatty Acids
- 10.2.3. Fatty Alcohols
- 10.2.4. Other Sources
- 10.3. Market Analysis, Insights and Forecast - by Application
- 10.3.1. Pharmaceuticals
- 10.3.2. Food and Beverage
- 10.3.3. Alkyd Resins
- 10.3.4. Personal Care and Cosmetics
- 10.3.5. Industrial Chemicals
- 10.3.6. Polyether Polyols
- 10.3.7. Tobacco Humectants
- 10.3.8. Other Applications
- 10.1. Market Analysis, Insights and Forecast - by Grade
- 11. Middle East and Africa Glycerin Industry Analysis, Insights and Forecast, 2020-2032
- 11.1. Market Analysis, Insights and Forecast - by Grade
- 11.1.1. Crude Glycerin
- 11.1.2. Refined Glycerin
- 11.2. Market Analysis, Insights and Forecast - by Source
- 11.2.1. Biodiesels
- 11.2.2. Fatty Acids
- 11.2.3. Fatty Alcohols
- 11.2.4. Other Sources
- 11.3. Market Analysis, Insights and Forecast - by Application
- 11.3.1. Pharmaceuticals
- 11.3.2. Food and Beverage
- 11.3.3. Alkyd Resins
- 11.3.4. Personal Care and Cosmetics
- 11.3.5. Industrial Chemicals
- 11.3.6. Polyether Polyols
- 11.3.7. Tobacco Humectants
- 11.3.8. Other Applications
- 11.1. Market Analysis, Insights and Forecast - by Grade
- 12. Competitive Analysis
- 12.1. Company Profiles
- 12.1.1 Louis Dreyfus Company
- 12.1.1.1. Company Overview
- 12.1.1.2. Products
- 12.1.1.3. Company Financials
- 12.1.1.4. SWOT Analysis
- 12.1.2 Biodex-SA
- 12.1.2.1. Company Overview
- 12.1.2.2. Products
- 12.1.2.3. Company Financials
- 12.1.2.4. SWOT Analysis
- 12.1.3 Musim Mas
- 12.1.3.1. Company Overview
- 12.1.3.2. Products
- 12.1.3.3. Company Financials
- 12.1.3.4. SWOT Analysis
- 12.1.4 Cargill Incorporated
- 12.1.4.1. Company Overview
- 12.1.4.2. Products
- 12.1.4.3. Company Financials
- 12.1.4.4. SWOT Analysis
- 12.1.5 Thai Glycerine Co Ltd
- 12.1.5.1. Company Overview
- 12.1.5.2. Products
- 12.1.5.3. Company Financials
- 12.1.5.4. SWOT Analysis
- 12.1.6 RB FUELS
- 12.1.6.1. Company Overview
- 12.1.6.2. Products
- 12.1.6.3. Company Financials
- 12.1.6.4. SWOT Analysis
- 12.1.7 Vantage Specialty Chemicals
- 12.1.7.1. Company Overview
- 12.1.7.2. Products
- 12.1.7.3. Company Financials
- 12.1.7.4. SWOT Analysis
- 12.1.8 KLK OLEO
- 12.1.8.1. Company Overview
- 12.1.8.2. Products
- 12.1.8.3. Company Financials
- 12.1.8.4. SWOT Analysis
- 12.1.9 Sebacic India Limited
- 12.1.9.1. Company Overview
- 12.1.9.2. Products
- 12.1.9.3. Company Financials
- 12.1.9.4. SWOT Analysis
- 12.1.10 IOI Corporation Berhad
- 12.1.10.1. Company Overview
- 12.1.10.2. Products
- 12.1.10.3. Company Financials
- 12.1.10.4. SWOT Analysis
- 12.1.11 Wilmar International Ltd
- 12.1.11.1. Company Overview
- 12.1.11.2. Products
- 12.1.11.3. Company Financials
- 12.1.11.4. SWOT Analysis
- 12.1.12 P&G Chemicals
- 12.1.12.1. Company Overview
- 12.1.12.2. Products
- 12.1.12.3. Company Financials
- 12.1.12.4. SWOT Analysis
- 12.1.13 Archer Daniels Midland Company
- 12.1.13.1. Company Overview
- 12.1.13.2. Products
- 12.1.13.3. Company Financials
- 12.1.13.4. SWOT Analysis
- 12.1.14 Emery Oleochemicals
- 12.1.14.1. Company Overview
- 12.1.14.2. Products
- 12.1.14.3. Company Financials
- 12.1.14.4. SWOT Analysis
- 12.1.15 BASF SE
- 12.1.15.1. Company Overview
- 12.1.15.2. Products
- 12.1.15.3. Company Financials
- 12.1.15.4. SWOT Analysis
- 12.1.16 Dow
- 12.1.16.1. Company Overview
- 12.1.16.2. Products
- 12.1.16.3. Company Financials
- 12.1.16.4. SWOT Analysis
- 12.1.17 Munzer Bioindustrie GmbH
- 12.1.17.1. Company Overview
- 12.1.17.2. Products
- 12.1.17.3. Company Financials
- 12.1.17.4. SWOT Analysis
- 12.1.18 Godrej Industries Limited
- 12.1.18.1. Company Overview
- 12.1.18.2. Products
- 12.1.18.3. Company Financials
- 12.1.18.4. SWOT Analysis
- 12.1.19 Oleon NV
- 12.1.19.1. Company Overview
- 12.1.19.2. Products
- 12.1.19.3. Company Financials
- 12.1.19.4. SWOT Analysis
- 12.1.20 Vance Group Ltd
- 12.1.20.1. Company Overview
- 12.1.20.2. Products
- 12.1.20.3. Company Financials
- 12.1.20.4. SWOT Analysis
- 12.1.21 Kao Corporation
- 12.1.21.1. Company Overview
- 12.1.21.2. Products
- 12.1.21.3. Company Financials
- 12.1.21.4. SWOT Analysis
- 12.1.22 Aemetis
- 12.1.22.1. Company Overview
- 12.1.22.2. Products
- 12.1.22.3. Company Financials
- 12.1.22.4. SWOT Analysis
- 12.1.1 Louis Dreyfus Company
- 12.2. Market Entropy
- 12.2.1 Company's Key Areas Served
- 12.2.2 Recent Developments
- 12.3. Company Market Share Analysis 2025
- 12.3.1 Top 5 Companies Market Share Analysis
- 12.3.2 Top 3 Companies Market Share Analysis
- 12.4. List of Potential Customers
- 13. Research Methodology
List of Figures
- Figure 1: Global Glycerin Industry Revenue Breakdown (million, %) by Region 2025 & 2033
- Figure 2: Global Glycerin Industry Volume Breakdown (K Tons, %) by Region 2025 & 2033
- Figure 3: Asia Pacific Glycerin Industry Revenue (million), by Grade 2025 & 2033
- Figure 4: Asia Pacific Glycerin Industry Volume (K Tons), by Grade 2025 & 2033
- Figure 5: Asia Pacific Glycerin Industry Revenue Share (%), by Grade 2025 & 2033
- Figure 6: Asia Pacific Glycerin Industry Volume Share (%), by Grade 2025 & 2033
- Figure 7: Asia Pacific Glycerin Industry Revenue (million), by Source 2025 & 2033
- Figure 8: Asia Pacific Glycerin Industry Volume (K Tons), by Source 2025 & 2033
- Figure 9: Asia Pacific Glycerin Industry Revenue Share (%), by Source 2025 & 2033
- Figure 10: Asia Pacific Glycerin Industry Volume Share (%), by Source 2025 & 2033
- Figure 11: Asia Pacific Glycerin Industry Revenue (million), by Application 2025 & 2033
- Figure 12: Asia Pacific Glycerin Industry Volume (K Tons), by Application 2025 & 2033
- Figure 13: Asia Pacific Glycerin Industry Revenue Share (%), by Application 2025 & 2033
- Figure 14: Asia Pacific Glycerin Industry Volume Share (%), by Application 2025 & 2033
- Figure 15: Asia Pacific Glycerin Industry Revenue (million), by Country 2025 & 2033
- Figure 16: Asia Pacific Glycerin Industry Volume (K Tons), by Country 2025 & 2033
- Figure 17: Asia Pacific Glycerin Industry Revenue Share (%), by Country 2025 & 2033
- Figure 18: Asia Pacific Glycerin Industry Volume Share (%), by Country 2025 & 2033
- Figure 19: North America Glycerin Industry Revenue (million), by Grade 2025 & 2033
- Figure 20: North America Glycerin Industry Volume (K Tons), by Grade 2025 & 2033
- Figure 21: North America Glycerin Industry Revenue Share (%), by Grade 2025 & 2033
- Figure 22: North America Glycerin Industry Volume Share (%), by Grade 2025 & 2033
- Figure 23: North America Glycerin Industry Revenue (million), by Source 2025 & 2033
- Figure 24: North America Glycerin Industry Volume (K Tons), by Source 2025 & 2033
- Figure 25: North America Glycerin Industry Revenue Share (%), by Source 2025 & 2033
- Figure 26: North America Glycerin Industry Volume Share (%), by Source 2025 & 2033
- Figure 27: North America Glycerin Industry Revenue (million), by Application 2025 & 2033
- Figure 28: North America Glycerin Industry Volume (K Tons), by Application 2025 & 2033
- Figure 29: North America Glycerin Industry Revenue Share (%), by Application 2025 & 2033
- Figure 30: North America Glycerin Industry Volume Share (%), by Application 2025 & 2033
- Figure 31: North America Glycerin Industry Revenue (million), by Country 2025 & 2033
- Figure 32: North America Glycerin Industry Volume (K Tons), by Country 2025 & 2033
- Figure 33: North America Glycerin Industry Revenue Share (%), by Country 2025 & 2033
- Figure 34: North America Glycerin Industry Volume Share (%), by Country 2025 & 2033
- Figure 35: Europe Glycerin Industry Revenue (million), by Grade 2025 & 2033
- Figure 36: Europe Glycerin Industry Volume (K Tons), by Grade 2025 & 2033
- Figure 37: Europe Glycerin Industry Revenue Share (%), by Grade 2025 & 2033
- Figure 38: Europe Glycerin Industry Volume Share (%), by Grade 2025 & 2033
- Figure 39: Europe Glycerin Industry Revenue (million), by Source 2025 & 2033
- Figure 40: Europe Glycerin Industry Volume (K Tons), by Source 2025 & 2033
- Figure 41: Europe Glycerin Industry Revenue Share (%), by Source 2025 & 2033
- Figure 42: Europe Glycerin Industry Volume Share (%), by Source 2025 & 2033
- Figure 43: Europe Glycerin Industry Revenue (million), by Application 2025 & 2033
- Figure 44: Europe Glycerin Industry Volume (K Tons), by Application 2025 & 2033
- Figure 45: Europe Glycerin Industry Revenue Share (%), by Application 2025 & 2033
- Figure 46: Europe Glycerin Industry Volume Share (%), by Application 2025 & 2033
- Figure 47: Europe Glycerin Industry Revenue (million), by Country 2025 & 2033
- Figure 48: Europe Glycerin Industry Volume (K Tons), by Country 2025 & 2033
- Figure 49: Europe Glycerin Industry Revenue Share (%), by Country 2025 & 2033
- Figure 50: Europe Glycerin Industry Volume Share (%), by Country 2025 & 2033
- Figure 51: South America Glycerin Industry Revenue (million), by Grade 2025 & 2033
- Figure 52: South America Glycerin Industry Volume (K Tons), by Grade 2025 & 2033
- Figure 53: South America Glycerin Industry Revenue Share (%), by Grade 2025 & 2033
- Figure 54: South America Glycerin Industry Volume Share (%), by Grade 2025 & 2033
- Figure 55: South America Glycerin Industry Revenue (million), by Source 2025 & 2033
- Figure 56: South America Glycerin Industry Volume (K Tons), by Source 2025 & 2033
- Figure 57: South America Glycerin Industry Revenue Share (%), by Source 2025 & 2033
- Figure 58: South America Glycerin Industry Volume Share (%), by Source 2025 & 2033
- Figure 59: South America Glycerin Industry Revenue (million), by Application 2025 & 2033
- Figure 60: South America Glycerin Industry Volume (K Tons), by Application 2025 & 2033
- Figure 61: South America Glycerin Industry Revenue Share (%), by Application 2025 & 2033
- Figure 62: South America Glycerin Industry Volume Share (%), by Application 2025 & 2033
- Figure 63: South America Glycerin Industry Revenue (million), by Country 2025 & 2033
- Figure 64: South America Glycerin Industry Volume (K Tons), by Country 2025 & 2033
- Figure 65: South America Glycerin Industry Revenue Share (%), by Country 2025 & 2033
- Figure 66: South America Glycerin Industry Volume Share (%), by Country 2025 & 2033
- Figure 67: Middle East and Africa Glycerin Industry Revenue (million), by Grade 2025 & 2033
- Figure 68: Middle East and Africa Glycerin Industry Volume (K Tons), by Grade 2025 & 2033
- Figure 69: Middle East and Africa Glycerin Industry Revenue Share (%), by Grade 2025 & 2033
- Figure 70: Middle East and Africa Glycerin Industry Volume Share (%), by Grade 2025 & 2033
- Figure 71: Middle East and Africa Glycerin Industry Revenue (million), by Source 2025 & 2033
- Figure 72: Middle East and Africa Glycerin Industry Volume (K Tons), by Source 2025 & 2033
- Figure 73: Middle East and Africa Glycerin Industry Revenue Share (%), by Source 2025 & 2033
- Figure 74: Middle East and Africa Glycerin Industry Volume Share (%), by Source 2025 & 2033
- Figure 75: Middle East and Africa Glycerin Industry Revenue (million), by Application 2025 & 2033
- Figure 76: Middle East and Africa Glycerin Industry Volume (K Tons), by Application 2025 & 2033
- Figure 77: Middle East and Africa Glycerin Industry Revenue Share (%), by Application 2025 & 2033
- Figure 78: Middle East and Africa Glycerin Industry Volume Share (%), by Application 2025 & 2033
- Figure 79: Middle East and Africa Glycerin Industry Revenue (million), by Country 2025 & 2033
- Figure 80: Middle East and Africa Glycerin Industry Volume (K Tons), by Country 2025 & 2033
- Figure 81: Middle East and Africa Glycerin Industry Revenue Share (%), by Country 2025 & 2033
- Figure 82: Middle East and Africa Glycerin Industry Volume Share (%), by Country 2025 & 2033
List of Tables
- Table 1: Global Glycerin Industry Revenue million Forecast, by Grade 2020 & 2033
- Table 2: Global Glycerin Industry Volume K Tons Forecast, by Grade 2020 & 2033
- Table 3: Global Glycerin Industry Revenue million Forecast, by Source 2020 & 2033
- Table 4: Global Glycerin Industry Volume K Tons Forecast, by Source 2020 & 2033
- Table 5: Global Glycerin Industry Revenue million Forecast, by Application 2020 & 2033
- Table 6: Global Glycerin Industry Volume K Tons Forecast, by Application 2020 & 2033
- Table 7: Global Glycerin Industry Revenue million Forecast, by Region 2020 & 2033
- Table 8: Global Glycerin Industry Volume K Tons Forecast, by Region 2020 & 2033
- Table 9: Global Glycerin Industry Revenue million Forecast, by Grade 2020 & 2033
- Table 10: Global Glycerin Industry Volume K Tons Forecast, by Grade 2020 & 2033
- Table 11: Global Glycerin Industry Revenue million Forecast, by Source 2020 & 2033
- Table 12: Global Glycerin Industry Volume K Tons Forecast, by Source 2020 & 2033
- Table 13: Global Glycerin Industry Revenue million Forecast, by Application 2020 & 2033
- Table 14: Global Glycerin Industry Volume K Tons Forecast, by Application 2020 & 2033
- Table 15: Global Glycerin Industry Revenue million Forecast, by Country 2020 & 2033
- Table 16: Global Glycerin Industry Volume K Tons Forecast, by Country 2020 & 2033
- Table 17: China Glycerin Industry Revenue (million) Forecast, by Application 2020 & 2033
- Table 18: China Glycerin Industry Volume (K Tons) Forecast, by Application 2020 & 2033
- Table 19: India Glycerin Industry Revenue (million) Forecast, by Application 2020 & 2033
- Table 20: India Glycerin Industry Volume (K Tons) Forecast, by Application 2020 & 2033
- Table 21: Japan Glycerin Industry Revenue (million) Forecast, by Application 2020 & 2033
- Table 22: Japan Glycerin Industry Volume (K Tons) Forecast, by Application 2020 & 2033
- Table 23: South Korea Glycerin Industry Revenue (million) Forecast, by Application 2020 & 2033
- Table 24: South Korea Glycerin Industry Volume (K Tons) Forecast, by Application 2020 & 2033
- Table 25: Rest of Asia Pacific Glycerin Industry Revenue (million) Forecast, by Application 2020 & 2033
- Table 26: Rest of Asia Pacific Glycerin Industry Volume (K Tons) Forecast, by Application 2020 & 2033
- Table 27: Global Glycerin Industry Revenue million Forecast, by Grade 2020 & 2033
- Table 28: Global Glycerin Industry Volume K Tons Forecast, by Grade 2020 & 2033
- Table 29: Global Glycerin Industry Revenue million Forecast, by Source 2020 & 2033
- Table 30: Global Glycerin Industry Volume K Tons Forecast, by Source 2020 & 2033
- Table 31: Global Glycerin Industry Revenue million Forecast, by Application 2020 & 2033
- Table 32: Global Glycerin Industry Volume K Tons Forecast, by Application 2020 & 2033
- Table 33: Global Glycerin Industry Revenue million Forecast, by Country 2020 & 2033
- Table 34: Global Glycerin Industry Volume K Tons Forecast, by Country 2020 & 2033
- Table 35: United States Glycerin Industry Revenue (million) Forecast, by Application 2020 & 2033
- Table 36: United States Glycerin Industry Volume (K Tons) Forecast, by Application 2020 & 2033
- Table 37: Canada Glycerin Industry Revenue (million) Forecast, by Application 2020 & 2033
- Table 38: Canada Glycerin Industry Volume (K Tons) Forecast, by Application 2020 & 2033
- Table 39: Mexico Glycerin Industry Revenue (million) Forecast, by Application 2020 & 2033
- Table 40: Mexico Glycerin Industry Volume (K Tons) Forecast, by Application 2020 & 2033
- Table 41: Rest of North America Glycerin Industry Revenue (million) Forecast, by Application 2020 & 2033
- Table 42: Rest of North America Glycerin Industry Volume (K Tons) Forecast, by Application 2020 & 2033
- Table 43: Global Glycerin Industry Revenue million Forecast, by Grade 2020 & 2033
- Table 44: Global Glycerin Industry Volume K Tons Forecast, by Grade 2020 & 2033
- Table 45: Global Glycerin Industry Revenue million Forecast, by Source 2020 & 2033
- Table 46: Global Glycerin Industry Volume K Tons Forecast, by Source 2020 & 2033
- Table 47: Global Glycerin Industry Revenue million Forecast, by Application 2020 & 2033
- Table 48: Global Glycerin Industry Volume K Tons Forecast, by Application 2020 & 2033
- Table 49: Global Glycerin Industry Revenue million Forecast, by Country 2020 & 2033
- Table 50: Global Glycerin Industry Volume K Tons Forecast, by Country 2020 & 2033
- Table 51: Germany Glycerin Industry Revenue (million) Forecast, by Application 2020 & 2033
- Table 52: Germany Glycerin Industry Volume (K Tons) Forecast, by Application 2020 & 2033
- Table 53: United Kingdom Glycerin Industry Revenue (million) Forecast, by Application 2020 & 2033
- Table 54: United Kingdom Glycerin Industry Volume (K Tons) Forecast, by Application 2020 & 2033
- Table 55: Italy Glycerin Industry Revenue (million) Forecast, by Application 2020 & 2033
- Table 56: Italy Glycerin Industry Volume (K Tons) Forecast, by Application 2020 & 2033
- Table 57: France Glycerin Industry Revenue (million) Forecast, by Application 2020 & 2033
- Table 58: France Glycerin Industry Volume (K Tons) Forecast, by Application 2020 & 2033
- Table 59: Rest of Europe Glycerin Industry Revenue (million) Forecast, by Application 2020 & 2033
- Table 60: Rest of Europe Glycerin Industry Volume (K Tons) Forecast, by Application 2020 & 2033
- Table 61: Global Glycerin Industry Revenue million Forecast, by Grade 2020 & 2033
- Table 62: Global Glycerin Industry Volume K Tons Forecast, by Grade 2020 & 2033
- Table 63: Global Glycerin Industry Revenue million Forecast, by Source 2020 & 2033
- Table 64: Global Glycerin Industry Volume K Tons Forecast, by Source 2020 & 2033
- Table 65: Global Glycerin Industry Revenue million Forecast, by Application 2020 & 2033
- Table 66: Global Glycerin Industry Volume K Tons Forecast, by Application 2020 & 2033
- Table 67: Global Glycerin Industry Revenue million Forecast, by Country 2020 & 2033
- Table 68: Global Glycerin Industry Volume K Tons Forecast, by Country 2020 & 2033
- Table 69: Brazil Glycerin Industry Revenue (million) Forecast, by Application 2020 & 2033
- Table 70: Brazil Glycerin Industry Volume (K Tons) Forecast, by Application 2020 & 2033
- Table 71: Argentina Glycerin Industry Revenue (million) Forecast, by Application 2020 & 2033
- Table 72: Argentina Glycerin Industry Volume (K Tons) Forecast, by Application 2020 & 2033
- Table 73: Rest of South America Glycerin Industry Revenue (million) Forecast, by Application 2020 & 2033
- Table 74: Rest of South America Glycerin Industry Volume (K Tons) Forecast, by Application 2020 & 2033
- Table 75: Global Glycerin Industry Revenue million Forecast, by Grade 2020 & 2033
- Table 76: Global Glycerin Industry Volume K Tons Forecast, by Grade 2020 & 2033
- Table 77: Global Glycerin Industry Revenue million Forecast, by Source 2020 & 2033
- Table 78: Global Glycerin Industry Volume K Tons Forecast, by Source 2020 & 2033
- Table 79: Global Glycerin Industry Revenue million Forecast, by Application 2020 & 2033
- Table 80: Global Glycerin Industry Volume K Tons Forecast, by Application 2020 & 2033
- Table 81: Global Glycerin Industry Revenue million Forecast, by Country 2020 & 2033
- Table 82: Global Glycerin Industry Volume K Tons Forecast, by Country 2020 & 2033
- Table 83: Saudi Arabia Glycerin Industry Revenue (million) Forecast, by Application 2020 & 2033
- Table 84: Saudi Arabia Glycerin Industry Volume (K Tons) Forecast, by Application 2020 & 2033
- Table 85: South Africa Glycerin Industry Revenue (million) Forecast, by Application 2020 & 2033
- Table 86: South Africa Glycerin Industry Volume (K Tons) Forecast, by Application 2020 & 2033
- Table 87: United Arab Emirates Glycerin Industry Revenue (million) Forecast, by Application 2020 & 2033
- Table 88: United Arab Emirates Glycerin Industry Volume (K Tons) Forecast, by Application 2020 & 2033
- Table 89: Rest of Middle East and Africa Glycerin Industry Revenue (million) Forecast, by Application 2020 & 2033
- Table 90: Rest of Middle East and Africa Glycerin Industry Volume (K Tons) Forecast, by Application 2020 & 2033
Frequently Asked Questions
1. What is the projected Compound Annual Growth Rate (CAGR) of the Glycerin Industry?
The projected CAGR is approximately 4.5%.
2. Which companies are prominent players in the Glycerin Industry?
Key companies in the market include Louis Dreyfus Company, Biodex-SA, Musim Mas, Cargill Incorporated, Thai Glycerine Co Ltd, RB FUELS, Vantage Specialty Chemicals, KLK OLEO, Sebacic India Limited, IOI Corporation Berhad, Wilmar International Ltd, P&G Chemicals, Archer Daniels Midland Company, Emery Oleochemicals, BASF SE, Dow, Munzer Bioindustrie GmbH, Godrej Industries Limited, Oleon NV, Vance Group Ltd, Kao Corporation, Aemetis.
3. What are the main segments of the Glycerin Industry?
The market segments include Grade, Source, Application.
4. Can you provide details about the market size?
The market size is estimated to be USD 4.78 million as of 2022.
5. What are some drivers contributing to market growth?
Strong Demand from the Pharmaceutical Industry; Increasing Use in the Personal Care and Cosmetics Industries.
6. What are the notable trends driving market growth?
Personal Care and Cosmetics Application to Dominate the Market Growth.
7. Are there any restraints impacting market growth?
Availability of Substitutes; Other Restraints.
8. Can you provide examples of recent developments in the market?
In December 2022, Oleochemical producer Oleon announced the acquisition of a blending plant in Conroe, Texas, by investing USD 50 million. The company strengthened its oleochemicals division which includes the production of glycerin.
9. What pricing options are available for accessing the report?
Pricing options include single-user, multi-user, and enterprise licenses priced at USD 4750, USD 5250, and USD 8750 respectively.
10. Is the market size provided in terms of value or volume?
The market size is provided in terms of value, measured in million and volume, measured in K Tons.
11. Are there any specific market keywords associated with the report?
Yes, the market keyword associated with the report is "Glycerin Industry," which aids in identifying and referencing the specific market segment covered.
12. How do I determine which pricing option suits my needs best?
The pricing options vary based on user requirements and access needs. Individual users may opt for single-user licenses, while businesses requiring broader access may choose multi-user or enterprise licenses for cost-effective access to the report.
13. Are there any additional resources or data provided in the Glycerin Industry report?
While the report offers comprehensive insights, it's advisable to review the specific contents or supplementary materials provided to ascertain if additional resources or data are available.
14. How can I stay updated on further developments or reports in the Glycerin Industry?
To stay informed about further developments, trends, and reports in the Glycerin Industry, consider subscribing to industry newsletters, following relevant companies and organizations, or regularly checking reputable industry news sources and publications.
Methodology
Step 1 - Identification of Relevant Samples Size from Population Database


Step 2 - Approaches for Defining Global Market Size (Value, Volume* & Price*)

Note*: In applicable scenarios
Step 3 - Data Sources
Primary Research
- Web Analytics
- Survey Reports
- Research Institute
- Latest Research Reports
- Opinion Leaders
Secondary Research
- Annual Reports
- White Paper
- Latest Press Release
- Industry Association
- Paid Database
- Investor Presentations

Step 4 - Data Triangulation
Involves using different sources of information in order to increase the validity of a study
These sources are likely to be stakeholders in a program - participants, other researchers, program staff, other community members, and so on.
Then we put all data in single framework & apply various statistical tools to find out the dynamic on the market.
During the analysis stage, feedback from the stakeholder groups would be compared to determine areas of agreement as well as areas of divergence