
Key Insights
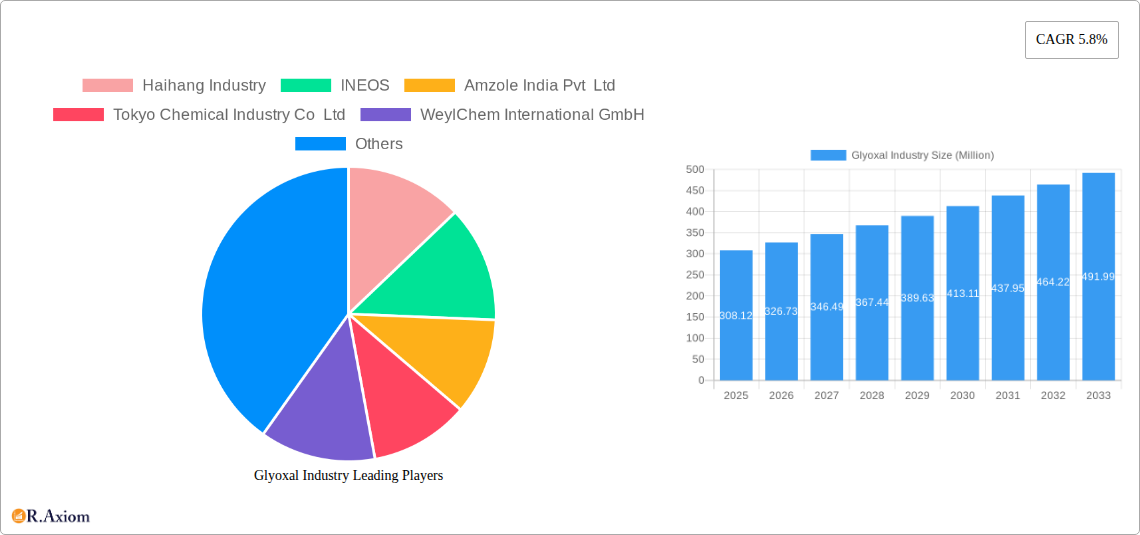
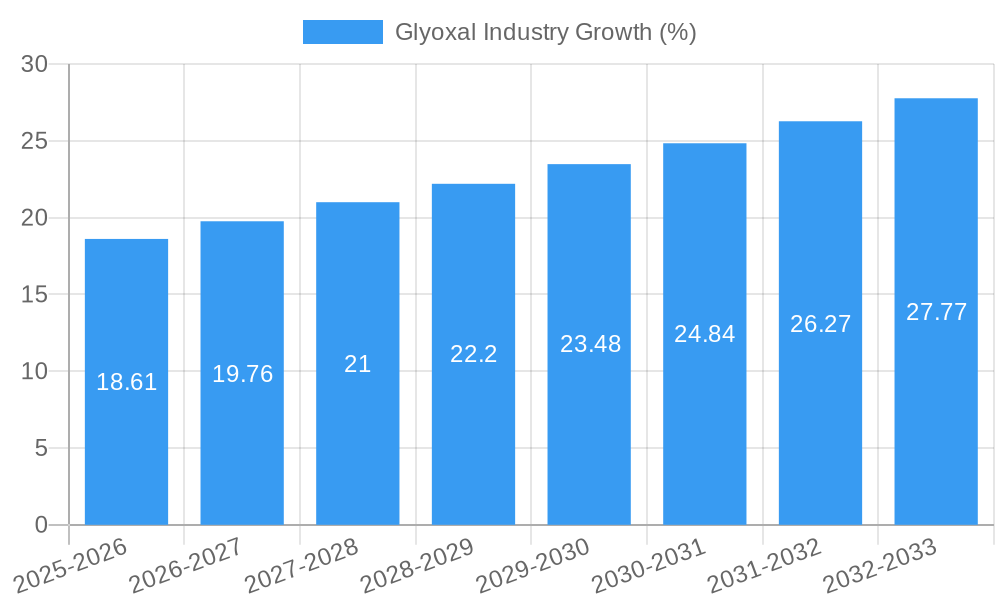
The global glyoxal market, valued at $308.12 million in 2025, is projected to experience robust growth, driven by increasing demand from key application segments like adhesives and sealants, textile treatment, and the paper and packaging industry. The compound annual growth rate (CAGR) of 5.8% from 2025 to 2033 signifies a considerable expansion, fueled by factors such as the rising global population, industrialization, and escalating demand for advanced materials in various sectors. The adhesives and sealants segment is expected to dominate the market owing to glyoxal's excellent cross-linking properties, enhancing the durability and performance of adhesives. Growth in the Asia-Pacific region, particularly in China and India, will significantly contribute to the overall market expansion due to burgeoning industrial activities and increasing consumption of glyoxal-based products. While challenges such as stringent environmental regulations and price fluctuations of raw materials may present headwinds, the overall outlook remains positive, driven by innovation in product formulations and the emergence of new applications in emerging markets.
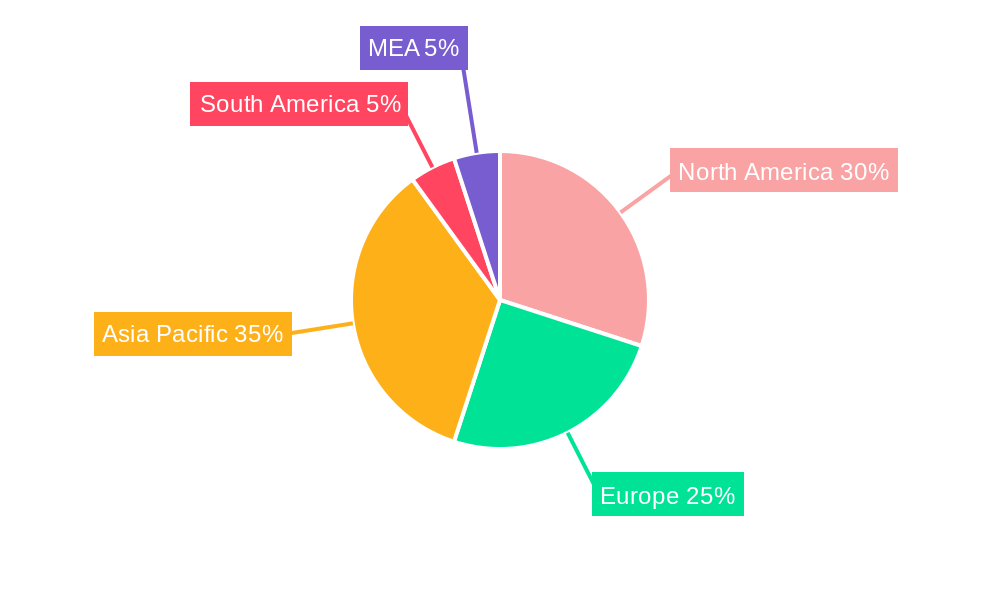
The market segmentation reveals a diverse landscape, with adhesives and sealants commanding a significant share among applications. Growth in the textile and leather industries, where glyoxal acts as a cross-linking agent, is further bolstering demand. The resin and polymer industry is also a major consumer, utilizing glyoxal in the production of various resins and polymers. The direct sales channel currently holds a larger market share, however, the indirect sales channel is expected to gain traction over the forecast period as distribution networks expand. North America and Europe currently represent significant regional markets; however, the rapidly industrializing Asia-Pacific region is poised for substantial growth, presenting lucrative opportunities for market players. Companies like BASF SE, INEOS, and others are strategically positioning themselves to capitalize on this expanding market by investing in research and development and expanding their production capacities.
This comprehensive report provides an in-depth analysis of the global glyoxal industry, encompassing market size, growth drivers, competitive landscape, and future outlook. The study period covers 2019-2033, with 2025 serving as the base and estimated year. This report is essential for industry stakeholders, investors, and researchers seeking actionable insights into this dynamic market.
Glyoxal Industry Market Concentration & Innovation
The global glyoxal market exhibits a moderately concentrated structure, with several major players holding significant market share. Haihang Industry, INEOS, and BASF SE are among the leading companies, collectively accounting for an estimated xx% of the global market share in 2025. However, several smaller, regional players also contribute significantly to the overall market volume. Innovation in the glyoxal industry is driven by the increasing demand for high-performance adhesives, sealants, and resins, leading to the development of new, more efficient production methods and improved product formulations. Regulatory frameworks, particularly concerning environmental impact and safety, are influencing innovation towards more sustainable and eco-friendly glyoxal production and applications. Substitutes for glyoxal, such as formaldehyde and glutaraldehyde, exist but often lack certain key performance characteristics, thus limiting their widespread adoption. End-user trends, driven by growth in sectors like textiles and construction, continue to shape market demand. Recent M&A activity in the sector has been relatively modest, with deal values totaling approximately xx Million in the last five years. Key M&A activities include (list any available M&A activity details here).
- Market Concentration: Moderately concentrated, with top three players holding xx% market share in 2025.
- Innovation Drivers: Demand for high-performance materials, regulatory pressures, and sustainability concerns.
- M&A Activity: xx Million in deal value over the past five years (insert details of any known M&A activity).
- Product Substitutes: Formaldehyde, glutaraldehyde, with limited market penetration due to performance limitations.
Glyoxal Industry Industry Trends & Insights
The global glyoxal market is projected to witness robust growth during the forecast period (2025-2033), driven by increasing demand from various end-use industries. The compound annual growth rate (CAGR) is estimated at xx% from 2025 to 2033, propelled by factors such as the expanding textile industry, growth in the construction sector, and rising demand for advanced materials in various applications. Technological advancements in glyoxal production processes, leading to improved efficiency and cost reductions, are further bolstering market growth. Consumer preferences for high-quality, durable products are driving the demand for glyoxal-based solutions. However, intense competition amongst existing players, coupled with the emergence of new entrants, creates a dynamic competitive landscape. Market penetration in key regions like Asia-Pacific remains significant, with opportunities for further growth driven by rapid industrialization and infrastructure development. (Insert further details about market growth drivers, technological disruptions, consumer preferences and competitive dynamics here, including specific CAGR and market penetration data where possible).
Dominant Markets & Segments in Glyoxal Industry
The Asia-Pacific region is expected to dominate the global glyoxal market throughout the forecast period, driven primarily by strong economic growth, rapid industrialization, and increasing demand from diverse end-use sectors. Within the application segment, Adhesives and Sealants holds the largest market share, owing to its extensive use in various industries such as construction and packaging. The Resin & Polymers end-use industry also represents a significant market segment, propelled by the growing demand for high-performance materials in different applications. Direct sales continue to be the dominant sales channel.
- Leading Region: Asia-Pacific
- Dominant Application Segment: Adhesives and Sealants
- Dominant End-Use Industry: Resin & Polymers
- Dominant Sales Channel: Direct Sale
Key Drivers for Dominant Markets/Segments:
- Asia-Pacific: Rapid industrialization, economic growth, and increasing infrastructure development.
- Adhesives and Sealants: High demand across construction, packaging, and other sectors.
- Resin & Polymers: Growing demand for high-performance materials in diverse applications.
- Direct Sales: Enhanced control over distribution and customer relationships.
Glyoxal Industry Product Developments
Recent product developments in the glyoxal industry focus on enhancing the performance characteristics of glyoxal-based products, such as improved stability, increased reactivity, and enhanced compatibility with other materials. These innovations are driven by the demand for high-performance adhesives, sealants, and resins with improved durability and longevity. The development of new applications for glyoxal, especially in environmentally friendly formulations, is another key area of focus, aligning with global sustainability initiatives.
Report Scope & Segmentation Analysis
This report segments the glyoxal market by application (adhesives and sealants, cross-linking, intermediate, others), end-use industry (textile, leather, resin & polymers, cosmetics & personal care, paper packaging, oil & gas, others), and sales channel (direct sale, indirect sale). Each segment is analyzed in detail, providing market size, growth projections, and competitive dynamics. Growth projections are provided for each segment based on current market trends and future expectations. Competitive landscapes are also analyzed by identifying key players and their market positions within each segment. (Provide growth projections and market size data, as well as competitive dynamics for each segment here).
Key Drivers of Glyoxal Industry Growth
The glyoxal industry's growth is primarily driven by the expanding use of glyoxal in various applications. The rising demand for high-performance adhesives and sealants in the construction, packaging, and automotive industries is a significant driver. Furthermore, the increasing demand for glyoxal as an intermediate in the production of other chemicals fuels market expansion. Government regulations promoting the use of eco-friendly chemicals are also positively impacting the industry.
Challenges in the Glyoxal Industry Sector
The glyoxal industry faces challenges such as volatile raw material prices and stringent environmental regulations. Supply chain disruptions due to geopolitical events can also negatively impact production and distribution. Intense competition from substitute materials and the emergence of new players pose significant challenges. These factors, along with others such as potential fluctuations in demand from major end-use sectors, contribute to uncertainty in the market. The combined effect of these challenges could lead to price volatility and reduced profit margins for industry players.
Emerging Opportunities in Glyoxal Industry
Emerging opportunities exist in developing new applications for glyoxal, especially in the rapidly growing sectors of renewable energy and biotechnology. The exploration of novel glyoxal-based materials with enhanced properties, such as improved biodegradability and recyclability, presents a significant opportunity. The increasing demand for sustainable and eco-friendly solutions across various industries offers potential for growth.
Leading Players in the Glyoxal Industry Market
- Haihang Industry
- INEOS
- Amzole India Pvt Ltd
- Tokyo Chemical Industry Co Ltd
- WeylChem International GmbH
- BASF SE
- Hubei Hongyuan Pharmaceutical Technology Co Ltd
- Toronto Research Chemicals
- Zhonglan Industry Co Ltd
- Thermo Fisher Scientific
Key Developments in Glyoxal Industry Industry
- 2022-Q4: INEOS announces expansion of its glyoxal production facility in [Location].
- 2023-Q1: BASF SE launches a new line of high-performance glyoxal-based adhesives. (Add further details of key developments here, including year and month)
Strategic Outlook for Glyoxal Industry Market
The glyoxal market is poised for continued growth, driven by the ongoing demand from various end-use industries and technological advancements leading to improved production processes and product formulations. The focus on sustainability and the development of eco-friendly glyoxal-based solutions will further fuel market expansion. The exploration of new applications and strategic partnerships will be crucial for companies to maintain their competitive advantage in this dynamic market. Overall, the long-term outlook for the glyoxal industry remains positive.
Glyoxal Industry Segmentation
-
1. Application
- 1.1. Adhesives and Sealants
- 1.2. Intermediates
- 1.3. Oil and Gas Exploration
- 1.4. Paints and Coatings
- 1.5. Textile
- 1.6. Other Applications
Glyoxal Industry Segmentation By Geography
-
1. Asia Pacific
- 1.1. China
- 1.2. India
- 1.3. Japan
- 1.4. South Korea
- 1.5. Rest of Asia Pacific
-
2. North America
- 2.1. United States
- 2.2. Canada
- 2.3. Mexico
-
3. Europe
- 3.1. Germany
- 3.2. United Kingdom
- 3.3. Italy
- 3.4. France
- 3.5. Rest of Europe
-
4. South America
- 4.1. Brazil
- 4.2. Argentina
- 4.3. Rest of South America
- 5. Middle East
-
6. Saudi Arabia
- 6.1. South Africa
- 6.2. Rest of Middle East
Glyoxal Industry REPORT HIGHLIGHTS
| Aspects | Details |
|---|---|
| Study Period | 2019-2033 |
| Base Year | 2024 |
| Estimated Year | 2025 |
| Forecast Period | 2025-2033 |
| Historical Period | 2019-2024 |
| Growth Rate | CAGR of 5.8% from 2019-2033 |
| Segmentation |
|
Table of Contents
- 1. Introduction
- 1.1. Research Scope
- 1.2. Market Segmentation
- 1.3. Research Methodology
- 1.4. Definitions and Assumptions
- 2. Executive Summary
- 2.1. Introduction
- 3. Market Dynamics
- 3.1. Introduction
- 3.2. Market Drivers
- 3.2.1. ; Increasing Applications of Glyoxal in Fabrics; Growing Demand for Glyoxal as an Intermediate
- 3.3. Market Restrains
- 3.3.1. ; Associated Health Issues; Unfavorable Conditions Arising due to the Impact of COVID-19; Other Restraints
- 3.4. Market Trends
- 3.4.1. Increasing Demand for Glyoxal as an Intermediate and Crosslinkers
- 4. Market Factor Analysis
- 4.1. Porters Five Forces
- 4.2. Supply/Value Chain
- 4.3. PESTEL analysis
- 4.4. Market Entropy
- 4.5. Patent/Trademark Analysis
- 5. Global Glyoxal Industry Analysis, Insights and Forecast, 2019-2031
- 5.1. Market Analysis, Insights and Forecast - by Application
- 5.1.1. Adhesives and Sealants
- 5.1.2. Intermediates
- 5.1.3. Oil and Gas Exploration
- 5.1.4. Paints and Coatings
- 5.1.5. Textile
- 5.1.6. Other Applications
- 5.2. Market Analysis, Insights and Forecast - by Region
- 5.2.1. Asia Pacific
- 5.2.2. North America
- 5.2.3. Europe
- 5.2.4. South America
- 5.2.5. Middle East
- 5.2.6. Saudi Arabia
- 5.1. Market Analysis, Insights and Forecast - by Application
- 6. Asia Pacific Glyoxal Industry Analysis, Insights and Forecast, 2019-2031
- 6.1. Market Analysis, Insights and Forecast - by Application
- 6.1.1. Adhesives and Sealants
- 6.1.2. Intermediates
- 6.1.3. Oil and Gas Exploration
- 6.1.4. Paints and Coatings
- 6.1.5. Textile
- 6.1.6. Other Applications
- 6.1. Market Analysis, Insights and Forecast - by Application
- 7. North America Glyoxal Industry Analysis, Insights and Forecast, 2019-2031
- 7.1. Market Analysis, Insights and Forecast - by Application
- 7.1.1. Adhesives and Sealants
- 7.1.2. Intermediates
- 7.1.3. Oil and Gas Exploration
- 7.1.4. Paints and Coatings
- 7.1.5. Textile
- 7.1.6. Other Applications
- 7.1. Market Analysis, Insights and Forecast - by Application
- 8. Europe Glyoxal Industry Analysis, Insights and Forecast, 2019-2031
- 8.1. Market Analysis, Insights and Forecast - by Application
- 8.1.1. Adhesives and Sealants
- 8.1.2. Intermediates
- 8.1.3. Oil and Gas Exploration
- 8.1.4. Paints and Coatings
- 8.1.5. Textile
- 8.1.6. Other Applications
- 8.1. Market Analysis, Insights and Forecast - by Application
- 9. South America Glyoxal Industry Analysis, Insights and Forecast, 2019-2031
- 9.1. Market Analysis, Insights and Forecast - by Application
- 9.1.1. Adhesives and Sealants
- 9.1.2. Intermediates
- 9.1.3. Oil and Gas Exploration
- 9.1.4. Paints and Coatings
- 9.1.5. Textile
- 9.1.6. Other Applications
- 9.1. Market Analysis, Insights and Forecast - by Application
- 10. Middle East Glyoxal Industry Analysis, Insights and Forecast, 2019-2031
- 10.1. Market Analysis, Insights and Forecast - by Application
- 10.1.1. Adhesives and Sealants
- 10.1.2. Intermediates
- 10.1.3. Oil and Gas Exploration
- 10.1.4. Paints and Coatings
- 10.1.5. Textile
- 10.1.6. Other Applications
- 10.1. Market Analysis, Insights and Forecast - by Application
- 11. Saudi Arabia Glyoxal Industry Analysis, Insights and Forecast, 2019-2031
- 11.1. Market Analysis, Insights and Forecast - by Application
- 11.1.1. Adhesives and Sealants
- 11.1.2. Intermediates
- 11.1.3. Oil and Gas Exploration
- 11.1.4. Paints and Coatings
- 11.1.5. Textile
- 11.1.6. Other Applications
- 11.1. Market Analysis, Insights and Forecast - by Application
- 12. North America Glyoxal Industry Analysis, Insights and Forecast, 2019-2031
- 12.1. Market Analysis, Insights and Forecast - By Country/Sub-region
- 12.1.1 United States
- 12.1.2 Canada
- 12.1.3 Mexico
- 13. Europe Glyoxal Industry Analysis, Insights and Forecast, 2019-2031
- 13.1. Market Analysis, Insights and Forecast - By Country/Sub-region
- 13.1.1 Germany
- 13.1.2 France
- 13.1.3 Italy
- 13.1.4 United Kingdom
- 13.1.5 Netherlands
- 13.1.6 Rest of Europe
- 14. Asia Pacific Glyoxal Industry Analysis, Insights and Forecast, 2019-2031
- 14.1. Market Analysis, Insights and Forecast - By Country/Sub-region
- 14.1.1 China
- 14.1.2 Japan
- 14.1.3 India
- 14.1.4 South Korea
- 14.1.5 Taiwan
- 14.1.6 Australia
- 14.1.7 Rest of Asia-Pacific
- 15. South America Glyoxal Industry Analysis, Insights and Forecast, 2019-2031
- 15.1. Market Analysis, Insights and Forecast - By Country/Sub-region
- 15.1.1 Brazil
- 15.1.2 Argentina
- 15.1.3 Rest of South America
- 16. MEA Glyoxal Industry Analysis, Insights and Forecast, 2019-2031
- 16.1. Market Analysis, Insights and Forecast - By Country/Sub-region
- 16.1.1 Middle East
- 16.1.2 Africa
- 17. Competitive Analysis
- 17.1. Global Market Share Analysis 2024
- 17.2. Company Profiles
- 17.2.1 Haihang Industry
- 17.2.1.1. Overview
- 17.2.1.2. Products
- 17.2.1.3. SWOT Analysis
- 17.2.1.4. Recent Developments
- 17.2.1.5. Financials (Based on Availability)
- 17.2.2 INEOS
- 17.2.2.1. Overview
- 17.2.2.2. Products
- 17.2.2.3. SWOT Analysis
- 17.2.2.4. Recent Developments
- 17.2.2.5. Financials (Based on Availability)
- 17.2.3 Amzole India Pvt Ltd
- 17.2.3.1. Overview
- 17.2.3.2. Products
- 17.2.3.3. SWOT Analysis
- 17.2.3.4. Recent Developments
- 17.2.3.5. Financials (Based on Availability)
- 17.2.4 Tokyo Chemical Industry Co Ltd
- 17.2.4.1. Overview
- 17.2.4.2. Products
- 17.2.4.3. SWOT Analysis
- 17.2.4.4. Recent Developments
- 17.2.4.5. Financials (Based on Availability)
- 17.2.5 WeylChem International GmbH
- 17.2.5.1. Overview
- 17.2.5.2. Products
- 17.2.5.3. SWOT Analysis
- 17.2.5.4. Recent Developments
- 17.2.5.5. Financials (Based on Availability)
- 17.2.6 BASF SE
- 17.2.6.1. Overview
- 17.2.6.2. Products
- 17.2.6.3. SWOT Analysis
- 17.2.6.4. Recent Developments
- 17.2.6.5. Financials (Based on Availability)
- 17.2.7 Hubei Hongyuan Pharmaceutical Technology Co Ltd
- 17.2.7.1. Overview
- 17.2.7.2. Products
- 17.2.7.3. SWOT Analysis
- 17.2.7.4. Recent Developments
- 17.2.7.5. Financials (Based on Availability)
- 17.2.8 Toronto Research Chemicals
- 17.2.8.1. Overview
- 17.2.8.2. Products
- 17.2.8.3. SWOT Analysis
- 17.2.8.4. Recent Developments
- 17.2.8.5. Financials (Based on Availability)
- 17.2.9 Zhonglan Industry Co Ltd
- 17.2.9.1. Overview
- 17.2.9.2. Products
- 17.2.9.3. SWOT Analysis
- 17.2.9.4. Recent Developments
- 17.2.9.5. Financials (Based on Availability)
- 17.2.10 Thermo Fisher Scientific
- 17.2.10.1. Overview
- 17.2.10.2. Products
- 17.2.10.3. SWOT Analysis
- 17.2.10.4. Recent Developments
- 17.2.10.5. Financials (Based on Availability)
- 17.2.1 Haihang Industry
List of Figures
- Figure 1: Global Glyoxal Industry Revenue Breakdown (Million, %) by Region 2024 & 2032
- Figure 2: Global Glyoxal Industry Volume Breakdown (K Tons, %) by Region 2024 & 2032
- Figure 3: North America Glyoxal Industry Revenue (Million), by Country 2024 & 2032
- Figure 4: North America Glyoxal Industry Volume (K Tons), by Country 2024 & 2032
- Figure 5: North America Glyoxal Industry Revenue Share (%), by Country 2024 & 2032
- Figure 6: North America Glyoxal Industry Volume Share (%), by Country 2024 & 2032
- Figure 7: Europe Glyoxal Industry Revenue (Million), by Country 2024 & 2032
- Figure 8: Europe Glyoxal Industry Volume (K Tons), by Country 2024 & 2032
- Figure 9: Europe Glyoxal Industry Revenue Share (%), by Country 2024 & 2032
- Figure 10: Europe Glyoxal Industry Volume Share (%), by Country 2024 & 2032
- Figure 11: Asia Pacific Glyoxal Industry Revenue (Million), by Country 2024 & 2032
- Figure 12: Asia Pacific Glyoxal Industry Volume (K Tons), by Country 2024 & 2032
- Figure 13: Asia Pacific Glyoxal Industry Revenue Share (%), by Country 2024 & 2032
- Figure 14: Asia Pacific Glyoxal Industry Volume Share (%), by Country 2024 & 2032
- Figure 15: South America Glyoxal Industry Revenue (Million), by Country 2024 & 2032
- Figure 16: South America Glyoxal Industry Volume (K Tons), by Country 2024 & 2032
- Figure 17: South America Glyoxal Industry Revenue Share (%), by Country 2024 & 2032
- Figure 18: South America Glyoxal Industry Volume Share (%), by Country 2024 & 2032
- Figure 19: MEA Glyoxal Industry Revenue (Million), by Country 2024 & 2032
- Figure 20: MEA Glyoxal Industry Volume (K Tons), by Country 2024 & 2032
- Figure 21: MEA Glyoxal Industry Revenue Share (%), by Country 2024 & 2032
- Figure 22: MEA Glyoxal Industry Volume Share (%), by Country 2024 & 2032
- Figure 23: Asia Pacific Glyoxal Industry Revenue (Million), by Application 2024 & 2032
- Figure 24: Asia Pacific Glyoxal Industry Volume (K Tons), by Application 2024 & 2032
- Figure 25: Asia Pacific Glyoxal Industry Revenue Share (%), by Application 2024 & 2032
- Figure 26: Asia Pacific Glyoxal Industry Volume Share (%), by Application 2024 & 2032
- Figure 27: Asia Pacific Glyoxal Industry Revenue (Million), by Country 2024 & 2032
- Figure 28: Asia Pacific Glyoxal Industry Volume (K Tons), by Country 2024 & 2032
- Figure 29: Asia Pacific Glyoxal Industry Revenue Share (%), by Country 2024 & 2032
- Figure 30: Asia Pacific Glyoxal Industry Volume Share (%), by Country 2024 & 2032
- Figure 31: North America Glyoxal Industry Revenue (Million), by Application 2024 & 2032
- Figure 32: North America Glyoxal Industry Volume (K Tons), by Application 2024 & 2032
- Figure 33: North America Glyoxal Industry Revenue Share (%), by Application 2024 & 2032
- Figure 34: North America Glyoxal Industry Volume Share (%), by Application 2024 & 2032
- Figure 35: North America Glyoxal Industry Revenue (Million), by Country 2024 & 2032
- Figure 36: North America Glyoxal Industry Volume (K Tons), by Country 2024 & 2032
- Figure 37: North America Glyoxal Industry Revenue Share (%), by Country 2024 & 2032
- Figure 38: North America Glyoxal Industry Volume Share (%), by Country 2024 & 2032
- Figure 39: Europe Glyoxal Industry Revenue (Million), by Application 2024 & 2032
- Figure 40: Europe Glyoxal Industry Volume (K Tons), by Application 2024 & 2032
- Figure 41: Europe Glyoxal Industry Revenue Share (%), by Application 2024 & 2032
- Figure 42: Europe Glyoxal Industry Volume Share (%), by Application 2024 & 2032
- Figure 43: Europe Glyoxal Industry Revenue (Million), by Country 2024 & 2032
- Figure 44: Europe Glyoxal Industry Volume (K Tons), by Country 2024 & 2032
- Figure 45: Europe Glyoxal Industry Revenue Share (%), by Country 2024 & 2032
- Figure 46: Europe Glyoxal Industry Volume Share (%), by Country 2024 & 2032
- Figure 47: South America Glyoxal Industry Revenue (Million), by Application 2024 & 2032
- Figure 48: South America Glyoxal Industry Volume (K Tons), by Application 2024 & 2032
- Figure 49: South America Glyoxal Industry Revenue Share (%), by Application 2024 & 2032
- Figure 50: South America Glyoxal Industry Volume Share (%), by Application 2024 & 2032
- Figure 51: South America Glyoxal Industry Revenue (Million), by Country 2024 & 2032
- Figure 52: South America Glyoxal Industry Volume (K Tons), by Country 2024 & 2032
- Figure 53: South America Glyoxal Industry Revenue Share (%), by Country 2024 & 2032
- Figure 54: South America Glyoxal Industry Volume Share (%), by Country 2024 & 2032
- Figure 55: Middle East Glyoxal Industry Revenue (Million), by Application 2024 & 2032
- Figure 56: Middle East Glyoxal Industry Volume (K Tons), by Application 2024 & 2032
- Figure 57: Middle East Glyoxal Industry Revenue Share (%), by Application 2024 & 2032
- Figure 58: Middle East Glyoxal Industry Volume Share (%), by Application 2024 & 2032
- Figure 59: Middle East Glyoxal Industry Revenue (Million), by Country 2024 & 2032
- Figure 60: Middle East Glyoxal Industry Volume (K Tons), by Country 2024 & 2032
- Figure 61: Middle East Glyoxal Industry Revenue Share (%), by Country 2024 & 2032
- Figure 62: Middle East Glyoxal Industry Volume Share (%), by Country 2024 & 2032
- Figure 63: Saudi Arabia Glyoxal Industry Revenue (Million), by Application 2024 & 2032
- Figure 64: Saudi Arabia Glyoxal Industry Volume (K Tons), by Application 2024 & 2032
- Figure 65: Saudi Arabia Glyoxal Industry Revenue Share (%), by Application 2024 & 2032
- Figure 66: Saudi Arabia Glyoxal Industry Volume Share (%), by Application 2024 & 2032
- Figure 67: Saudi Arabia Glyoxal Industry Revenue (Million), by Country 2024 & 2032
- Figure 68: Saudi Arabia Glyoxal Industry Volume (K Tons), by Country 2024 & 2032
- Figure 69: Saudi Arabia Glyoxal Industry Revenue Share (%), by Country 2024 & 2032
- Figure 70: Saudi Arabia Glyoxal Industry Volume Share (%), by Country 2024 & 2032
List of Tables
- Table 1: Global Glyoxal Industry Revenue Million Forecast, by Region 2019 & 2032
- Table 2: Global Glyoxal Industry Volume K Tons Forecast, by Region 2019 & 2032
- Table 3: Global Glyoxal Industry Revenue Million Forecast, by Application 2019 & 2032
- Table 4: Global Glyoxal Industry Volume K Tons Forecast, by Application 2019 & 2032
- Table 5: Global Glyoxal Industry Revenue Million Forecast, by Region 2019 & 2032
- Table 6: Global Glyoxal Industry Volume K Tons Forecast, by Region 2019 & 2032
- Table 7: Global Glyoxal Industry Revenue Million Forecast, by Country 2019 & 2032
- Table 8: Global Glyoxal Industry Volume K Tons Forecast, by Country 2019 & 2032
- Table 9: United States Glyoxal Industry Revenue (Million) Forecast, by Application 2019 & 2032
- Table 10: United States Glyoxal Industry Volume (K Tons) Forecast, by Application 2019 & 2032
- Table 11: Canada Glyoxal Industry Revenue (Million) Forecast, by Application 2019 & 2032
- Table 12: Canada Glyoxal Industry Volume (K Tons) Forecast, by Application 2019 & 2032
- Table 13: Mexico Glyoxal Industry Revenue (Million) Forecast, by Application 2019 & 2032
- Table 14: Mexico Glyoxal Industry Volume (K Tons) Forecast, by Application 2019 & 2032
- Table 15: Global Glyoxal Industry Revenue Million Forecast, by Country 2019 & 2032
- Table 16: Global Glyoxal Industry Volume K Tons Forecast, by Country 2019 & 2032
- Table 17: Germany Glyoxal Industry Revenue (Million) Forecast, by Application 2019 & 2032
- Table 18: Germany Glyoxal Industry Volume (K Tons) Forecast, by Application 2019 & 2032
- Table 19: France Glyoxal Industry Revenue (Million) Forecast, by Application 2019 & 2032
- Table 20: France Glyoxal Industry Volume (K Tons) Forecast, by Application 2019 & 2032
- Table 21: Italy Glyoxal Industry Revenue (Million) Forecast, by Application 2019 & 2032
- Table 22: Italy Glyoxal Industry Volume (K Tons) Forecast, by Application 2019 & 2032
- Table 23: United Kingdom Glyoxal Industry Revenue (Million) Forecast, by Application 2019 & 2032
- Table 24: United Kingdom Glyoxal Industry Volume (K Tons) Forecast, by Application 2019 & 2032
- Table 25: Netherlands Glyoxal Industry Revenue (Million) Forecast, by Application 2019 & 2032
- Table 26: Netherlands Glyoxal Industry Volume (K Tons) Forecast, by Application 2019 & 2032
- Table 27: Rest of Europe Glyoxal Industry Revenue (Million) Forecast, by Application 2019 & 2032
- Table 28: Rest of Europe Glyoxal Industry Volume (K Tons) Forecast, by Application 2019 & 2032
- Table 29: Global Glyoxal Industry Revenue Million Forecast, by Country 2019 & 2032
- Table 30: Global Glyoxal Industry Volume K Tons Forecast, by Country 2019 & 2032
- Table 31: China Glyoxal Industry Revenue (Million) Forecast, by Application 2019 & 2032
- Table 32: China Glyoxal Industry Volume (K Tons) Forecast, by Application 2019 & 2032
- Table 33: Japan Glyoxal Industry Revenue (Million) Forecast, by Application 2019 & 2032
- Table 34: Japan Glyoxal Industry Volume (K Tons) Forecast, by Application 2019 & 2032
- Table 35: India Glyoxal Industry Revenue (Million) Forecast, by Application 2019 & 2032
- Table 36: India Glyoxal Industry Volume (K Tons) Forecast, by Application 2019 & 2032
- Table 37: South Korea Glyoxal Industry Revenue (Million) Forecast, by Application 2019 & 2032
- Table 38: South Korea Glyoxal Industry Volume (K Tons) Forecast, by Application 2019 & 2032
- Table 39: Taiwan Glyoxal Industry Revenue (Million) Forecast, by Application 2019 & 2032
- Table 40: Taiwan Glyoxal Industry Volume (K Tons) Forecast, by Application 2019 & 2032
- Table 41: Australia Glyoxal Industry Revenue (Million) Forecast, by Application 2019 & 2032
- Table 42: Australia Glyoxal Industry Volume (K Tons) Forecast, by Application 2019 & 2032
- Table 43: Rest of Asia-Pacific Glyoxal Industry Revenue (Million) Forecast, by Application 2019 & 2032
- Table 44: Rest of Asia-Pacific Glyoxal Industry Volume (K Tons) Forecast, by Application 2019 & 2032
- Table 45: Global Glyoxal Industry Revenue Million Forecast, by Country 2019 & 2032
- Table 46: Global Glyoxal Industry Volume K Tons Forecast, by Country 2019 & 2032
- Table 47: Brazil Glyoxal Industry Revenue (Million) Forecast, by Application 2019 & 2032
- Table 48: Brazil Glyoxal Industry Volume (K Tons) Forecast, by Application 2019 & 2032
- Table 49: Argentina Glyoxal Industry Revenue (Million) Forecast, by Application 2019 & 2032
- Table 50: Argentina Glyoxal Industry Volume (K Tons) Forecast, by Application 2019 & 2032
- Table 51: Rest of South America Glyoxal Industry Revenue (Million) Forecast, by Application 2019 & 2032
- Table 52: Rest of South America Glyoxal Industry Volume (K Tons) Forecast, by Application 2019 & 2032
- Table 53: Global Glyoxal Industry Revenue Million Forecast, by Country 2019 & 2032
- Table 54: Global Glyoxal Industry Volume K Tons Forecast, by Country 2019 & 2032
- Table 55: Middle East Glyoxal Industry Revenue (Million) Forecast, by Application 2019 & 2032
- Table 56: Middle East Glyoxal Industry Volume (K Tons) Forecast, by Application 2019 & 2032
- Table 57: Africa Glyoxal Industry Revenue (Million) Forecast, by Application 2019 & 2032
- Table 58: Africa Glyoxal Industry Volume (K Tons) Forecast, by Application 2019 & 2032
- Table 59: Global Glyoxal Industry Revenue Million Forecast, by Application 2019 & 2032
- Table 60: Global Glyoxal Industry Volume K Tons Forecast, by Application 2019 & 2032
- Table 61: Global Glyoxal Industry Revenue Million Forecast, by Country 2019 & 2032
- Table 62: Global Glyoxal Industry Volume K Tons Forecast, by Country 2019 & 2032
- Table 63: China Glyoxal Industry Revenue (Million) Forecast, by Application 2019 & 2032
- Table 64: China Glyoxal Industry Volume (K Tons) Forecast, by Application 2019 & 2032
- Table 65: India Glyoxal Industry Revenue (Million) Forecast, by Application 2019 & 2032
- Table 66: India Glyoxal Industry Volume (K Tons) Forecast, by Application 2019 & 2032
- Table 67: Japan Glyoxal Industry Revenue (Million) Forecast, by Application 2019 & 2032
- Table 68: Japan Glyoxal Industry Volume (K Tons) Forecast, by Application 2019 & 2032
- Table 69: South Korea Glyoxal Industry Revenue (Million) Forecast, by Application 2019 & 2032
- Table 70: South Korea Glyoxal Industry Volume (K Tons) Forecast, by Application 2019 & 2032
- Table 71: Rest of Asia Pacific Glyoxal Industry Revenue (Million) Forecast, by Application 2019 & 2032
- Table 72: Rest of Asia Pacific Glyoxal Industry Volume (K Tons) Forecast, by Application 2019 & 2032
- Table 73: Global Glyoxal Industry Revenue Million Forecast, by Application 2019 & 2032
- Table 74: Global Glyoxal Industry Volume K Tons Forecast, by Application 2019 & 2032
- Table 75: Global Glyoxal Industry Revenue Million Forecast, by Country 2019 & 2032
- Table 76: Global Glyoxal Industry Volume K Tons Forecast, by Country 2019 & 2032
- Table 77: United States Glyoxal Industry Revenue (Million) Forecast, by Application 2019 & 2032
- Table 78: United States Glyoxal Industry Volume (K Tons) Forecast, by Application 2019 & 2032
- Table 79: Canada Glyoxal Industry Revenue (Million) Forecast, by Application 2019 & 2032
- Table 80: Canada Glyoxal Industry Volume (K Tons) Forecast, by Application 2019 & 2032
- Table 81: Mexico Glyoxal Industry Revenue (Million) Forecast, by Application 2019 & 2032
- Table 82: Mexico Glyoxal Industry Volume (K Tons) Forecast, by Application 2019 & 2032
- Table 83: Global Glyoxal Industry Revenue Million Forecast, by Application 2019 & 2032
- Table 84: Global Glyoxal Industry Volume K Tons Forecast, by Application 2019 & 2032
- Table 85: Global Glyoxal Industry Revenue Million Forecast, by Country 2019 & 2032
- Table 86: Global Glyoxal Industry Volume K Tons Forecast, by Country 2019 & 2032
- Table 87: Germany Glyoxal Industry Revenue (Million) Forecast, by Application 2019 & 2032
- Table 88: Germany Glyoxal Industry Volume (K Tons) Forecast, by Application 2019 & 2032
- Table 89: United Kingdom Glyoxal Industry Revenue (Million) Forecast, by Application 2019 & 2032
- Table 90: United Kingdom Glyoxal Industry Volume (K Tons) Forecast, by Application 2019 & 2032
- Table 91: Italy Glyoxal Industry Revenue (Million) Forecast, by Application 2019 & 2032
- Table 92: Italy Glyoxal Industry Volume (K Tons) Forecast, by Application 2019 & 2032
- Table 93: France Glyoxal Industry Revenue (Million) Forecast, by Application 2019 & 2032
- Table 94: France Glyoxal Industry Volume (K Tons) Forecast, by Application 2019 & 2032
- Table 95: Rest of Europe Glyoxal Industry Revenue (Million) Forecast, by Application 2019 & 2032
- Table 96: Rest of Europe Glyoxal Industry Volume (K Tons) Forecast, by Application 2019 & 2032
- Table 97: Global Glyoxal Industry Revenue Million Forecast, by Application 2019 & 2032
- Table 98: Global Glyoxal Industry Volume K Tons Forecast, by Application 2019 & 2032
- Table 99: Global Glyoxal Industry Revenue Million Forecast, by Country 2019 & 2032
- Table 100: Global Glyoxal Industry Volume K Tons Forecast, by Country 2019 & 2032
- Table 101: Brazil Glyoxal Industry Revenue (Million) Forecast, by Application 2019 & 2032
- Table 102: Brazil Glyoxal Industry Volume (K Tons) Forecast, by Application 2019 & 2032
- Table 103: Argentina Glyoxal Industry Revenue (Million) Forecast, by Application 2019 & 2032
- Table 104: Argentina Glyoxal Industry Volume (K Tons) Forecast, by Application 2019 & 2032
- Table 105: Rest of South America Glyoxal Industry Revenue (Million) Forecast, by Application 2019 & 2032
- Table 106: Rest of South America Glyoxal Industry Volume (K Tons) Forecast, by Application 2019 & 2032
- Table 107: Global Glyoxal Industry Revenue Million Forecast, by Application 2019 & 2032
- Table 108: Global Glyoxal Industry Volume K Tons Forecast, by Application 2019 & 2032
- Table 109: Global Glyoxal Industry Revenue Million Forecast, by Country 2019 & 2032
- Table 110: Global Glyoxal Industry Volume K Tons Forecast, by Country 2019 & 2032
- Table 111: Global Glyoxal Industry Revenue Million Forecast, by Application 2019 & 2032
- Table 112: Global Glyoxal Industry Volume K Tons Forecast, by Application 2019 & 2032
- Table 113: Global Glyoxal Industry Revenue Million Forecast, by Country 2019 & 2032
- Table 114: Global Glyoxal Industry Volume K Tons Forecast, by Country 2019 & 2032
- Table 115: South Africa Glyoxal Industry Revenue (Million) Forecast, by Application 2019 & 2032
- Table 116: South Africa Glyoxal Industry Volume (K Tons) Forecast, by Application 2019 & 2032
- Table 117: Rest of Middle East Glyoxal Industry Revenue (Million) Forecast, by Application 2019 & 2032
- Table 118: Rest of Middle East Glyoxal Industry Volume (K Tons) Forecast, by Application 2019 & 2032
Frequently Asked Questions
1. What is the projected Compound Annual Growth Rate (CAGR) of the Glyoxal Industry?
The projected CAGR is approximately 5.8%.
2. Which companies are prominent players in the Glyoxal Industry?
Key companies in the market include Haihang Industry, INEOS, Amzole India Pvt Ltd, Tokyo Chemical Industry Co Ltd, WeylChem International GmbH, BASF SE, Hubei Hongyuan Pharmaceutical Technology Co Ltd, Toronto Research Chemicals, Zhonglan Industry Co Ltd, Thermo Fisher Scientific.
3. What are the main segments of the Glyoxal Industry?
The market segments include Application.
4. Can you provide details about the market size?
The market size is estimated to be USD 308.12 Million as of 2022.
5. What are some drivers contributing to market growth?
; Increasing Applications of Glyoxal in Fabrics; Growing Demand for Glyoxal as an Intermediate.
6. What are the notable trends driving market growth?
Increasing Demand for Glyoxal as an Intermediate and Crosslinkers.
7. Are there any restraints impacting market growth?
; Associated Health Issues; Unfavorable Conditions Arising due to the Impact of COVID-19; Other Restraints.
8. Can you provide examples of recent developments in the market?
N/A
9. What pricing options are available for accessing the report?
Pricing options include single-user, multi-user, and enterprise licenses priced at USD 4750, USD 5250, and USD 8750 respectively.
10. Is the market size provided in terms of value or volume?
The market size is provided in terms of value, measured in Million and volume, measured in K Tons.
11. Are there any specific market keywords associated with the report?
Yes, the market keyword associated with the report is "Glyoxal Industry," which aids in identifying and referencing the specific market segment covered.
12. How do I determine which pricing option suits my needs best?
The pricing options vary based on user requirements and access needs. Individual users may opt for single-user licenses, while businesses requiring broader access may choose multi-user or enterprise licenses for cost-effective access to the report.
13. Are there any additional resources or data provided in the Glyoxal Industry report?
While the report offers comprehensive insights, it's advisable to review the specific contents or supplementary materials provided to ascertain if additional resources or data are available.
14. How can I stay updated on further developments or reports in the Glyoxal Industry?
To stay informed about further developments, trends, and reports in the Glyoxal Industry, consider subscribing to industry newsletters, following relevant companies and organizations, or regularly checking reputable industry news sources and publications.
Methodology
Step 1 - Identification of Relevant Samples Size from Population Database


Step 2 - Approaches for Defining Global Market Size (Value, Volume* & Price*)

Note*: In applicable scenarios
Step 3 - Data Sources
Primary Research
- Web Analytics
- Survey Reports
- Research Institute
- Latest Research Reports
- Opinion Leaders
Secondary Research
- Annual Reports
- White Paper
- Latest Press Release
- Industry Association
- Paid Database
- Investor Presentations

Step 4 - Data Triangulation
Involves using different sources of information in order to increase the validity of a study
These sources are likely to be stakeholders in a program - participants, other researchers, program staff, other community members, and so on.
Then we put all data in single framework & apply various statistical tools to find out the dynamic on the market.
During the analysis stage, feedback from the stakeholder groups would be compared to determine areas of agreement as well as areas of divergence


