
Key Insights
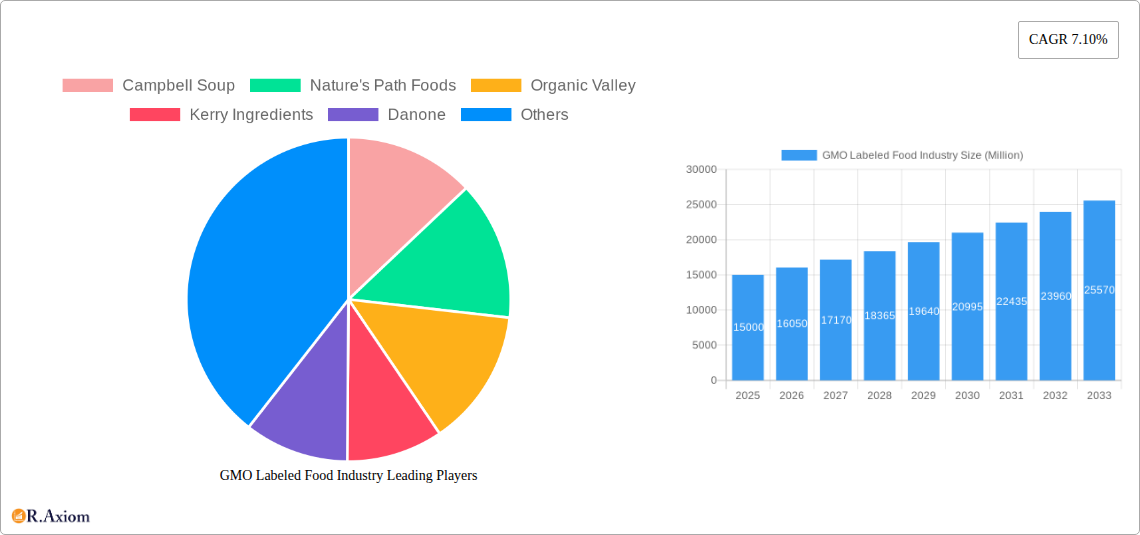
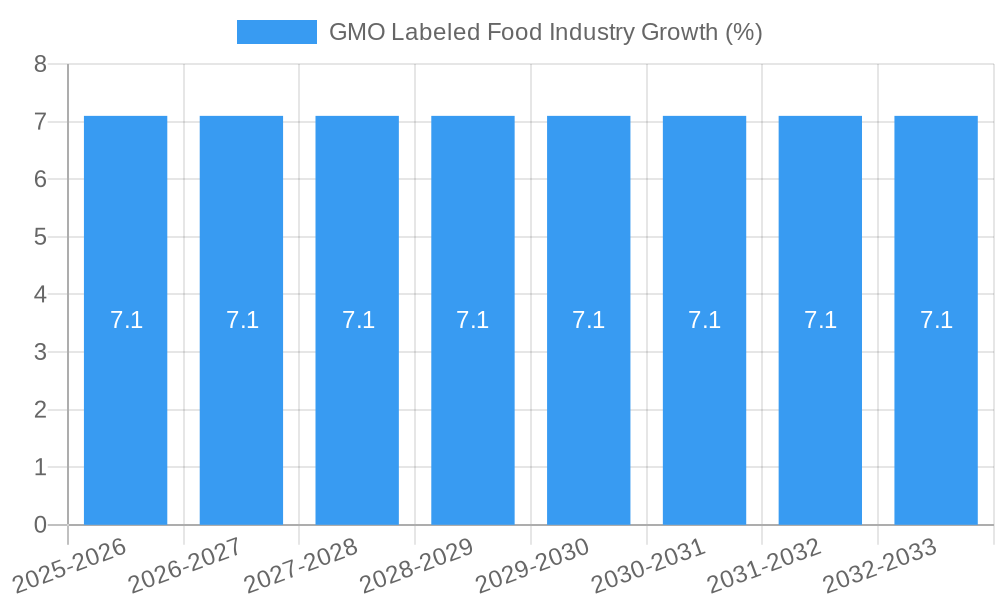
The GMO-labeled food industry, exhibiting a Compound Annual Growth Rate (CAGR) of 7.10% from 2019 to 2024, is poised for continued expansion. Driven by increasing consumer awareness of food sourcing and a growing preference for transparency, the market is segmented by food type (processed food, meat & poultry, dairy, beverages, and others) and distribution channels (supermarkets/hypermarkets, convenience stores, specialist stores, online retail, and others). Major players like Campbell Soup, General Mills, and Danone are actively shaping the market landscape, responding to consumer demand for clear labeling and ethically sourced products. The North American market, particularly the United States, holds a significant share, fueled by stringent labeling regulations and a well-established organic food sector. However, the market faces challenges such as fluctuating raw material prices and potential consumer confusion surrounding labeling regulations. Future growth will depend on addressing these challenges while capitalizing on rising consumer demand for healthier, ethically produced, and clearly labeled food products. The expansion of online retail channels and the increasing availability of organic and non-GMO products across various categories are anticipated to contribute significantly to market expansion in the coming years.
The forecast period (2025-2033) suggests continued growth, projected on the basis of the historical CAGR and anticipated market trends. Factors like growing health consciousness, increased disposable incomes in developing economies, and the evolving regulatory landscape will significantly influence market dynamics. Regional variations will persist, with North America and Europe maintaining substantial market shares, while Asia-Pacific is projected to witness robust growth due to rising consumer awareness and expanding middle classes. Successful strategies for industry players will involve investing in research and development to meet evolving consumer preferences, expanding into new markets, and ensuring supply chain efficiency to maintain competitiveness. Transparency and effective communication regarding GMO labeling will be crucial to building consumer trust and driving market growth.
GMO Labeled Food Industry: A Comprehensive Market Report (2019-2033)
This in-depth report provides a comprehensive analysis of the GMO Labeled Food industry, covering market size, segmentation, growth drivers, challenges, and key players. The report utilizes data from the historical period (2019-2024), the base year (2025), and forecasts the market's trajectory through the estimated year (2025) and forecast period (2025-2033). With a focus on actionable insights, this report is essential for industry stakeholders, investors, and anyone seeking to understand this dynamic market. The total market size in 2025 is estimated at USD xx Million.
GMO Labeled Food Industry Market Concentration & Innovation
The GMO labeled food industry exhibits a moderately concentrated market structure, with several large multinational companies holding significant market share. Key players like Campbell Soup, General Mills, and Kellogg Company (prior to its split) have historically dominated various segments, particularly processed foods. However, the rise of smaller, specialized brands focusing on organic and non-GMO products, such as Nature's Path Foods and Organic Valley, is challenging this established order. Market share data for 2024 suggests Campbell Soup holds approximately xx% of the market, while General Mills holds xx%, and Kellogg (prior to split) held xx%.
Innovation in this sector is driven by increasing consumer demand for transparency and healthier food choices. Companies are investing heavily in R&D to develop improved labeling technologies, enhance product quality, and improve supply chain traceability. Stringent regulatory frameworks, varying across regions, influence innovation trajectories. Consumer preferences for non-GMO options are driving the growth of substitutes, including organic and plant-based products. Mergers and acquisitions (M&A) activity has been moderate but significant, with deal values averaging USD xx Million annually in the period 2020-2024, primarily focused on consolidating market share and expanding product portfolios.
GMO Labeled Food Industry Industry Trends & Insights
The GMO labeled food industry is experiencing robust growth, driven by heightened consumer awareness of food production methods and a growing preference for transparency and ethically sourced products. The market is projected to witness a Compound Annual Growth Rate (CAGR) of xx% during the forecast period (2025-2033), reaching a projected value of USD xx Million by 2033. This growth is fueled by several factors:
- Increasing consumer demand for transparency: Consumers are increasingly demanding clear labeling regarding the presence or absence of GMOs in food products.
- Growing health consciousness: A rising awareness of the potential health implications of GMOs is prompting consumers to opt for non-GMO labeled foods.
- Technological advancements: Innovations in genetic engineering and labeling technologies are improving the efficiency and accuracy of GMO detection and labeling.
- Expansion of online retail channels: The increasing adoption of e-commerce platforms for grocery shopping has widened access to a wider range of GMO labeled products.
- Stringent regulations: Government regulations and labeling mandates in several countries are promoting the adoption of GMO labeling.
Market penetration of GMO labeled food products has significantly increased in developed economies, surpassing xx% in several key markets. However, there remains significant untapped potential in developing regions. Competitive dynamics are shaping the market, with larger companies facing increasing competition from smaller, specialized brands catering to niche consumer preferences.
Dominant Markets & Segments in GMO Labeled Food Industry
The North American market currently dominates the GMO labeled food industry, driven by strong consumer demand, robust regulatory frameworks, and a well-established supply chain. Within this region, the United States holds the largest market share.
Key Drivers for North American Dominance:
- High consumer awareness and demand for GMO-labeled products.
- Well-developed infrastructure for food production, processing, and distribution.
- Stringent regulatory frameworks promoting transparency in food labeling.
- Strong economic conditions enabling consumers to afford premium-priced GMO-labeled products.
Dominant Segments:
- Type: Processed food constitutes the largest segment, followed by dairy and beverages. The "other types" segment includes a wide variety of products experiencing considerable growth due to increased demand for non-GMO options.
- Distribution Channel: Supermarket/hypermarkets remain the primary distribution channel, although online retail stores are witnessing rapid growth, fueled by consumer convenience and wider product availability.
GMO Labeled Food Industry Product Developments
Recent product innovations focus on enhancing the nutritional value of non-GMO foods and catering to specific dietary needs, such as gluten-free and vegan options. Technological advancements in food processing and packaging are enhancing product shelf life and reducing waste. These improvements provide significant competitive advantages, allowing companies to differentiate their products and cater to specific consumer preferences.
Report Scope & Segmentation Analysis
This report segments the GMO labeled food market by product type (Processed Food, Meat & Poultry, Dairy, Beverage, Other Types) and distribution channel (Supermarket/Hypermarket, Convenience Stores, Specialist Stores, Online Retail Stores, Other Distribution Channels). Each segment's growth projection, market size, and competitive dynamics are analyzed. For example, the processed food segment is projected to grow at a CAGR of xx% during the forecast period due to the increasing demand for convenience foods. Online retail is expected to witness higher growth compared to traditional channels, driven by the increasing adoption of e-commerce.
Key Drivers of GMO Labeled Food Industry Growth
Several factors contribute to the growth of the GMO labeled food industry:
- Rising consumer awareness: Increased awareness of GMOs' potential health and environmental impacts is driving demand for labeled products.
- Stringent regulations: Government regulations mandating GMO labeling are boosting market growth.
- Technological advancements: Innovations in labeling and genetic engineering improve product quality and transparency.
- Expansion of retail channels: Online grocery shopping increases accessibility to a wider range of labeled products.
Challenges in the GMO Labeled Food Industry Sector
The industry faces challenges including:
- High production costs: Non-GMO food production often entails higher costs, affecting product pricing and accessibility.
- Supply chain complexities: Ensuring consistent supply of non-GMO ingredients can be challenging, especially for smaller companies.
- Regulatory inconsistencies: Variations in labeling regulations across regions increase compliance complexity.
- Competition from conventional food products: Lower-priced conventional food products continue to present significant competition.
Emerging Opportunities in GMO Labeled Food Industry
Emerging opportunities include:
- Expanding into developing markets: Growing consumer awareness in developing countries presents significant untapped potential.
- Developing innovative products: Creating new product categories and formulations catering to specialized dietary requirements.
- Leveraging technology: Utilizing blockchain technology to improve supply chain transparency and traceability.
Leading Players in the GMO Labeled Food Industry Market
- Campbell Soup
- Nature's Path Foods
- Organic Valley
- Kerry Ingredients
- Danone
- Ingredion Incorporated
- Chipotle
- General Mills
- ConAgra Foods Inc
- Kellogg Company
Key Developments in GMO Labeled Food Industry Industry
- February 2023: Danone invested USD 65 Million to create a new production line in Florida, boosting its operational efficiency and sustainability.
- June 2022: Kellogg split into three independent companies, reshaping the market landscape.
- August 2021: Walmart launched a new line of great-value products with clear GMO or non-GMO labeling, impacting the retail sector.
Strategic Outlook for GMO Labeled Food Industry Market
The GMO labeled food industry is poised for continued expansion, driven by sustained consumer demand, technological advancements, and evolving regulatory landscapes. The market's future potential lies in catering to growing consumer preferences for transparency, health, and sustainability. Further expansion into developing markets and innovation in product development will be crucial for success in the years to come. Companies investing in supply chain optimization and sustainable practices will be well-positioned to capture significant market share.
GMO Labeled Food Industry Segmentation
-
1. Type
- 1.1. Processed Food
- 1.2. Meat & Poultry
- 1.3. Dairy
- 1.4. Beverage
- 1.5. Other Types
-
2. Distribution Channel
- 2.1. Supermarket/Hypermarket
- 2.2. Convenience Stores
- 2.3. Specialist Stores
- 2.4. Online Retail Stores
- 2.5. Other Distribution Channels
GMO Labeled Food Industry Segmentation By Geography
-
1. North America
- 1.1. United States
- 1.2. Canada
- 1.3. Mexico
- 1.4. Rest of North America
-
2. Europe
- 2.1. United Kingdom
- 2.2. Germany
- 2.3. France
- 2.4. Russia
- 2.5. Italy
- 2.6. Spain
- 2.7. Rest of Europe
-
3. Asia Pacific
- 3.1. India
- 3.2. China
- 3.3. Japan
- 3.4. Australia
- 3.5. Rest of Asia Pacific
-
4. South America
- 4.1. Brazil
- 4.2. Argentina
- 4.3. Rest of South America
- 5. Middle East
-
6. South Africa
- 6.1. United Arab of Emirates
- 6.2. Rest of Middle East

GMO Labeled Food Industry REPORT HIGHLIGHTS
| Aspects | Details |
|---|---|
| Study Period | 2019-2033 |
| Base Year | 2024 |
| Estimated Year | 2025 |
| Forecast Period | 2025-2033 |
| Historical Period | 2019-2024 |
| Growth Rate | CAGR of 7.10% from 2019-2033 |
| Segmentation |
|
Table of Contents
- 1. Introduction
- 1.1. Research Scope
- 1.2. Market Segmentation
- 1.3. Research Methodology
- 1.4. Definitions and Assumptions
- 2. Executive Summary
- 2.1. Introduction
- 3. Market Dynamics
- 3.1. Introduction
- 3.2. Market Drivers
- 3.2.1. Increased Application of Collagen in End-User Industry; Implementation of Business Strategies by Market Players
- 3.3. Market Restrains
- 3.3.1. Growing Inclination Toward Clean Label Products
- 3.4. Market Trends
- 3.4.1. Growing Consumer Awareness about labelling
- 4. Market Factor Analysis
- 4.1. Porters Five Forces
- 4.2. Supply/Value Chain
- 4.3. PESTEL analysis
- 4.4. Market Entropy
- 4.5. Patent/Trademark Analysis
- 5. Global GMO Labeled Food Industry Analysis, Insights and Forecast, 2019-2031
- 5.1. Market Analysis, Insights and Forecast - by Type
- 5.1.1. Processed Food
- 5.1.2. Meat & Poultry
- 5.1.3. Dairy
- 5.1.4. Beverage
- 5.1.5. Other Types
- 5.2. Market Analysis, Insights and Forecast - by Distribution Channel
- 5.2.1. Supermarket/Hypermarket
- 5.2.2. Convenience Stores
- 5.2.3. Specialist Stores
- 5.2.4. Online Retail Stores
- 5.2.5. Other Distribution Channels
- 5.3. Market Analysis, Insights and Forecast - by Region
- 5.3.1. North America
- 5.3.2. Europe
- 5.3.3. Asia Pacific
- 5.3.4. South America
- 5.3.5. Middle East
- 5.3.6. South Africa
- 5.1. Market Analysis, Insights and Forecast - by Type
- 6. North America GMO Labeled Food Industry Analysis, Insights and Forecast, 2019-2031
- 6.1. Market Analysis, Insights and Forecast - by Type
- 6.1.1. Processed Food
- 6.1.2. Meat & Poultry
- 6.1.3. Dairy
- 6.1.4. Beverage
- 6.1.5. Other Types
- 6.2. Market Analysis, Insights and Forecast - by Distribution Channel
- 6.2.1. Supermarket/Hypermarket
- 6.2.2. Convenience Stores
- 6.2.3. Specialist Stores
- 6.2.4. Online Retail Stores
- 6.2.5. Other Distribution Channels
- 6.1. Market Analysis, Insights and Forecast - by Type
- 7. Europe GMO Labeled Food Industry Analysis, Insights and Forecast, 2019-2031
- 7.1. Market Analysis, Insights and Forecast - by Type
- 7.1.1. Processed Food
- 7.1.2. Meat & Poultry
- 7.1.3. Dairy
- 7.1.4. Beverage
- 7.1.5. Other Types
- 7.2. Market Analysis, Insights and Forecast - by Distribution Channel
- 7.2.1. Supermarket/Hypermarket
- 7.2.2. Convenience Stores
- 7.2.3. Specialist Stores
- 7.2.4. Online Retail Stores
- 7.2.5. Other Distribution Channels
- 7.1. Market Analysis, Insights and Forecast - by Type
- 8. Asia Pacific GMO Labeled Food Industry Analysis, Insights and Forecast, 2019-2031
- 8.1. Market Analysis, Insights and Forecast - by Type
- 8.1.1. Processed Food
- 8.1.2. Meat & Poultry
- 8.1.3. Dairy
- 8.1.4. Beverage
- 8.1.5. Other Types
- 8.2. Market Analysis, Insights and Forecast - by Distribution Channel
- 8.2.1. Supermarket/Hypermarket
- 8.2.2. Convenience Stores
- 8.2.3. Specialist Stores
- 8.2.4. Online Retail Stores
- 8.2.5. Other Distribution Channels
- 8.1. Market Analysis, Insights and Forecast - by Type
- 9. South America GMO Labeled Food Industry Analysis, Insights and Forecast, 2019-2031
- 9.1. Market Analysis, Insights and Forecast - by Type
- 9.1.1. Processed Food
- 9.1.2. Meat & Poultry
- 9.1.3. Dairy
- 9.1.4. Beverage
- 9.1.5. Other Types
- 9.2. Market Analysis, Insights and Forecast - by Distribution Channel
- 9.2.1. Supermarket/Hypermarket
- 9.2.2. Convenience Stores
- 9.2.3. Specialist Stores
- 9.2.4. Online Retail Stores
- 9.2.5. Other Distribution Channels
- 9.1. Market Analysis, Insights and Forecast - by Type
- 10. Middle East GMO Labeled Food Industry Analysis, Insights and Forecast, 2019-2031
- 10.1. Market Analysis, Insights and Forecast - by Type
- 10.1.1. Processed Food
- 10.1.2. Meat & Poultry
- 10.1.3. Dairy
- 10.1.4. Beverage
- 10.1.5. Other Types
- 10.2. Market Analysis, Insights and Forecast - by Distribution Channel
- 10.2.1. Supermarket/Hypermarket
- 10.2.2. Convenience Stores
- 10.2.3. Specialist Stores
- 10.2.4. Online Retail Stores
- 10.2.5. Other Distribution Channels
- 10.1. Market Analysis, Insights and Forecast - by Type
- 11. South Africa GMO Labeled Food Industry Analysis, Insights and Forecast, 2019-2031
- 11.1. Market Analysis, Insights and Forecast - by Type
- 11.1.1. Processed Food
- 11.1.2. Meat & Poultry
- 11.1.3. Dairy
- 11.1.4. Beverage
- 11.1.5. Other Types
- 11.2. Market Analysis, Insights and Forecast - by Distribution Channel
- 11.2.1. Supermarket/Hypermarket
- 11.2.2. Convenience Stores
- 11.2.3. Specialist Stores
- 11.2.4. Online Retail Stores
- 11.2.5. Other Distribution Channels
- 11.1. Market Analysis, Insights and Forecast - by Type
- 12. North America GMO Labeled Food Industry Analysis, Insights and Forecast, 2019-2031
- 12.1. Market Analysis, Insights and Forecast - By Country/Sub-region
- 12.1.1 United States
- 12.1.2 Canada
- 12.1.3 Mexico
- 12.1.4 Rest of North America
- 13. Europe GMO Labeled Food Industry Analysis, Insights and Forecast, 2019-2031
- 13.1. Market Analysis, Insights and Forecast - By Country/Sub-region
- 13.1.1 United Kingdom
- 13.1.2 Germany
- 13.1.3 France
- 13.1.4 Russia
- 13.1.5 Italy
- 13.1.6 Spain
- 13.1.7 Rest of Europe
- 14. Asia Pacific GMO Labeled Food Industry Analysis, Insights and Forecast, 2019-2031
- 14.1. Market Analysis, Insights and Forecast - By Country/Sub-region
- 14.1.1 India
- 14.1.2 China
- 14.1.3 Japan
- 14.1.4 Australia
- 14.1.5 Rest of Asia Pacific
- 15. South America GMO Labeled Food Industry Analysis, Insights and Forecast, 2019-2031
- 15.1. Market Analysis, Insights and Forecast - By Country/Sub-region
- 15.1.1 Brazil
- 15.1.2 Argentina
- 15.1.3 Rest of South America
- 16. Middle East and Africa GMO Labeled Food Industry Analysis, Insights and Forecast, 2019-2031
- 16.1. Market Analysis, Insights and Forecast - By Country/Sub-region
- 16.1.1 South Africa
- 16.1.2 United Arab Emirates
- 16.1.3 Rest of Middle East and Africa
- 17. Competitive Analysis
- 17.1. Global Market Share Analysis 2024
- 17.2. Company Profiles
- 17.2.1 Campbell Soup
- 17.2.1.1. Overview
- 17.2.1.2. Products
- 17.2.1.3. SWOT Analysis
- 17.2.1.4. Recent Developments
- 17.2.1.5. Financials (Based on Availability)
- 17.2.2 Nature's Path Foods
- 17.2.2.1. Overview
- 17.2.2.2. Products
- 17.2.2.3. SWOT Analysis
- 17.2.2.4. Recent Developments
- 17.2.2.5. Financials (Based on Availability)
- 17.2.3 Organic Valley
- 17.2.3.1. Overview
- 17.2.3.2. Products
- 17.2.3.3. SWOT Analysis
- 17.2.3.4. Recent Developments
- 17.2.3.5. Financials (Based on Availability)
- 17.2.4 Kerry Ingredients
- 17.2.4.1. Overview
- 17.2.4.2. Products
- 17.2.4.3. SWOT Analysis
- 17.2.4.4. Recent Developments
- 17.2.4.5. Financials (Based on Availability)
- 17.2.5 Danone
- 17.2.5.1. Overview
- 17.2.5.2. Products
- 17.2.5.3. SWOT Analysis
- 17.2.5.4. Recent Developments
- 17.2.5.5. Financials (Based on Availability)
- 17.2.6 Ingredion Incorporated
- 17.2.6.1. Overview
- 17.2.6.2. Products
- 17.2.6.3. SWOT Analysis
- 17.2.6.4. Recent Developments
- 17.2.6.5. Financials (Based on Availability)
- 17.2.7 Chipotle
- 17.2.7.1. Overview
- 17.2.7.2. Products
- 17.2.7.3. SWOT Analysis
- 17.2.7.4. Recent Developments
- 17.2.7.5. Financials (Based on Availability)
- 17.2.8 General Mills
- 17.2.8.1. Overview
- 17.2.8.2. Products
- 17.2.8.3. SWOT Analysis
- 17.2.8.4. Recent Developments
- 17.2.8.5. Financials (Based on Availability)
- 17.2.9 ConAgra Foods Inc
- 17.2.9.1. Overview
- 17.2.9.2. Products
- 17.2.9.3. SWOT Analysis
- 17.2.9.4. Recent Developments
- 17.2.9.5. Financials (Based on Availability)
- 17.2.10 Kellogg Company
- 17.2.10.1. Overview
- 17.2.10.2. Products
- 17.2.10.3. SWOT Analysis
- 17.2.10.4. Recent Developments
- 17.2.10.5. Financials (Based on Availability)
- 17.2.1 Campbell Soup
List of Figures
- Figure 1: Global GMO Labeled Food Industry Revenue Breakdown (Million, %) by Region 2024 & 2032
- Figure 2: North America GMO Labeled Food Industry Revenue (Million), by Country 2024 & 2032
- Figure 3: North America GMO Labeled Food Industry Revenue Share (%), by Country 2024 & 2032
- Figure 4: Europe GMO Labeled Food Industry Revenue (Million), by Country 2024 & 2032
- Figure 5: Europe GMO Labeled Food Industry Revenue Share (%), by Country 2024 & 2032
- Figure 6: Asia Pacific GMO Labeled Food Industry Revenue (Million), by Country 2024 & 2032
- Figure 7: Asia Pacific GMO Labeled Food Industry Revenue Share (%), by Country 2024 & 2032
- Figure 8: South America GMO Labeled Food Industry Revenue (Million), by Country 2024 & 2032
- Figure 9: South America GMO Labeled Food Industry Revenue Share (%), by Country 2024 & 2032
- Figure 10: Middle East and Africa GMO Labeled Food Industry Revenue (Million), by Country 2024 & 2032
- Figure 11: Middle East and Africa GMO Labeled Food Industry Revenue Share (%), by Country 2024 & 2032
- Figure 12: North America GMO Labeled Food Industry Revenue (Million), by Type 2024 & 2032
- Figure 13: North America GMO Labeled Food Industry Revenue Share (%), by Type 2024 & 2032
- Figure 14: North America GMO Labeled Food Industry Revenue (Million), by Distribution Channel 2024 & 2032
- Figure 15: North America GMO Labeled Food Industry Revenue Share (%), by Distribution Channel 2024 & 2032
- Figure 16: North America GMO Labeled Food Industry Revenue (Million), by Country 2024 & 2032
- Figure 17: North America GMO Labeled Food Industry Revenue Share (%), by Country 2024 & 2032
- Figure 18: Europe GMO Labeled Food Industry Revenue (Million), by Type 2024 & 2032
- Figure 19: Europe GMO Labeled Food Industry Revenue Share (%), by Type 2024 & 2032
- Figure 20: Europe GMO Labeled Food Industry Revenue (Million), by Distribution Channel 2024 & 2032
- Figure 21: Europe GMO Labeled Food Industry Revenue Share (%), by Distribution Channel 2024 & 2032
- Figure 22: Europe GMO Labeled Food Industry Revenue (Million), by Country 2024 & 2032
- Figure 23: Europe GMO Labeled Food Industry Revenue Share (%), by Country 2024 & 2032
- Figure 24: Asia Pacific GMO Labeled Food Industry Revenue (Million), by Type 2024 & 2032
- Figure 25: Asia Pacific GMO Labeled Food Industry Revenue Share (%), by Type 2024 & 2032
- Figure 26: Asia Pacific GMO Labeled Food Industry Revenue (Million), by Distribution Channel 2024 & 2032
- Figure 27: Asia Pacific GMO Labeled Food Industry Revenue Share (%), by Distribution Channel 2024 & 2032
- Figure 28: Asia Pacific GMO Labeled Food Industry Revenue (Million), by Country 2024 & 2032
- Figure 29: Asia Pacific GMO Labeled Food Industry Revenue Share (%), by Country 2024 & 2032
- Figure 30: South America GMO Labeled Food Industry Revenue (Million), by Type 2024 & 2032
- Figure 31: South America GMO Labeled Food Industry Revenue Share (%), by Type 2024 & 2032
- Figure 32: South America GMO Labeled Food Industry Revenue (Million), by Distribution Channel 2024 & 2032
- Figure 33: South America GMO Labeled Food Industry Revenue Share (%), by Distribution Channel 2024 & 2032
- Figure 34: South America GMO Labeled Food Industry Revenue (Million), by Country 2024 & 2032
- Figure 35: South America GMO Labeled Food Industry Revenue Share (%), by Country 2024 & 2032
- Figure 36: Middle East GMO Labeled Food Industry Revenue (Million), by Type 2024 & 2032
- Figure 37: Middle East GMO Labeled Food Industry Revenue Share (%), by Type 2024 & 2032
- Figure 38: Middle East GMO Labeled Food Industry Revenue (Million), by Distribution Channel 2024 & 2032
- Figure 39: Middle East GMO Labeled Food Industry Revenue Share (%), by Distribution Channel 2024 & 2032
- Figure 40: Middle East GMO Labeled Food Industry Revenue (Million), by Country 2024 & 2032
- Figure 41: Middle East GMO Labeled Food Industry Revenue Share (%), by Country 2024 & 2032
- Figure 42: South Africa GMO Labeled Food Industry Revenue (Million), by Type 2024 & 2032
- Figure 43: South Africa GMO Labeled Food Industry Revenue Share (%), by Type 2024 & 2032
- Figure 44: South Africa GMO Labeled Food Industry Revenue (Million), by Distribution Channel 2024 & 2032
- Figure 45: South Africa GMO Labeled Food Industry Revenue Share (%), by Distribution Channel 2024 & 2032
- Figure 46: South Africa GMO Labeled Food Industry Revenue (Million), by Country 2024 & 2032
- Figure 47: South Africa GMO Labeled Food Industry Revenue Share (%), by Country 2024 & 2032
List of Tables
- Table 1: Global GMO Labeled Food Industry Revenue Million Forecast, by Region 2019 & 2032
- Table 2: Global GMO Labeled Food Industry Revenue Million Forecast, by Type 2019 & 2032
- Table 3: Global GMO Labeled Food Industry Revenue Million Forecast, by Distribution Channel 2019 & 2032
- Table 4: Global GMO Labeled Food Industry Revenue Million Forecast, by Region 2019 & 2032
- Table 5: Global GMO Labeled Food Industry Revenue Million Forecast, by Country 2019 & 2032
- Table 6: United States GMO Labeled Food Industry Revenue (Million) Forecast, by Application 2019 & 2032
- Table 7: Canada GMO Labeled Food Industry Revenue (Million) Forecast, by Application 2019 & 2032
- Table 8: Mexico GMO Labeled Food Industry Revenue (Million) Forecast, by Application 2019 & 2032
- Table 9: Rest of North America GMO Labeled Food Industry Revenue (Million) Forecast, by Application 2019 & 2032
- Table 10: Global GMO Labeled Food Industry Revenue Million Forecast, by Country 2019 & 2032
- Table 11: United Kingdom GMO Labeled Food Industry Revenue (Million) Forecast, by Application 2019 & 2032
- Table 12: Germany GMO Labeled Food Industry Revenue (Million) Forecast, by Application 2019 & 2032
- Table 13: France GMO Labeled Food Industry Revenue (Million) Forecast, by Application 2019 & 2032
- Table 14: Russia GMO Labeled Food Industry Revenue (Million) Forecast, by Application 2019 & 2032
- Table 15: Italy GMO Labeled Food Industry Revenue (Million) Forecast, by Application 2019 & 2032
- Table 16: Spain GMO Labeled Food Industry Revenue (Million) Forecast, by Application 2019 & 2032
- Table 17: Rest of Europe GMO Labeled Food Industry Revenue (Million) Forecast, by Application 2019 & 2032
- Table 18: Global GMO Labeled Food Industry Revenue Million Forecast, by Country 2019 & 2032
- Table 19: India GMO Labeled Food Industry Revenue (Million) Forecast, by Application 2019 & 2032
- Table 20: China GMO Labeled Food Industry Revenue (Million) Forecast, by Application 2019 & 2032
- Table 21: Japan GMO Labeled Food Industry Revenue (Million) Forecast, by Application 2019 & 2032
- Table 22: Australia GMO Labeled Food Industry Revenue (Million) Forecast, by Application 2019 & 2032
- Table 23: Rest of Asia Pacific GMO Labeled Food Industry Revenue (Million) Forecast, by Application 2019 & 2032
- Table 24: Global GMO Labeled Food Industry Revenue Million Forecast, by Country 2019 & 2032
- Table 25: Brazil GMO Labeled Food Industry Revenue (Million) Forecast, by Application 2019 & 2032
- Table 26: Argentina GMO Labeled Food Industry Revenue (Million) Forecast, by Application 2019 & 2032
- Table 27: Rest of South America GMO Labeled Food Industry Revenue (Million) Forecast, by Application 2019 & 2032
- Table 28: Global GMO Labeled Food Industry Revenue Million Forecast, by Country 2019 & 2032
- Table 29: South Africa GMO Labeled Food Industry Revenue (Million) Forecast, by Application 2019 & 2032
- Table 30: United Arab Emirates GMO Labeled Food Industry Revenue (Million) Forecast, by Application 2019 & 2032
- Table 31: Rest of Middle East and Africa GMO Labeled Food Industry Revenue (Million) Forecast, by Application 2019 & 2032
- Table 32: Global GMO Labeled Food Industry Revenue Million Forecast, by Type 2019 & 2032
- Table 33: Global GMO Labeled Food Industry Revenue Million Forecast, by Distribution Channel 2019 & 2032
- Table 34: Global GMO Labeled Food Industry Revenue Million Forecast, by Country 2019 & 2032
- Table 35: United States GMO Labeled Food Industry Revenue (Million) Forecast, by Application 2019 & 2032
- Table 36: Canada GMO Labeled Food Industry Revenue (Million) Forecast, by Application 2019 & 2032
- Table 37: Mexico GMO Labeled Food Industry Revenue (Million) Forecast, by Application 2019 & 2032
- Table 38: Rest of North America GMO Labeled Food Industry Revenue (Million) Forecast, by Application 2019 & 2032
- Table 39: Global GMO Labeled Food Industry Revenue Million Forecast, by Type 2019 & 2032
- Table 40: Global GMO Labeled Food Industry Revenue Million Forecast, by Distribution Channel 2019 & 2032
- Table 41: Global GMO Labeled Food Industry Revenue Million Forecast, by Country 2019 & 2032
- Table 42: United Kingdom GMO Labeled Food Industry Revenue (Million) Forecast, by Application 2019 & 2032
- Table 43: Germany GMO Labeled Food Industry Revenue (Million) Forecast, by Application 2019 & 2032
- Table 44: France GMO Labeled Food Industry Revenue (Million) Forecast, by Application 2019 & 2032
- Table 45: Russia GMO Labeled Food Industry Revenue (Million) Forecast, by Application 2019 & 2032
- Table 46: Italy GMO Labeled Food Industry Revenue (Million) Forecast, by Application 2019 & 2032
- Table 47: Spain GMO Labeled Food Industry Revenue (Million) Forecast, by Application 2019 & 2032
- Table 48: Rest of Europe GMO Labeled Food Industry Revenue (Million) Forecast, by Application 2019 & 2032
- Table 49: Global GMO Labeled Food Industry Revenue Million Forecast, by Type 2019 & 2032
- Table 50: Global GMO Labeled Food Industry Revenue Million Forecast, by Distribution Channel 2019 & 2032
- Table 51: Global GMO Labeled Food Industry Revenue Million Forecast, by Country 2019 & 2032
- Table 52: India GMO Labeled Food Industry Revenue (Million) Forecast, by Application 2019 & 2032
- Table 53: China GMO Labeled Food Industry Revenue (Million) Forecast, by Application 2019 & 2032
- Table 54: Japan GMO Labeled Food Industry Revenue (Million) Forecast, by Application 2019 & 2032
- Table 55: Australia GMO Labeled Food Industry Revenue (Million) Forecast, by Application 2019 & 2032
- Table 56: Rest of Asia Pacific GMO Labeled Food Industry Revenue (Million) Forecast, by Application 2019 & 2032
- Table 57: Global GMO Labeled Food Industry Revenue Million Forecast, by Type 2019 & 2032
- Table 58: Global GMO Labeled Food Industry Revenue Million Forecast, by Distribution Channel 2019 & 2032
- Table 59: Global GMO Labeled Food Industry Revenue Million Forecast, by Country 2019 & 2032
- Table 60: Brazil GMO Labeled Food Industry Revenue (Million) Forecast, by Application 2019 & 2032
- Table 61: Argentina GMO Labeled Food Industry Revenue (Million) Forecast, by Application 2019 & 2032
- Table 62: Rest of South America GMO Labeled Food Industry Revenue (Million) Forecast, by Application 2019 & 2032
- Table 63: Global GMO Labeled Food Industry Revenue Million Forecast, by Type 2019 & 2032
- Table 64: Global GMO Labeled Food Industry Revenue Million Forecast, by Distribution Channel 2019 & 2032
- Table 65: Global GMO Labeled Food Industry Revenue Million Forecast, by Country 2019 & 2032
- Table 66: Global GMO Labeled Food Industry Revenue Million Forecast, by Type 2019 & 2032
- Table 67: Global GMO Labeled Food Industry Revenue Million Forecast, by Distribution Channel 2019 & 2032
- Table 68: Global GMO Labeled Food Industry Revenue Million Forecast, by Country 2019 & 2032
- Table 69: United Arab of Emirates GMO Labeled Food Industry Revenue (Million) Forecast, by Application 2019 & 2032
- Table 70: Rest of Middle East GMO Labeled Food Industry Revenue (Million) Forecast, by Application 2019 & 2032
Frequently Asked Questions
1. What is the projected Compound Annual Growth Rate (CAGR) of the GMO Labeled Food Industry?
The projected CAGR is approximately 7.10%.
2. Which companies are prominent players in the GMO Labeled Food Industry?
Key companies in the market include Campbell Soup, Nature's Path Foods, Organic Valley, Kerry Ingredients, Danone, Ingredion Incorporated, Chipotle, General Mills, ConAgra Foods Inc, Kellogg Company.
3. What are the main segments of the GMO Labeled Food Industry?
The market segments include Type, Distribution Channel.
4. Can you provide details about the market size?
The market size is estimated to be USD XX Million as of 2022.
5. What are some drivers contributing to market growth?
Increased Application of Collagen in End-User Industry; Implementation of Business Strategies by Market Players.
6. What are the notable trends driving market growth?
Growing Consumer Awareness about labelling.
7. Are there any restraints impacting market growth?
Growing Inclination Toward Clean Label Products.
8. Can you provide examples of recent developments in the market?
February 2023: Danone, a leading food and beverage company, announced it would invest up to USD 65 million over the next two years to create a new production line in Jacksonville, Florida. The investment will support Danone North America's long-term growth strategy and deliver key benefits across the U.S. business, including advancing operational excellence, accelerating the company's sustainability goals, and driving cost efficiencies.
9. What pricing options are available for accessing the report?
Pricing options include single-user, multi-user, and enterprise licenses priced at USD 4750, USD 5250, and USD 8750 respectively.
10. Is the market size provided in terms of value or volume?
The market size is provided in terms of value, measured in Million.
11. Are there any specific market keywords associated with the report?
Yes, the market keyword associated with the report is "GMO Labeled Food Industry," which aids in identifying and referencing the specific market segment covered.
12. How do I determine which pricing option suits my needs best?
The pricing options vary based on user requirements and access needs. Individual users may opt for single-user licenses, while businesses requiring broader access may choose multi-user or enterprise licenses for cost-effective access to the report.
13. Are there any additional resources or data provided in the GMO Labeled Food Industry report?
While the report offers comprehensive insights, it's advisable to review the specific contents or supplementary materials provided to ascertain if additional resources or data are available.
14. How can I stay updated on further developments or reports in the GMO Labeled Food Industry?
To stay informed about further developments, trends, and reports in the GMO Labeled Food Industry, consider subscribing to industry newsletters, following relevant companies and organizations, or regularly checking reputable industry news sources and publications.
Methodology
Step 1 - Identification of Relevant Samples Size from Population Database


Step 2 - Approaches for Defining Global Market Size (Value, Volume* & Price*)

Note*: In applicable scenarios
Step 3 - Data Sources
Primary Research
- Web Analytics
- Survey Reports
- Research Institute
- Latest Research Reports
- Opinion Leaders
Secondary Research
- Annual Reports
- White Paper
- Latest Press Release
- Industry Association
- Paid Database
- Investor Presentations

Step 4 - Data Triangulation
Involves using different sources of information in order to increase the validity of a study
These sources are likely to be stakeholders in a program - participants, other researchers, program staff, other community members, and so on.
Then we put all data in single framework & apply various statistical tools to find out the dynamic on the market.
During the analysis stage, feedback from the stakeholder groups would be compared to determine areas of agreement as well as areas of divergence


