

Key Insights
The global gold nanorods market is experiencing robust growth, driven by increasing applications across diverse sectors. The market's Compound Annual Growth Rate (CAGR) exceeding 10% from 2019 to 2024 indicates a significant upward trajectory. This expansion is fueled by the unique optical and electronic properties of gold nanorods, making them ideal for various applications, including medical diagnostics and therapeutics, sensing technologies, and the electronics industry. The medical and healthcare sector is a major driver, with gold nanorods playing a critical role in drug delivery, biosensing, and medical imaging. The burgeoning demand for advanced diagnostic tools and personalized medicine is further propelling market growth. Technological advancements in nanofabrication techniques are also contributing to the increasing availability and affordability of high-quality gold nanorods, expanding market accessibility. While challenges such as regulatory hurdles and potential toxicity concerns exist, the overall market outlook remains positive, driven by ongoing research and development efforts focused on enhancing the safety and efficacy of these nanomaterials. Significant regional variations are expected, with North America and Asia-Pacific anticipated to dominate due to strong technological infrastructure, research funding, and a thriving biomedical industry.
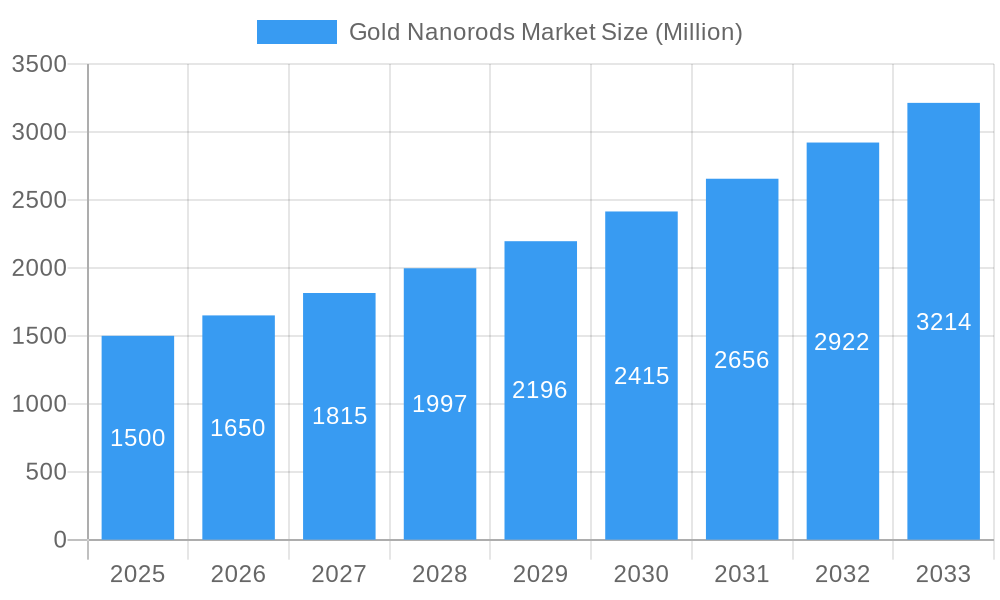
Gold Nanorods Market Market Size (In Billion)
The market segmentation by application reflects the versatility of gold nanorods. Sensing applications leverage their surface plasmon resonance properties for highly sensitive detection of various analytes. Medical and healthcare applications, as previously mentioned, encompass a wide range of uses, from targeted drug delivery to improved imaging contrast. The electronics industry benefits from their unique electrical conductivity and optical properties, integrating them into various electronic components and devices. Optical applications utilize their strong light absorption and scattering properties in areas such as optical limiting and sensing. Key players in the market, including established chemical companies and specialized nanomaterial manufacturers, are continuously innovating to improve product quality, expand applications, and cater to growing market demand. Further expansion is anticipated through strategic collaborations, mergers, and acquisitions within the industry. The forecast period (2025-2033) suggests continued strong growth, driven by the aforementioned factors, though fluctuations based on specific technological breakthroughs or economic conditions may naturally occur.
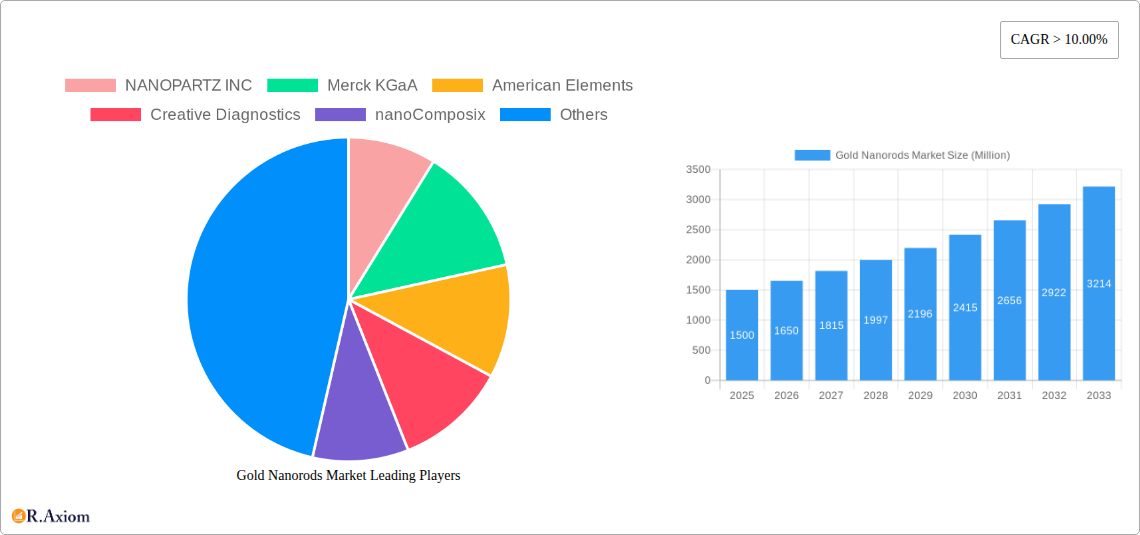
Gold Nanorods Market Company Market Share
Gold Nanorods Market: A Comprehensive Report (2019-2033)
This in-depth report provides a comprehensive analysis of the global Gold Nanorods market, offering invaluable insights for stakeholders, investors, and industry professionals. Covering the period from 2019 to 2033, with a focus on the base year 2025 and forecast period 2025-2033, this report delves into market dynamics, growth drivers, challenges, and future opportunities. The report uses data and analysis across key segments and geographies to provide a clear understanding of the current market landscape and future potential.
Gold Nanorods Market Concentration & Innovation
The Gold Nanorods market exhibits a moderately concentrated landscape, with key players like NANOPARTZ INC, Merck KGaA, American Elements, Creative Diagnostics, nanoComposix, Sona Nanotech Inc, Strem Chemicals Inc, and Cytodiagnostics Inc holding significant market share. However, the market also sees the emergence of smaller, specialized players, driving innovation. Market share data for 2025 estimates Merck KGaA holds approximately 25% of the market, followed by NANOPARTZ INC with 18%, while other players hold smaller, yet substantial shares, ranging from 5% to 12%. Innovation is driven by advancements in synthesis techniques, surface functionalization, and the exploration of novel applications. Regulatory frameworks, particularly concerning safety and environmental impact, are constantly evolving and influencing market dynamics. The market has witnessed several mergers and acquisitions (M&A) in recent years, with deal values averaging approximately $xx Million per transaction. These M&A activities demonstrate the consolidation trend within the industry and a drive for expanded market reach and technological capabilities. Product substitutes, such as other types of nanomaterials, present competitive challenges, but the unique properties of gold nanorods continue to drive demand across diverse sectors. The medical & healthcare sector displays strong end-user trends, leading to significant growth projections in this segment.
- Market Concentration: Moderately concentrated, with top players holding significant shares.
- Innovation Drivers: Advancements in synthesis, functionalization, and application exploration.
- Regulatory Landscape: Evolving regulations impacting market dynamics.
- M&A Activity: Ongoing consolidation through mergers and acquisitions.
- Product Substitutes: Competition from alternative nanomaterials.
Gold Nanorods Market Industry Trends & Insights
The global Gold Nanorods market is demonstrating remarkable growth, with a projected Compound Annual Growth Rate (CAGR) of 12.5% during the forecast period (2025-2033). This upward trajectory is significantly influenced by the escalating demand from the medical & healthcare sector for advanced diagnostics and targeted therapeutics. Furthermore, the increasing integration of gold nanorods in electronic devices, enhancing performance characteristics, and their burgeoning adoption in sophisticated optical applications such as highly sensitive biosensors and advanced imaging technologies are key accelerators.
Technological innovations, particularly in the development of more efficient, scalable, and cost-effective synthesis methodologies, are fundamentally reshaping the market and paving the way for wider accessibility. Shifting consumer preferences towards technologically advanced and high-performance products across a spectrum of industries are also contributing to sustained demand. The market landscape is characterized by intense competition, with established industry leaders heavily investing in research and development to broaden their product portfolios, refine existing offerings, and strengthen their market presence. This dynamic competitive environment is further invigorated by the strategic entry of agile new players and the continuous emergence of disruptive technologies. While market penetration remains highest in developed economies, attributed to greater awareness and more established technological infrastructure, developing economies present substantial growth potential, driven by rising disposable incomes and increasing investments in healthcare and research facilities.
Dominant Markets & Segments in Gold Nanorods Market
The North American region currently dominates the Gold Nanorods market, driven by robust research and development activities, high technological adoption rates, and the significant presence of key players. The medical and healthcare segment constitutes the largest application market share, driven by the increasing use of gold nanorods in diagnostics, drug delivery, and theranostics.
Key Drivers for North American Dominance:
- Strong investment in R&D.
- High technological adoption rates.
- Presence of major market players.
- Favorable regulatory environment.
Medical & Healthcare Segment Dominance:
- Growing demand for advanced diagnostic tools.
- Rise of targeted drug delivery systems.
- Increasing prevalence of chronic diseases.
Other significant regional markets include Europe and Asia-Pacific, exhibiting strong growth potential driven by increasing investment in healthcare infrastructure and technological advancements.
Gold Nanorods Market Product Developments
Recent product innovations focus on enhancing the biocompatibility, stability, and functionality of gold nanorods. This involves developing novel surface modifications and improving synthesis methods to achieve precise control over size, shape, and optical properties. New applications are being explored in areas such as targeted drug delivery, photothermal therapy, and advanced sensing technologies. These developments provide competitive advantages to companies, allowing them to offer superior product performance and expand into new market segments. The market is seeing a trend towards functionalized gold nanorods, which offer enhanced properties for specific applications.
Report Scope & Segmentation Analysis
This comprehensive report meticulously segments the Gold Nanorods market by application, providing in-depth analysis across the following key areas: Sensing, Medical & Healthcare, Electronic Industry, Optical Applications, and Others. Each segment is thoroughly examined to offer granular insights into market size, growth projections, and the prevailing competitive dynamics.
Sensing: This segment is poised for robust expansion, propelled by the growing imperative for highly sensitive and selective detection technologies across diverse sectors, including critical environmental monitoring and advanced diagnostics in healthcare.
Medical & Healthcare: Currently the largest segment, it is expected to maintain its substantial growth momentum. This is largely due to the pervasive and expanding utility of gold nanorods in sophisticated diagnostic imaging techniques, precision drug delivery systems, and innovative therapeutic interventions.
Electronic Industry: This segment demonstrates promising potential for steady and consistent growth, underpinned by the increasing integration of gold nanorods in next-generation electronic devices to achieve superior conductivity and enhanced overall performance.
Optical Applications: The adoption of gold nanorods in advanced optical devices and sensors is on the rise, driven by their capability to deliver significantly enhanced functionality and superior performance characteristics.
Others: This segment encapsulates a range of other emerging and niche applications, representing a fertile ground for potential future growth and innovation in the gold nanorods market.
Key Drivers of Gold Nanorods Market Growth
A confluence of potent factors is driving the expansive growth of the Gold Nanorods market. Paramount among these are continuous technological advancements, which have led to significant improvements in synthesis techniques, enabling greater control over nanoparticle properties, and enhancing their biocompatibility. The escalating demand for cutting-edge diagnostic and therapeutic tools within the healthcare sector is a primary impetus for market expansion. Furthermore, supportive government regulations and increased funding allocated to nanotechnology research are actively fostering market growth. The synergistic adoption of gold nanorods in the electronic and optical applications industries also contributes significantly to this robust market expansion.
Challenges in the Gold Nanorods Market Sector
Challenges include the high cost of production, stringent regulatory requirements, and concerns regarding the potential toxicity of nanomaterials. Supply chain disruptions can also impact market stability. Intense competition among existing and emerging players poses another significant challenge. The regulatory landscape varies across regions, leading to complexities in product approvals and commercialization. The estimated overall impact of these challenges on market growth is approximately xx% annually.
Emerging Opportunities in Gold Nanorods Market
Significant emerging opportunities exist in strategically expanding into new geographical markets and pioneering innovative applications, particularly in rapidly evolving fields such as personalized medicine and effective environmental remediation solutions. Advances in nanofabrication techniques and sophisticated surface functionalization methods are opening new avenues for the creation of highly specialized gold nanorods tailored for specific, high-value applications. Ongoing research focused on improving biocompatibility and reducing toxicity will undoubtedly unlock new and wider application potentials. Moreover, the exploration of novel optical properties and their translation into groundbreaking applications represents a key frontier for future market growth and innovation.
Leading Players in the Gold Nanorods Market Market
Key Developments in Gold Nanorods Market Industry
- 2022-Q4: Merck KGaA unveiled a novel range of functionalized gold nanorods engineered for superior biocompatibility, marking a significant step forward in medical applications.
- 2023-Q1: NANOPARTZ INC inaugurated a new high-throughput synthesis facility, substantially boosting its production capacity and ability to meet growing market demand.
- 2023-Q3: A strategic joint venture was formed between Sona Nanotech and a prominent medical device company, aimed at co-developing advanced gold nanorod-based diagnostic tools.
- 2024-Q2: nanoComposix secured substantial investment capital to aggressively expand its research and development initiatives focused on advanced optical applications of gold nanorods.
Strategic Outlook for Gold Nanorods Market Market
The future of the Gold Nanorods market is promising, driven by ongoing technological advancements, increasing demand from diverse sectors, and the exploration of new applications. The market is expected to continue its growth trajectory, with significant opportunities arising from personalized medicine, advanced diagnostics, and innovative applications in the electronics and optical industries. Continued investment in R&D and strategic collaborations among industry players will be essential for capturing the market's full potential. Further developments in surface functionalization and synthesis techniques will unlock new possibilities for leveraging the unique properties of gold nanorods.
Gold Nanorods Market Segmentation
-
1. Application
- 1.1. Sensing
- 1.2. Medical & Healthcare
- 1.3. Electronic Industry
- 1.4. Optical Applications
- 1.5. Others
Gold Nanorods Market Segmentation By Geography
-
1. Asia Pacific
- 1.1. China
- 1.2. India
- 1.3. Japan
- 1.4. South Korea
- 1.5. Rest of Asia Pacific
-
2. North America
- 2.1. United States
- 2.2. Canada
- 2.3. Mexico
-
3. Europe
- 3.1. Germany
- 3.2. United Kingdom
- 3.3. Italy
- 3.4. France
- 3.5. Rest of Europe
-
4. South America
- 4.1. Brazil
- 4.2. Argentina
- 4.3. Rest of South America
- 5. Middle East
-
6. Saudi Arabia
- 6.1. South Africa
- 6.2. Rest of Middle East
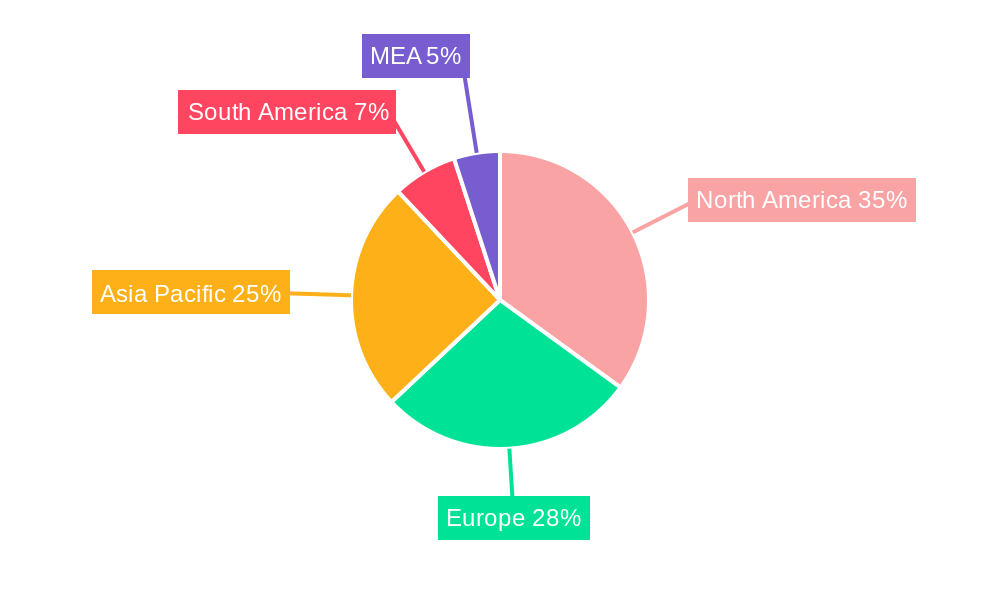
Gold Nanorods Market Regional Market Share
Geographic Coverage of Gold Nanorods Market
Gold Nanorods Market REPORT HIGHLIGHTS
| Aspects | Details |
|---|---|
| Study Period | 2020-2034 |
| Base Year | 2025 |
| Estimated Year | 2026 |
| Forecast Period | 2026-2034 |
| Historical Period | 2020-2025 |
| Growth Rate | CAGR of 11.7% from 2020-2034 |
| Segmentation |
|
Table of Contents
- 1. Introduction
- 1.1. Research Scope
- 1.2. Market Segmentation
- 1.3. Research Objective
- 1.4. Definitions and Assumptions
- 2. Executive Summary
- 2.1. Market Snapshot
- 3. Market Dynamics
- 3.1. Market Drivers
- 3.2. Market Restrains
- 3.3. Market Trends
- 3.4. Market Opportunities
- 4. Market Factor Analysis
- 4.1. Porters Five Forces
- 4.1.1. Bargaining Power of Suppliers
- 4.1.2. Bargaining Power of Buyers
- 4.1.3. Threat of New Entrants
- 4.1.4. Threat of Substitutes
- 4.1.5. Competitive Rivalry
- 4.2. PESTEL analysis
- 4.3. BCG Analysis
- 4.3.1. Stars (High Growth, High Market Share)
- 4.3.2. Cash Cows (Low Growth, High Market Share)
- 4.3.3. Question Mark (High Growth, Low Market Share)
- 4.3.4. Dogs (Low Growth, Low Market Share)
- 4.4. Ansoff Matrix Analysis
- 4.5. Supply Chain Analysis
- 4.6. Regulatory Landscape
- 4.7. Current Market Potential and Opportunity Assessment (TAM–SAM–SOM Framework)
- 4.8. RAX Analyst Note
- 4.1. Porters Five Forces
- 5. Market Analysis, Insights and Forecast 2021-2033
- 5.1. Market Analysis, Insights and Forecast - by Application
- 5.1.1. Sensing
- 5.1.2. Medical & Healthcare
- 5.1.3. Electronic Industry
- 5.1.4. Optical Applications
- 5.1.5. Others
- 5.2. Market Analysis, Insights and Forecast - by Region
- 5.2.1. Asia Pacific
- 5.2.2. North America
- 5.2.3. Europe
- 5.2.4. South America
- 5.2.5. Middle East
- 5.2.6. Saudi Arabia
- 5.1. Market Analysis, Insights and Forecast - by Application
- 6. Global Gold Nanorods Market Analysis, Insights and Forecast, 2021-2033
- 6.1. Market Analysis, Insights and Forecast - by Application
- 6.1.1. Sensing
- 6.1.2. Medical & Healthcare
- 6.1.3. Electronic Industry
- 6.1.4. Optical Applications
- 6.1.5. Others
- 6.1. Market Analysis, Insights and Forecast - by Application
- 7. Asia Pacific Gold Nanorods Market Analysis, Insights and Forecast, 2020-2032
- 7.1. Market Analysis, Insights and Forecast - by Application
- 7.1.1. Sensing
- 7.1.2. Medical & Healthcare
- 7.1.3. Electronic Industry
- 7.1.4. Optical Applications
- 7.1.5. Others
- 7.1. Market Analysis, Insights and Forecast - by Application
- 8. North America Gold Nanorods Market Analysis, Insights and Forecast, 2020-2032
- 8.1. Market Analysis, Insights and Forecast - by Application
- 8.1.1. Sensing
- 8.1.2. Medical & Healthcare
- 8.1.3. Electronic Industry
- 8.1.4. Optical Applications
- 8.1.5. Others
- 8.1. Market Analysis, Insights and Forecast - by Application
- 9. Europe Gold Nanorods Market Analysis, Insights and Forecast, 2020-2032
- 9.1. Market Analysis, Insights and Forecast - by Application
- 9.1.1. Sensing
- 9.1.2. Medical & Healthcare
- 9.1.3. Electronic Industry
- 9.1.4. Optical Applications
- 9.1.5. Others
- 9.1. Market Analysis, Insights and Forecast - by Application
- 10. South America Gold Nanorods Market Analysis, Insights and Forecast, 2020-2032
- 10.1. Market Analysis, Insights and Forecast - by Application
- 10.1.1. Sensing
- 10.1.2. Medical & Healthcare
- 10.1.3. Electronic Industry
- 10.1.4. Optical Applications
- 10.1.5. Others
- 10.1. Market Analysis, Insights and Forecast - by Application
- 11. Middle East Gold Nanorods Market Analysis, Insights and Forecast, 2020-2032
- 11.1. Market Analysis, Insights and Forecast - by Application
- 11.1.1. Sensing
- 11.1.2. Medical & Healthcare
- 11.1.3. Electronic Industry
- 11.1.4. Optical Applications
- 11.1.5. Others
- 11.1. Market Analysis, Insights and Forecast - by Application
- 12. Saudi Arabia Gold Nanorods Market Analysis, Insights and Forecast, 2020-2032
- 12.1. Market Analysis, Insights and Forecast - by Application
- 12.1.1. Sensing
- 12.1.2. Medical & Healthcare
- 12.1.3. Electronic Industry
- 12.1.4. Optical Applications
- 12.1.5. Others
- 12.1. Market Analysis, Insights and Forecast - by Application
- 13. Competitive Analysis
- 13.1. Company Profiles
- 13.1.1 NANOPARTZ INC
- 13.1.1.1. Company Overview
- 13.1.1.2. Products
- 13.1.1.3. Company Financials
- 13.1.1.4. SWOT Analysis
- 13.1.2 Merck KGaA
- 13.1.2.1. Company Overview
- 13.1.2.2. Products
- 13.1.2.3. Company Financials
- 13.1.2.4. SWOT Analysis
- 13.1.3 American Elements
- 13.1.3.1. Company Overview
- 13.1.3.2. Products
- 13.1.3.3. Company Financials
- 13.1.3.4. SWOT Analysis
- 13.1.4 Creative Diagnostics
- 13.1.4.1. Company Overview
- 13.1.4.2. Products
- 13.1.4.3. Company Financials
- 13.1.4.4. SWOT Analysis
- 13.1.5 nanoComposix
- 13.1.5.1. Company Overview
- 13.1.5.2. Products
- 13.1.5.3. Company Financials
- 13.1.5.4. SWOT Analysis
- 13.1.6 Sona Nanotech Inc
- 13.1.6.1. Company Overview
- 13.1.6.2. Products
- 13.1.6.3. Company Financials
- 13.1.6.4. SWOT Analysis
- 13.1.7 Strem Chemicals Inc
- 13.1.7.1. Company Overview
- 13.1.7.2. Products
- 13.1.7.3. Company Financials
- 13.1.7.4. SWOT Analysis
- 13.1.8 Cytodiagnostics Inc
- 13.1.8.1. Company Overview
- 13.1.8.2. Products
- 13.1.8.3. Company Financials
- 13.1.8.4. SWOT Analysis
- 13.1.1 NANOPARTZ INC
- 13.2. Market Entropy
- 13.2.1 Company's Key Areas Served
- 13.2.2 Recent Developments
- 13.3. Company Market Share Analysis 2025
- 13.3.1 Top 5 Companies Market Share Analysis
- 13.3.2 Top 3 Companies Market Share Analysis
- 13.4. List of Potential Customers
- 14. Research Methodology
List of Figures
- Figure 1: Global Gold Nanorods Market Revenue Breakdown (million, %) by Region 2025 & 2033
- Figure 2: Global Gold Nanorods Market Volume Breakdown (K Tons, %) by Region 2025 & 2033
- Figure 3: Asia Pacific Gold Nanorods Market Revenue (million), by Application 2025 & 2033
- Figure 4: Asia Pacific Gold Nanorods Market Volume (K Tons), by Application 2025 & 2033
- Figure 5: Asia Pacific Gold Nanorods Market Revenue Share (%), by Application 2025 & 2033
- Figure 6: Asia Pacific Gold Nanorods Market Volume Share (%), by Application 2025 & 2033
- Figure 7: Asia Pacific Gold Nanorods Market Revenue (million), by Country 2025 & 2033
- Figure 8: Asia Pacific Gold Nanorods Market Volume (K Tons), by Country 2025 & 2033
- Figure 9: Asia Pacific Gold Nanorods Market Revenue Share (%), by Country 2025 & 2033
- Figure 10: Asia Pacific Gold Nanorods Market Volume Share (%), by Country 2025 & 2033
- Figure 11: North America Gold Nanorods Market Revenue (million), by Application 2025 & 2033
- Figure 12: North America Gold Nanorods Market Volume (K Tons), by Application 2025 & 2033
- Figure 13: North America Gold Nanorods Market Revenue Share (%), by Application 2025 & 2033
- Figure 14: North America Gold Nanorods Market Volume Share (%), by Application 2025 & 2033
- Figure 15: North America Gold Nanorods Market Revenue (million), by Country 2025 & 2033
- Figure 16: North America Gold Nanorods Market Volume (K Tons), by Country 2025 & 2033
- Figure 17: North America Gold Nanorods Market Revenue Share (%), by Country 2025 & 2033
- Figure 18: North America Gold Nanorods Market Volume Share (%), by Country 2025 & 2033
- Figure 19: Europe Gold Nanorods Market Revenue (million), by Application 2025 & 2033
- Figure 20: Europe Gold Nanorods Market Volume (K Tons), by Application 2025 & 2033
- Figure 21: Europe Gold Nanorods Market Revenue Share (%), by Application 2025 & 2033
- Figure 22: Europe Gold Nanorods Market Volume Share (%), by Application 2025 & 2033
- Figure 23: Europe Gold Nanorods Market Revenue (million), by Country 2025 & 2033
- Figure 24: Europe Gold Nanorods Market Volume (K Tons), by Country 2025 & 2033
- Figure 25: Europe Gold Nanorods Market Revenue Share (%), by Country 2025 & 2033
- Figure 26: Europe Gold Nanorods Market Volume Share (%), by Country 2025 & 2033
- Figure 27: South America Gold Nanorods Market Revenue (million), by Application 2025 & 2033
- Figure 28: South America Gold Nanorods Market Volume (K Tons), by Application 2025 & 2033
- Figure 29: South America Gold Nanorods Market Revenue Share (%), by Application 2025 & 2033
- Figure 30: South America Gold Nanorods Market Volume Share (%), by Application 2025 & 2033
- Figure 31: South America Gold Nanorods Market Revenue (million), by Country 2025 & 2033
- Figure 32: South America Gold Nanorods Market Volume (K Tons), by Country 2025 & 2033
- Figure 33: South America Gold Nanorods Market Revenue Share (%), by Country 2025 & 2033
- Figure 34: South America Gold Nanorods Market Volume Share (%), by Country 2025 & 2033
- Figure 35: Middle East Gold Nanorods Market Revenue (million), by Application 2025 & 2033
- Figure 36: Middle East Gold Nanorods Market Volume (K Tons), by Application 2025 & 2033
- Figure 37: Middle East Gold Nanorods Market Revenue Share (%), by Application 2025 & 2033
- Figure 38: Middle East Gold Nanorods Market Volume Share (%), by Application 2025 & 2033
- Figure 39: Middle East Gold Nanorods Market Revenue (million), by Country 2025 & 2033
- Figure 40: Middle East Gold Nanorods Market Volume (K Tons), by Country 2025 & 2033
- Figure 41: Middle East Gold Nanorods Market Revenue Share (%), by Country 2025 & 2033
- Figure 42: Middle East Gold Nanorods Market Volume Share (%), by Country 2025 & 2033
- Figure 43: Saudi Arabia Gold Nanorods Market Revenue (million), by Application 2025 & 2033
- Figure 44: Saudi Arabia Gold Nanorods Market Volume (K Tons), by Application 2025 & 2033
- Figure 45: Saudi Arabia Gold Nanorods Market Revenue Share (%), by Application 2025 & 2033
- Figure 46: Saudi Arabia Gold Nanorods Market Volume Share (%), by Application 2025 & 2033
- Figure 47: Saudi Arabia Gold Nanorods Market Revenue (million), by Country 2025 & 2033
- Figure 48: Saudi Arabia Gold Nanorods Market Volume (K Tons), by Country 2025 & 2033
- Figure 49: Saudi Arabia Gold Nanorods Market Revenue Share (%), by Country 2025 & 2033
- Figure 50: Saudi Arabia Gold Nanorods Market Volume Share (%), by Country 2025 & 2033
List of Tables
- Table 1: Global Gold Nanorods Market Revenue million Forecast, by Application 2020 & 2033
- Table 2: Global Gold Nanorods Market Volume K Tons Forecast, by Application 2020 & 2033
- Table 3: Global Gold Nanorods Market Revenue million Forecast, by Region 2020 & 2033
- Table 4: Global Gold Nanorods Market Volume K Tons Forecast, by Region 2020 & 2033
- Table 5: Global Gold Nanorods Market Revenue million Forecast, by Application 2020 & 2033
- Table 6: Global Gold Nanorods Market Volume K Tons Forecast, by Application 2020 & 2033
- Table 7: Global Gold Nanorods Market Revenue million Forecast, by Country 2020 & 2033
- Table 8: Global Gold Nanorods Market Volume K Tons Forecast, by Country 2020 & 2033
- Table 9: China Gold Nanorods Market Revenue (million) Forecast, by Application 2020 & 2033
- Table 10: China Gold Nanorods Market Volume (K Tons) Forecast, by Application 2020 & 2033
- Table 11: India Gold Nanorods Market Revenue (million) Forecast, by Application 2020 & 2033
- Table 12: India Gold Nanorods Market Volume (K Tons) Forecast, by Application 2020 & 2033
- Table 13: Japan Gold Nanorods Market Revenue (million) Forecast, by Application 2020 & 2033
- Table 14: Japan Gold Nanorods Market Volume (K Tons) Forecast, by Application 2020 & 2033
- Table 15: South Korea Gold Nanorods Market Revenue (million) Forecast, by Application 2020 & 2033
- Table 16: South Korea Gold Nanorods Market Volume (K Tons) Forecast, by Application 2020 & 2033
- Table 17: Rest of Asia Pacific Gold Nanorods Market Revenue (million) Forecast, by Application 2020 & 2033
- Table 18: Rest of Asia Pacific Gold Nanorods Market Volume (K Tons) Forecast, by Application 2020 & 2033
- Table 19: Global Gold Nanorods Market Revenue million Forecast, by Application 2020 & 2033
- Table 20: Global Gold Nanorods Market Volume K Tons Forecast, by Application 2020 & 2033
- Table 21: Global Gold Nanorods Market Revenue million Forecast, by Country 2020 & 2033
- Table 22: Global Gold Nanorods Market Volume K Tons Forecast, by Country 2020 & 2033
- Table 23: United States Gold Nanorods Market Revenue (million) Forecast, by Application 2020 & 2033
- Table 24: United States Gold Nanorods Market Volume (K Tons) Forecast, by Application 2020 & 2033
- Table 25: Canada Gold Nanorods Market Revenue (million) Forecast, by Application 2020 & 2033
- Table 26: Canada Gold Nanorods Market Volume (K Tons) Forecast, by Application 2020 & 2033
- Table 27: Mexico Gold Nanorods Market Revenue (million) Forecast, by Application 2020 & 2033
- Table 28: Mexico Gold Nanorods Market Volume (K Tons) Forecast, by Application 2020 & 2033
- Table 29: Global Gold Nanorods Market Revenue million Forecast, by Application 2020 & 2033
- Table 30: Global Gold Nanorods Market Volume K Tons Forecast, by Application 2020 & 2033
- Table 31: Global Gold Nanorods Market Revenue million Forecast, by Country 2020 & 2033
- Table 32: Global Gold Nanorods Market Volume K Tons Forecast, by Country 2020 & 2033
- Table 33: Germany Gold Nanorods Market Revenue (million) Forecast, by Application 2020 & 2033
- Table 34: Germany Gold Nanorods Market Volume (K Tons) Forecast, by Application 2020 & 2033
- Table 35: United Kingdom Gold Nanorods Market Revenue (million) Forecast, by Application 2020 & 2033
- Table 36: United Kingdom Gold Nanorods Market Volume (K Tons) Forecast, by Application 2020 & 2033
- Table 37: Italy Gold Nanorods Market Revenue (million) Forecast, by Application 2020 & 2033
- Table 38: Italy Gold Nanorods Market Volume (K Tons) Forecast, by Application 2020 & 2033
- Table 39: France Gold Nanorods Market Revenue (million) Forecast, by Application 2020 & 2033
- Table 40: France Gold Nanorods Market Volume (K Tons) Forecast, by Application 2020 & 2033
- Table 41: Rest of Europe Gold Nanorods Market Revenue (million) Forecast, by Application 2020 & 2033
- Table 42: Rest of Europe Gold Nanorods Market Volume (K Tons) Forecast, by Application 2020 & 2033
- Table 43: Global Gold Nanorods Market Revenue million Forecast, by Application 2020 & 2033
- Table 44: Global Gold Nanorods Market Volume K Tons Forecast, by Application 2020 & 2033
- Table 45: Global Gold Nanorods Market Revenue million Forecast, by Country 2020 & 2033
- Table 46: Global Gold Nanorods Market Volume K Tons Forecast, by Country 2020 & 2033
- Table 47: Brazil Gold Nanorods Market Revenue (million) Forecast, by Application 2020 & 2033
- Table 48: Brazil Gold Nanorods Market Volume (K Tons) Forecast, by Application 2020 & 2033
- Table 49: Argentina Gold Nanorods Market Revenue (million) Forecast, by Application 2020 & 2033
- Table 50: Argentina Gold Nanorods Market Volume (K Tons) Forecast, by Application 2020 & 2033
- Table 51: Rest of South America Gold Nanorods Market Revenue (million) Forecast, by Application 2020 & 2033
- Table 52: Rest of South America Gold Nanorods Market Volume (K Tons) Forecast, by Application 2020 & 2033
- Table 53: Global Gold Nanorods Market Revenue million Forecast, by Application 2020 & 2033
- Table 54: Global Gold Nanorods Market Volume K Tons Forecast, by Application 2020 & 2033
- Table 55: Global Gold Nanorods Market Revenue million Forecast, by Country 2020 & 2033
- Table 56: Global Gold Nanorods Market Volume K Tons Forecast, by Country 2020 & 2033
- Table 57: Global Gold Nanorods Market Revenue million Forecast, by Application 2020 & 2033
- Table 58: Global Gold Nanorods Market Volume K Tons Forecast, by Application 2020 & 2033
- Table 59: Global Gold Nanorods Market Revenue million Forecast, by Country 2020 & 2033
- Table 60: Global Gold Nanorods Market Volume K Tons Forecast, by Country 2020 & 2033
- Table 61: South Africa Gold Nanorods Market Revenue (million) Forecast, by Application 2020 & 2033
- Table 62: South Africa Gold Nanorods Market Volume (K Tons) Forecast, by Application 2020 & 2033
- Table 63: Rest of Middle East Gold Nanorods Market Revenue (million) Forecast, by Application 2020 & 2033
- Table 64: Rest of Middle East Gold Nanorods Market Volume (K Tons) Forecast, by Application 2020 & 2033
Frequently Asked Questions
1. What is the projected Compound Annual Growth Rate (CAGR) of the Gold Nanorods Market?
The projected CAGR is approximately 11.7%.
2. Which companies are prominent players in the Gold Nanorods Market?
Key companies in the market include NANOPARTZ INC, Merck KGaA, American Elements, Creative Diagnostics, nanoComposix, Sona Nanotech Inc, Strem Chemicals Inc, Cytodiagnostics Inc.
3. What are the main segments of the Gold Nanorods Market?
The market segments include Application.
4. Can you provide details about the market size?
The market size is estimated to be USD 189.6 million as of 2022.
5. What are some drivers contributing to market growth?
; Growing Demand From Medical & Healthcare Sector; Other Drivers.
6. What are the notable trends driving market growth?
Increasing Demand from Medical and Healthcare Sector.
7. Are there any restraints impacting market growth?
; Fluctuations In the Prices of Gold; Other Restraints.
8. Can you provide examples of recent developments in the market?
N/A
9. What pricing options are available for accessing the report?
Pricing options include single-user, multi-user, and enterprise licenses priced at USD 4750, USD 5250, and USD 8750 respectively.
10. Is the market size provided in terms of value or volume?
The market size is provided in terms of value, measured in million and volume, measured in K Tons.
11. Are there any specific market keywords associated with the report?
Yes, the market keyword associated with the report is "Gold Nanorods Market," which aids in identifying and referencing the specific market segment covered.
12. How do I determine which pricing option suits my needs best?
The pricing options vary based on user requirements and access needs. Individual users may opt for single-user licenses, while businesses requiring broader access may choose multi-user or enterprise licenses for cost-effective access to the report.
13. Are there any additional resources or data provided in the Gold Nanorods Market report?
While the report offers comprehensive insights, it's advisable to review the specific contents or supplementary materials provided to ascertain if additional resources or data are available.
14. How can I stay updated on further developments or reports in the Gold Nanorods Market?
To stay informed about further developments, trends, and reports in the Gold Nanorods Market, consider subscribing to industry newsletters, following relevant companies and organizations, or regularly checking reputable industry news sources and publications.
Methodology
Step 1 - Identification of Relevant Samples Size from Population Database


Step 2 - Approaches for Defining Global Market Size (Value, Volume* & Price*)

Note*: In applicable scenarios
Step 3 - Data Sources
Primary Research
- Web Analytics
- Survey Reports
- Research Institute
- Latest Research Reports
- Opinion Leaders
Secondary Research
- Annual Reports
- White Paper
- Latest Press Release
- Industry Association
- Paid Database
- Investor Presentations

Step 4 - Data Triangulation
Involves using different sources of information in order to increase the validity of a study
These sources are likely to be stakeholders in a program - participants, other researchers, program staff, other community members, and so on.
Then we put all data in single framework & apply various statistical tools to find out the dynamic on the market.
During the analysis stage, feedback from the stakeholder groups would be compared to determine areas of agreement as well as areas of divergence