
Key Insights
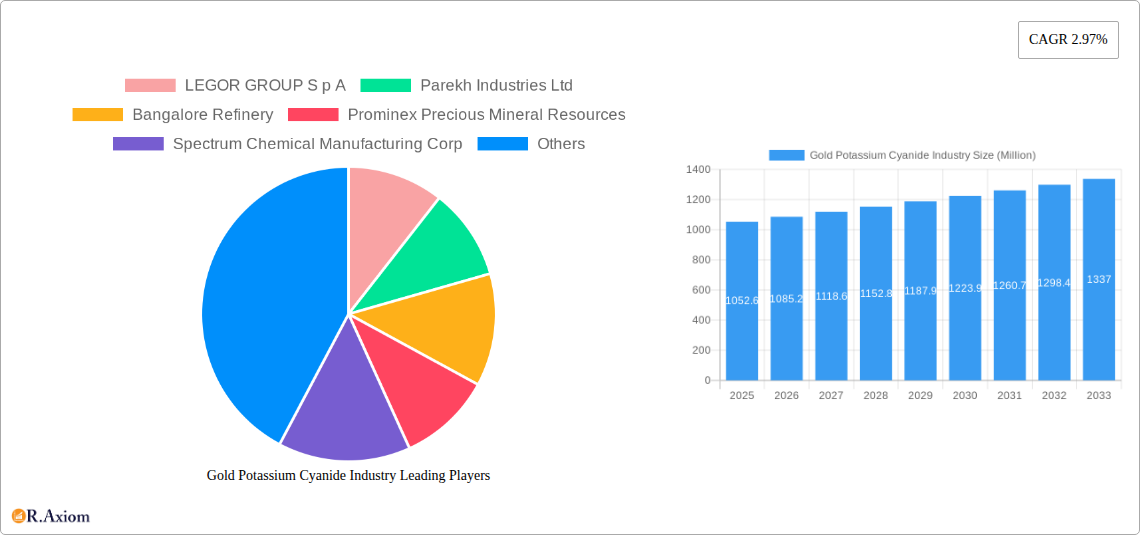
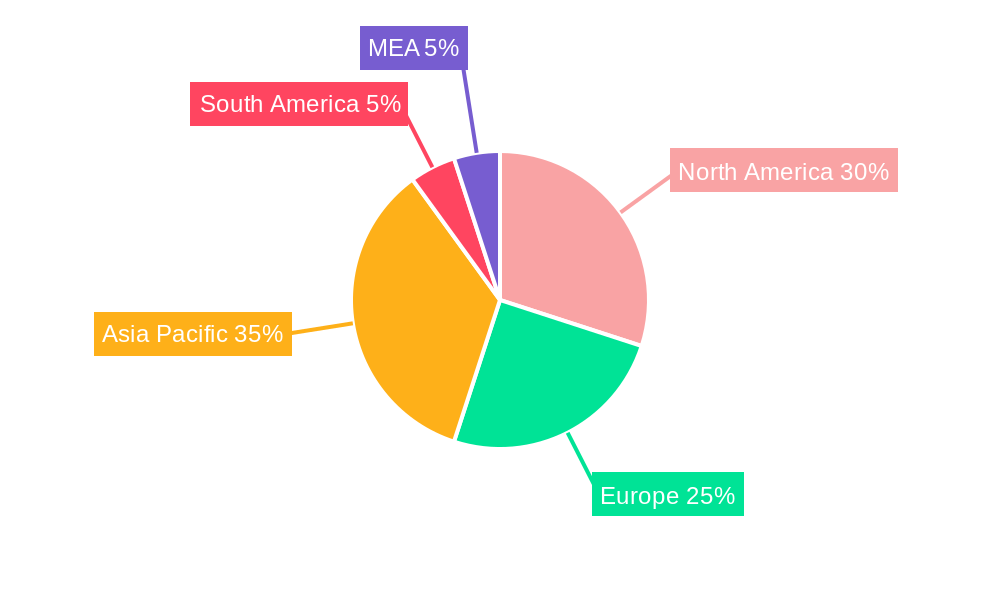
The global gold potassium cyanide market, valued at $1052.6 million in 2025, is projected to experience steady growth, driven primarily by its indispensable role in the electroplating industry, particularly for jewelry and electronic components. The market's expansion is fueled by increasing demand for high-purity gold potassium cyanide in sophisticated applications such as electronics manufacturing, where its superior performance and consistent quality are critical. While the 2.97% CAGR suggests moderate growth, the market is segmented into low and high-purity grades, with the high-purity segment expected to command a larger market share due to its higher value and wider applications. Growth will also be influenced by regional variations; North America and Asia-Pacific, particularly China and India, are expected to be key contributors due to established jewelry manufacturing and electronics production hubs. However, stringent environmental regulations regarding cyanide handling and disposal represent a significant restraint, prompting manufacturers to adopt sustainable practices and explore alternative technologies. This ongoing regulatory pressure necessitates investments in cleaner production methods and waste management solutions, impacting the overall market dynamics. The competitive landscape is characterized by both large multinational corporations and smaller specialized manufacturers, with ongoing innovation and product diversification strategies shaping the competitive dynamics.
The projected market value for 2033 can be estimated based on the 2.97% CAGR. Assuming consistent growth, a compound annual growth rate calculation projects the market size to surpass $1300 million by 2033. However, this is a simplified projection and doesn't factor in potential market disruptions such as economic downturns, significant technological shifts, or unforeseen regulatory changes. The varied applications across segments - including electroplating of metals, decorative costume jewelry, electronic devices, and watches – contribute to the market's resilience and growth potential. Further market penetration in emerging economies will also drive future growth. Companies within this sector are focused on supply chain optimization, technological advancements to improve efficiency and reduce environmental impact, and the exploration of new niche applications.
Gold Potassium Cyanide Industry: A Comprehensive Market Report (2019-2033)
This detailed report provides a comprehensive analysis of the Gold Potassium Cyanide industry, covering market dynamics, key players, and future growth prospects. The study period spans from 2019 to 2033, with 2025 serving as both the base and estimated year. This report is invaluable for industry stakeholders, investors, and researchers seeking actionable insights into this vital sector.
Gold Potassium Cyanide Industry Market Concentration & Innovation
This section analyzes the level of market concentration within the Gold Potassium Cyanide industry, identifying major players and their respective market shares. We explore the innovative drivers shaping the market, including technological advancements and regulatory changes. The analysis also examines the impact of substitute products, evolving end-user trends, and mergers & acquisitions (M&A) activities on market dynamics.
The report includes a detailed examination of M&A activity, including deal values (estimated at xx Million USD in total during the historical period). Key metrics analyzed include market concentration ratios (e.g., CR4, CR8), assessing the dominance of specific players. The regulatory landscape, including potential changes impacting market access and competition, is extensively evaluated. The impact of substitution technologies and materials on market share is also considered, alongside an in-depth analysis of end-user preferences and changing demands.
- Market Concentration: A detailed analysis of market share distribution amongst key players, including LEGOR GROUP S p A, Parekh Industries Ltd, Bangalore Refinery, Prominex Precious Mineral Resources, Spectrum Chemical Manufacturing Corp, Umicore Electroplating, Innova Corporate, Alfa Aesar Thermo Fisher Scientific, Mahavir Expochem Ltd, and METALOR Technologies SA.
- Innovation Drivers: Examination of R&D activities, new product launches, and technological advancements driving market growth.
- Regulatory Framework: Assessment of existing regulations and their influence on industry practices and market access.
- Product Substitutes: Analysis of alternative materials and technologies and their potential to disrupt the market.
- End-User Trends: Evaluation of evolving demands and preferences from different industry segments.
- M&A Activities: Review of significant mergers, acquisitions, and joint ventures, and their impact on market consolidation and competition.
Gold Potassium Cyanide Industry Industry Trends & Insights
This section delves into the key trends and insights shaping the Gold Potassium Cyanide industry. We examine market growth drivers, both historical and projected, focusing on factors influencing market expansion. This involves a detailed analysis of technological advancements impacting production efficiency and product quality, and how consumer preferences are impacting demand for different grades and applications. The report further scrutinizes competitive dynamics, including pricing strategies, product differentiation, and market penetration rates of key players. Specific growth metrics, such as the Compound Annual Growth Rate (CAGR) and market penetration rates for various segments, are provided with a forecast extending to 2033. The impact of macro-economic factors and global supply chain dynamics is also discussed.
The impact of external factors like geopolitical instability, economic fluctuations, and environmental regulations on market growth is also considered. The analysis offers a comprehensive understanding of the complex interplay of factors contributing to the industry’s trajectory.

Dominant Markets & Segments in Gold Potassium Cyanide Industry
This section identifies the dominant markets and segments within the Gold Potassium Cyanide industry, analyzing geographical and application-specific dominance. We highlight the leading regions and countries based on consumption, production, and market size. For each segment – Low Purity, High Purity, Electroplating of Metals, Decorative Costume Jewellery, Electronic Devices, Watches, and Other Applications – key market drivers are identified and discussed. Detailed analysis assesses the factors contributing to the dominance of specific regions and segments.
Dominant Region/Country: [Specific region/country will be identified and analyzed based on data]. Reasons for dominance will be analyzed extensively.
Segment Analysis:
- Type: Detailed comparison of Low Purity and High Purity segments, including market size, growth projections, and competitive dynamics.
- Applications: In-depth analysis of each application segment (Electroplating of Metals, Decorative Costume Jewellery, Electronic Devices, Watches, Other Applications), including market size, growth rates, and key drivers. We explore regional variations in segment dominance, analyzing the specific factors contributing to success in each area.
Key Drivers (Examples):
- Economic Policies: Impact of governmental support for specific industries on market growth (e.g., tax incentives).
- Infrastructure: Influence of infrastructure development (e.g., transportation networks) on market accessibility.
- Technological Advancements: Influence of innovative production techniques on market competitiveness.
- Consumer Preferences: Trends impacting demand patterns in different regions and applications.
Gold Potassium Cyanide Industry Product Developments
This section summarizes recent product innovations and their competitive advantages. We analyze new applications of Gold Potassium Cyanide and highlight the technological trends driving product evolution and improved market fit. The focus is on detailing the competitive landscape, showing how new products are differentiating themselves and gaining market share.
[Detailed paragraph summarizing product innovations, applications, and competitive advantages will be included here. Technological trends and market fit will be emphasized.]
Report Scope & Segmentation Analysis
This section details all market segmentations: Type (Low Purity, High Purity) and Applications (Electroplating of Metals, Decorative Costume Jewellery, Electronic Devices, Watches, Other Applications). Each segment's growth projection, market size (in Millions), and competitive dynamics will be discussed.
Type Segmentation: [Detailed paragraph on Low Purity and High Purity, including market size, growth projections, and competitive dynamics.]
Application Segmentation: [Detailed paragraph on each application, including market size, growth projections, and competitive dynamics.]
Key Drivers of Gold Potassium Cyanide Industry Growth
This section outlines the key growth drivers influencing the Gold Potassium Cyanide industry. Technological advancements, supportive economic policies, and favorable regulatory environments are assessed for their contributions to market expansion. Specific examples of these drivers, with quantitative impacts wherever possible, will be provided.
[Detailed paragraph outlining key growth drivers, with specific examples and quantifiable impacts where available.]
Challenges in the Gold Potassium Cyanide Industry Sector
This section identifies and analyzes the challenges and restraints hindering growth in the Gold Potassium Cyanide industry. Regulatory hurdles, supply chain disruptions, and competitive pressures are discussed, with a focus on their quantifiable impacts on market growth.
[Detailed paragraph or list addressing regulatory hurdles, supply chain issues, and competitive pressures with quantifiable impacts.]
Emerging Opportunities in Gold Potassium Cyanide Industry
This section highlights promising emerging trends and opportunities within the Gold Potassium Cyanide market. The focus is on new market segments, technological advancements, or evolving consumer preferences that present potential for future growth.
[Detailed paragraph or list focusing on new markets, technologies, or consumer preferences.]
Leading Players in the Gold Potassium Cyanide Industry Market
- LEGOR GROUP S p A
- Parekh Industries Ltd
- Bangalore Refinery
- Prominex Precious Mineral Resources
- Spectrum Chemical Manufacturing Corp
- Umicore Electroplating
- Innova Corporate
- Alfa Aesar Thermo Fisher Scientific
- Mahavir Expochem Ltd
- METALOR Technologies SA
Key Developments in Gold Potassium Cyanide Industry Industry
- November 2022: Besra Gold Inc. announced an agreement with Quantum Metals Recovery Inc. for USD 300 Million in financial support through a gold offtake purchase facility, advancing exploration and development.
- March 2022: Spectrum Chemical launched 12 new products under its bioCERTIFIED quality management system, expanding its biopharmaceutical manufacturing portfolio.
Strategic Outlook for Gold Potassium Cyanide Industry Market
This section summarizes the key growth catalysts and future market potential for the Gold Potassium Cyanide industry. It highlights the opportunities for expansion into new markets and applications, emphasizing the long-term outlook and promising avenues for sustainable growth. The discussion includes considerations of technological innovations, shifts in consumer demand, and changing regulatory landscapes.
[Detailed paragraph summarizing growth catalysts and future market potential.]
Gold Potassium Cyanide Industry Segmentation
-
1. Type
- 1.1. Low Purity
- 1.2. High Purity
-
2. Applications
- 2.1. Electroplating of Metals
- 2.2. Decorative Costume Jewellery
- 2.3. Electronic Devices
- 2.4. Watches
- 2.5. Other Applications
Gold Potassium Cyanide Industry Segmentation By Geography
-
1. Asia Pacific
- 1.1. China
- 1.2. India
- 1.3. Japan
- 1.4. South Korea
- 1.5. Rest of Asia Pacific
-
2. North America
- 2.1. United States
- 2.2. Canada
- 2.3. Mexico
-
3. Europe
- 3.1. Germany
- 3.2. United Kingdom
- 3.3. France
- 3.4. Italy
- 3.5. Rest of Europe
-
4. South America
- 4.1. Brazil
- 4.2. Argentina
- 4.3. Rest of South America
-
5. Middle East and Africa
- 5.1. Saudi Arabia
- 5.2. South Africa
- 5.3. Rest of Middle East and Africa
Gold Potassium Cyanide Industry REPORT HIGHLIGHTS
| Aspects | Details |
|---|---|
| Study Period | 2019-2033 |
| Base Year | 2024 |
| Estimated Year | 2025 |
| Forecast Period | 2025-2033 |
| Historical Period | 2019-2024 |
| Growth Rate | CAGR of 2.97% from 2019-2033 |
| Segmentation |
|
Table of Contents
- 1. Introduction
- 1.1. Research Scope
- 1.2. Market Segmentation
- 1.3. Research Methodology
- 1.4. Definitions and Assumptions
- 2. Executive Summary
- 2.1. Introduction
- 3. Market Dynamics
- 3.1. Introduction
- 3.2. Market Drivers
- 3.2.1. Increasing Applications for Electroplating of Gold; Growing Demand from the Electronics Industry
- 3.3. Market Restrains
- 3.3.1. High Toxic Nature and Impact of COVID-19 Pandemic; Other Restraints
- 3.4. Market Trends
- 3.4.1. Growing Demand from Electronics and Metal Plating Industries
- 4. Market Factor Analysis
- 4.1. Porters Five Forces
- 4.2. Supply/Value Chain
- 4.3. PESTEL analysis
- 4.4. Market Entropy
- 4.5. Patent/Trademark Analysis
- 5. Global Gold Potassium Cyanide Industry Analysis, Insights and Forecast, 2019-2031
- 5.1. Market Analysis, Insights and Forecast - by Type
- 5.1.1. Low Purity
- 5.1.2. High Purity
- 5.2. Market Analysis, Insights and Forecast - by Applications
- 5.2.1. Electroplating of Metals
- 5.2.2. Decorative Costume Jewellery
- 5.2.3. Electronic Devices
- 5.2.4. Watches
- 5.2.5. Other Applications
- 5.3. Market Analysis, Insights and Forecast - by Region
- 5.3.1. Asia Pacific
- 5.3.2. North America
- 5.3.3. Europe
- 5.3.4. South America
- 5.3.5. Middle East and Africa
- 5.1. Market Analysis, Insights and Forecast - by Type
- 6. Asia Pacific Gold Potassium Cyanide Industry Analysis, Insights and Forecast, 2019-2031
- 6.1. Market Analysis, Insights and Forecast - by Type
- 6.1.1. Low Purity
- 6.1.2. High Purity
- 6.2. Market Analysis, Insights and Forecast - by Applications
- 6.2.1. Electroplating of Metals
- 6.2.2. Decorative Costume Jewellery
- 6.2.3. Electronic Devices
- 6.2.4. Watches
- 6.2.5. Other Applications
- 6.1. Market Analysis, Insights and Forecast - by Type
- 7. North America Gold Potassium Cyanide Industry Analysis, Insights and Forecast, 2019-2031
- 7.1. Market Analysis, Insights and Forecast - by Type
- 7.1.1. Low Purity
- 7.1.2. High Purity
- 7.2. Market Analysis, Insights and Forecast - by Applications
- 7.2.1. Electroplating of Metals
- 7.2.2. Decorative Costume Jewellery
- 7.2.3. Electronic Devices
- 7.2.4. Watches
- 7.2.5. Other Applications
- 7.1. Market Analysis, Insights and Forecast - by Type
- 8. Europe Gold Potassium Cyanide Industry Analysis, Insights and Forecast, 2019-2031
- 8.1. Market Analysis, Insights and Forecast - by Type
- 8.1.1. Low Purity
- 8.1.2. High Purity
- 8.2. Market Analysis, Insights and Forecast - by Applications
- 8.2.1. Electroplating of Metals
- 8.2.2. Decorative Costume Jewellery
- 8.2.3. Electronic Devices
- 8.2.4. Watches
- 8.2.5. Other Applications
- 8.1. Market Analysis, Insights and Forecast - by Type
- 9. South America Gold Potassium Cyanide Industry Analysis, Insights and Forecast, 2019-2031
- 9.1. Market Analysis, Insights and Forecast - by Type
- 9.1.1. Low Purity
- 9.1.2. High Purity
- 9.2. Market Analysis, Insights and Forecast - by Applications
- 9.2.1. Electroplating of Metals
- 9.2.2. Decorative Costume Jewellery
- 9.2.3. Electronic Devices
- 9.2.4. Watches
- 9.2.5. Other Applications
- 9.1. Market Analysis, Insights and Forecast - by Type
- 10. Middle East and Africa Gold Potassium Cyanide Industry Analysis, Insights and Forecast, 2019-2031
- 10.1. Market Analysis, Insights and Forecast - by Type
- 10.1.1. Low Purity
- 10.1.2. High Purity
- 10.2. Market Analysis, Insights and Forecast - by Applications
- 10.2.1. Electroplating of Metals
- 10.2.2. Decorative Costume Jewellery
- 10.2.3. Electronic Devices
- 10.2.4. Watches
- 10.2.5. Other Applications
- 10.1. Market Analysis, Insights and Forecast - by Type
- 11. North America Gold Potassium Cyanide Industry Analysis, Insights and Forecast, 2019-2031
- 11.1. Market Analysis, Insights and Forecast - By Country/Sub-region
- 11.1.1 United States
- 11.1.2 Canada
- 11.1.3 Mexico
- 12. Europe Gold Potassium Cyanide Industry Analysis, Insights and Forecast, 2019-2031
- 12.1. Market Analysis, Insights and Forecast - By Country/Sub-region
- 12.1.1 Germany
- 12.1.2 France
- 12.1.3 Italy
- 12.1.4 United Kingdom
- 12.1.5 Netherlands
- 12.1.6 Rest of Europe
- 13. Asia Pacific Gold Potassium Cyanide Industry Analysis, Insights and Forecast, 2019-2031
- 13.1. Market Analysis, Insights and Forecast - By Country/Sub-region
- 13.1.1 China
- 13.1.2 Japan
- 13.1.3 India
- 13.1.4 South Korea
- 13.1.5 Taiwan
- 13.1.6 Australia
- 13.1.7 Rest of Asia-Pacific
- 14. South America Gold Potassium Cyanide Industry Analysis, Insights and Forecast, 2019-2031
- 14.1. Market Analysis, Insights and Forecast - By Country/Sub-region
- 14.1.1 Brazil
- 14.1.2 Argentina
- 14.1.3 Rest of South America
- 15. MEA Gold Potassium Cyanide Industry Analysis, Insights and Forecast, 2019-2031
- 15.1. Market Analysis, Insights and Forecast - By Country/Sub-region
- 15.1.1 Middle East
- 15.1.2 Africa
- 16. Competitive Analysis
- 16.1. Global Market Share Analysis 2024
- 16.2. Company Profiles
- 16.2.1 LEGOR GROUP S p A
- 16.2.1.1. Overview
- 16.2.1.2. Products
- 16.2.1.3. SWOT Analysis
- 16.2.1.4. Recent Developments
- 16.2.1.5. Financials (Based on Availability)
- 16.2.2 Parekh Industries Ltd
- 16.2.2.1. Overview
- 16.2.2.2. Products
- 16.2.2.3. SWOT Analysis
- 16.2.2.4. Recent Developments
- 16.2.2.5. Financials (Based on Availability)
- 16.2.3 Bangalore Refinery
- 16.2.3.1. Overview
- 16.2.3.2. Products
- 16.2.3.3. SWOT Analysis
- 16.2.3.4. Recent Developments
- 16.2.3.5. Financials (Based on Availability)
- 16.2.4 Prominex Precious Mineral Resources
- 16.2.4.1. Overview
- 16.2.4.2. Products
- 16.2.4.3. SWOT Analysis
- 16.2.4.4. Recent Developments
- 16.2.4.5. Financials (Based on Availability)
- 16.2.5 Spectrum Chemical Manufacturing Corp
- 16.2.5.1. Overview
- 16.2.5.2. Products
- 16.2.5.3. SWOT Analysis
- 16.2.5.4. Recent Developments
- 16.2.5.5. Financials (Based on Availability)
- 16.2.6 Umicore Electroplating
- 16.2.6.1. Overview
- 16.2.6.2. Products
- 16.2.6.3. SWOT Analysis
- 16.2.6.4. Recent Developments
- 16.2.6.5. Financials (Based on Availability)
- 16.2.7 Innova Corporate
- 16.2.7.1. Overview
- 16.2.7.2. Products
- 16.2.7.3. SWOT Analysis
- 16.2.7.4. Recent Developments
- 16.2.7.5. Financials (Based on Availability)
- 16.2.8 Alfa Aesar Thermo Fisher Scientific
- 16.2.8.1. Overview
- 16.2.8.2. Products
- 16.2.8.3. SWOT Analysis
- 16.2.8.4. Recent Developments
- 16.2.8.5. Financials (Based on Availability)
- 16.2.9 Mahavir Expochem Ltd
- 16.2.9.1. Overview
- 16.2.9.2. Products
- 16.2.9.3. SWOT Analysis
- 16.2.9.4. Recent Developments
- 16.2.9.5. Financials (Based on Availability)
- 16.2.10 METALOR Technologies SA
- 16.2.10.1. Overview
- 16.2.10.2. Products
- 16.2.10.3. SWOT Analysis
- 16.2.10.4. Recent Developments
- 16.2.10.5. Financials (Based on Availability)
- 16.2.1 LEGOR GROUP S p A
List of Figures
- Figure 1: Global Gold Potassium Cyanide Industry Revenue Breakdown (Million, %) by Region 2024 & 2032
- Figure 2: Global Gold Potassium Cyanide Industry Volume Breakdown (K Tons, %) by Region 2024 & 2032
- Figure 3: North America Gold Potassium Cyanide Industry Revenue (Million), by Country 2024 & 2032
- Figure 4: North America Gold Potassium Cyanide Industry Volume (K Tons), by Country 2024 & 2032
- Figure 5: North America Gold Potassium Cyanide Industry Revenue Share (%), by Country 2024 & 2032
- Figure 6: North America Gold Potassium Cyanide Industry Volume Share (%), by Country 2024 & 2032
- Figure 7: Europe Gold Potassium Cyanide Industry Revenue (Million), by Country 2024 & 2032
- Figure 8: Europe Gold Potassium Cyanide Industry Volume (K Tons), by Country 2024 & 2032
- Figure 9: Europe Gold Potassium Cyanide Industry Revenue Share (%), by Country 2024 & 2032
- Figure 10: Europe Gold Potassium Cyanide Industry Volume Share (%), by Country 2024 & 2032
- Figure 11: Asia Pacific Gold Potassium Cyanide Industry Revenue (Million), by Country 2024 & 2032
- Figure 12: Asia Pacific Gold Potassium Cyanide Industry Volume (K Tons), by Country 2024 & 2032
- Figure 13: Asia Pacific Gold Potassium Cyanide Industry Revenue Share (%), by Country 2024 & 2032
- Figure 14: Asia Pacific Gold Potassium Cyanide Industry Volume Share (%), by Country 2024 & 2032
- Figure 15: South America Gold Potassium Cyanide Industry Revenue (Million), by Country 2024 & 2032
- Figure 16: South America Gold Potassium Cyanide Industry Volume (K Tons), by Country 2024 & 2032
- Figure 17: South America Gold Potassium Cyanide Industry Revenue Share (%), by Country 2024 & 2032
- Figure 18: South America Gold Potassium Cyanide Industry Volume Share (%), by Country 2024 & 2032
- Figure 19: MEA Gold Potassium Cyanide Industry Revenue (Million), by Country 2024 & 2032
- Figure 20: MEA Gold Potassium Cyanide Industry Volume (K Tons), by Country 2024 & 2032
- Figure 21: MEA Gold Potassium Cyanide Industry Revenue Share (%), by Country 2024 & 2032
- Figure 22: MEA Gold Potassium Cyanide Industry Volume Share (%), by Country 2024 & 2032
- Figure 23: Asia Pacific Gold Potassium Cyanide Industry Revenue (Million), by Type 2024 & 2032
- Figure 24: Asia Pacific Gold Potassium Cyanide Industry Volume (K Tons), by Type 2024 & 2032
- Figure 25: Asia Pacific Gold Potassium Cyanide Industry Revenue Share (%), by Type 2024 & 2032
- Figure 26: Asia Pacific Gold Potassium Cyanide Industry Volume Share (%), by Type 2024 & 2032
- Figure 27: Asia Pacific Gold Potassium Cyanide Industry Revenue (Million), by Applications 2024 & 2032
- Figure 28: Asia Pacific Gold Potassium Cyanide Industry Volume (K Tons), by Applications 2024 & 2032
- Figure 29: Asia Pacific Gold Potassium Cyanide Industry Revenue Share (%), by Applications 2024 & 2032
- Figure 30: Asia Pacific Gold Potassium Cyanide Industry Volume Share (%), by Applications 2024 & 2032
- Figure 31: Asia Pacific Gold Potassium Cyanide Industry Revenue (Million), by Country 2024 & 2032
- Figure 32: Asia Pacific Gold Potassium Cyanide Industry Volume (K Tons), by Country 2024 & 2032
- Figure 33: Asia Pacific Gold Potassium Cyanide Industry Revenue Share (%), by Country 2024 & 2032
- Figure 34: Asia Pacific Gold Potassium Cyanide Industry Volume Share (%), by Country 2024 & 2032
- Figure 35: North America Gold Potassium Cyanide Industry Revenue (Million), by Type 2024 & 2032
- Figure 36: North America Gold Potassium Cyanide Industry Volume (K Tons), by Type 2024 & 2032
- Figure 37: North America Gold Potassium Cyanide Industry Revenue Share (%), by Type 2024 & 2032
- Figure 38: North America Gold Potassium Cyanide Industry Volume Share (%), by Type 2024 & 2032
- Figure 39: North America Gold Potassium Cyanide Industry Revenue (Million), by Applications 2024 & 2032
- Figure 40: North America Gold Potassium Cyanide Industry Volume (K Tons), by Applications 2024 & 2032
- Figure 41: North America Gold Potassium Cyanide Industry Revenue Share (%), by Applications 2024 & 2032
- Figure 42: North America Gold Potassium Cyanide Industry Volume Share (%), by Applications 2024 & 2032
- Figure 43: North America Gold Potassium Cyanide Industry Revenue (Million), by Country 2024 & 2032
- Figure 44: North America Gold Potassium Cyanide Industry Volume (K Tons), by Country 2024 & 2032
- Figure 45: North America Gold Potassium Cyanide Industry Revenue Share (%), by Country 2024 & 2032
- Figure 46: North America Gold Potassium Cyanide Industry Volume Share (%), by Country 2024 & 2032
- Figure 47: Europe Gold Potassium Cyanide Industry Revenue (Million), by Type 2024 & 2032
- Figure 48: Europe Gold Potassium Cyanide Industry Volume (K Tons), by Type 2024 & 2032
- Figure 49: Europe Gold Potassium Cyanide Industry Revenue Share (%), by Type 2024 & 2032
- Figure 50: Europe Gold Potassium Cyanide Industry Volume Share (%), by Type 2024 & 2032
- Figure 51: Europe Gold Potassium Cyanide Industry Revenue (Million), by Applications 2024 & 2032
- Figure 52: Europe Gold Potassium Cyanide Industry Volume (K Tons), by Applications 2024 & 2032
- Figure 53: Europe Gold Potassium Cyanide Industry Revenue Share (%), by Applications 2024 & 2032
- Figure 54: Europe Gold Potassium Cyanide Industry Volume Share (%), by Applications 2024 & 2032
- Figure 55: Europe Gold Potassium Cyanide Industry Revenue (Million), by Country 2024 & 2032
- Figure 56: Europe Gold Potassium Cyanide Industry Volume (K Tons), by Country 2024 & 2032
- Figure 57: Europe Gold Potassium Cyanide Industry Revenue Share (%), by Country 2024 & 2032
- Figure 58: Europe Gold Potassium Cyanide Industry Volume Share (%), by Country 2024 & 2032
- Figure 59: South America Gold Potassium Cyanide Industry Revenue (Million), by Type 2024 & 2032
- Figure 60: South America Gold Potassium Cyanide Industry Volume (K Tons), by Type 2024 & 2032
- Figure 61: South America Gold Potassium Cyanide Industry Revenue Share (%), by Type 2024 & 2032
- Figure 62: South America Gold Potassium Cyanide Industry Volume Share (%), by Type 2024 & 2032
- Figure 63: South America Gold Potassium Cyanide Industry Revenue (Million), by Applications 2024 & 2032
- Figure 64: South America Gold Potassium Cyanide Industry Volume (K Tons), by Applications 2024 & 2032
- Figure 65: South America Gold Potassium Cyanide Industry Revenue Share (%), by Applications 2024 & 2032
- Figure 66: South America Gold Potassium Cyanide Industry Volume Share (%), by Applications 2024 & 2032
- Figure 67: South America Gold Potassium Cyanide Industry Revenue (Million), by Country 2024 & 2032
- Figure 68: South America Gold Potassium Cyanide Industry Volume (K Tons), by Country 2024 & 2032
- Figure 69: South America Gold Potassium Cyanide Industry Revenue Share (%), by Country 2024 & 2032
- Figure 70: South America Gold Potassium Cyanide Industry Volume Share (%), by Country 2024 & 2032
- Figure 71: Middle East and Africa Gold Potassium Cyanide Industry Revenue (Million), by Type 2024 & 2032
- Figure 72: Middle East and Africa Gold Potassium Cyanide Industry Volume (K Tons), by Type 2024 & 2032
- Figure 73: Middle East and Africa Gold Potassium Cyanide Industry Revenue Share (%), by Type 2024 & 2032
- Figure 74: Middle East and Africa Gold Potassium Cyanide Industry Volume Share (%), by Type 2024 & 2032
- Figure 75: Middle East and Africa Gold Potassium Cyanide Industry Revenue (Million), by Applications 2024 & 2032
- Figure 76: Middle East and Africa Gold Potassium Cyanide Industry Volume (K Tons), by Applications 2024 & 2032
- Figure 77: Middle East and Africa Gold Potassium Cyanide Industry Revenue Share (%), by Applications 2024 & 2032
- Figure 78: Middle East and Africa Gold Potassium Cyanide Industry Volume Share (%), by Applications 2024 & 2032
- Figure 79: Middle East and Africa Gold Potassium Cyanide Industry Revenue (Million), by Country 2024 & 2032
- Figure 80: Middle East and Africa Gold Potassium Cyanide Industry Volume (K Tons), by Country 2024 & 2032
- Figure 81: Middle East and Africa Gold Potassium Cyanide Industry Revenue Share (%), by Country 2024 & 2032
- Figure 82: Middle East and Africa Gold Potassium Cyanide Industry Volume Share (%), by Country 2024 & 2032
List of Tables
- Table 1: Global Gold Potassium Cyanide Industry Revenue Million Forecast, by Region 2019 & 2032
- Table 2: Global Gold Potassium Cyanide Industry Volume K Tons Forecast, by Region 2019 & 2032
- Table 3: Global Gold Potassium Cyanide Industry Revenue Million Forecast, by Type 2019 & 2032
- Table 4: Global Gold Potassium Cyanide Industry Volume K Tons Forecast, by Type 2019 & 2032
- Table 5: Global Gold Potassium Cyanide Industry Revenue Million Forecast, by Applications 2019 & 2032
- Table 6: Global Gold Potassium Cyanide Industry Volume K Tons Forecast, by Applications 2019 & 2032
- Table 7: Global Gold Potassium Cyanide Industry Revenue Million Forecast, by Region 2019 & 2032
- Table 8: Global Gold Potassium Cyanide Industry Volume K Tons Forecast, by Region 2019 & 2032
- Table 9: Global Gold Potassium Cyanide Industry Revenue Million Forecast, by Country 2019 & 2032
- Table 10: Global Gold Potassium Cyanide Industry Volume K Tons Forecast, by Country 2019 & 2032
- Table 11: United States Gold Potassium Cyanide Industry Revenue (Million) Forecast, by Application 2019 & 2032
- Table 12: United States Gold Potassium Cyanide Industry Volume (K Tons) Forecast, by Application 2019 & 2032
- Table 13: Canada Gold Potassium Cyanide Industry Revenue (Million) Forecast, by Application 2019 & 2032
- Table 14: Canada Gold Potassium Cyanide Industry Volume (K Tons) Forecast, by Application 2019 & 2032
- Table 15: Mexico Gold Potassium Cyanide Industry Revenue (Million) Forecast, by Application 2019 & 2032
- Table 16: Mexico Gold Potassium Cyanide Industry Volume (K Tons) Forecast, by Application 2019 & 2032
- Table 17: Global Gold Potassium Cyanide Industry Revenue Million Forecast, by Country 2019 & 2032
- Table 18: Global Gold Potassium Cyanide Industry Volume K Tons Forecast, by Country 2019 & 2032
- Table 19: Germany Gold Potassium Cyanide Industry Revenue (Million) Forecast, by Application 2019 & 2032
- Table 20: Germany Gold Potassium Cyanide Industry Volume (K Tons) Forecast, by Application 2019 & 2032
- Table 21: France Gold Potassium Cyanide Industry Revenue (Million) Forecast, by Application 2019 & 2032
- Table 22: France Gold Potassium Cyanide Industry Volume (K Tons) Forecast, by Application 2019 & 2032
- Table 23: Italy Gold Potassium Cyanide Industry Revenue (Million) Forecast, by Application 2019 & 2032
- Table 24: Italy Gold Potassium Cyanide Industry Volume (K Tons) Forecast, by Application 2019 & 2032
- Table 25: United Kingdom Gold Potassium Cyanide Industry Revenue (Million) Forecast, by Application 2019 & 2032
- Table 26: United Kingdom Gold Potassium Cyanide Industry Volume (K Tons) Forecast, by Application 2019 & 2032
- Table 27: Netherlands Gold Potassium Cyanide Industry Revenue (Million) Forecast, by Application 2019 & 2032
- Table 28: Netherlands Gold Potassium Cyanide Industry Volume (K Tons) Forecast, by Application 2019 & 2032
- Table 29: Rest of Europe Gold Potassium Cyanide Industry Revenue (Million) Forecast, by Application 2019 & 2032
- Table 30: Rest of Europe Gold Potassium Cyanide Industry Volume (K Tons) Forecast, by Application 2019 & 2032
- Table 31: Global Gold Potassium Cyanide Industry Revenue Million Forecast, by Country 2019 & 2032
- Table 32: Global Gold Potassium Cyanide Industry Volume K Tons Forecast, by Country 2019 & 2032
- Table 33: China Gold Potassium Cyanide Industry Revenue (Million) Forecast, by Application 2019 & 2032
- Table 34: China Gold Potassium Cyanide Industry Volume (K Tons) Forecast, by Application 2019 & 2032
- Table 35: Japan Gold Potassium Cyanide Industry Revenue (Million) Forecast, by Application 2019 & 2032
- Table 36: Japan Gold Potassium Cyanide Industry Volume (K Tons) Forecast, by Application 2019 & 2032
- Table 37: India Gold Potassium Cyanide Industry Revenue (Million) Forecast, by Application 2019 & 2032
- Table 38: India Gold Potassium Cyanide Industry Volume (K Tons) Forecast, by Application 2019 & 2032
- Table 39: South Korea Gold Potassium Cyanide Industry Revenue (Million) Forecast, by Application 2019 & 2032
- Table 40: South Korea Gold Potassium Cyanide Industry Volume (K Tons) Forecast, by Application 2019 & 2032
- Table 41: Taiwan Gold Potassium Cyanide Industry Revenue (Million) Forecast, by Application 2019 & 2032
- Table 42: Taiwan Gold Potassium Cyanide Industry Volume (K Tons) Forecast, by Application 2019 & 2032
- Table 43: Australia Gold Potassium Cyanide Industry Revenue (Million) Forecast, by Application 2019 & 2032
- Table 44: Australia Gold Potassium Cyanide Industry Volume (K Tons) Forecast, by Application 2019 & 2032
- Table 45: Rest of Asia-Pacific Gold Potassium Cyanide Industry Revenue (Million) Forecast, by Application 2019 & 2032
- Table 46: Rest of Asia-Pacific Gold Potassium Cyanide Industry Volume (K Tons) Forecast, by Application 2019 & 2032
- Table 47: Global Gold Potassium Cyanide Industry Revenue Million Forecast, by Country 2019 & 2032
- Table 48: Global Gold Potassium Cyanide Industry Volume K Tons Forecast, by Country 2019 & 2032
- Table 49: Brazil Gold Potassium Cyanide Industry Revenue (Million) Forecast, by Application 2019 & 2032
- Table 50: Brazil Gold Potassium Cyanide Industry Volume (K Tons) Forecast, by Application 2019 & 2032
- Table 51: Argentina Gold Potassium Cyanide Industry Revenue (Million) Forecast, by Application 2019 & 2032
- Table 52: Argentina Gold Potassium Cyanide Industry Volume (K Tons) Forecast, by Application 2019 & 2032
- Table 53: Rest of South America Gold Potassium Cyanide Industry Revenue (Million) Forecast, by Application 2019 & 2032
- Table 54: Rest of South America Gold Potassium Cyanide Industry Volume (K Tons) Forecast, by Application 2019 & 2032
- Table 55: Global Gold Potassium Cyanide Industry Revenue Million Forecast, by Country 2019 & 2032
- Table 56: Global Gold Potassium Cyanide Industry Volume K Tons Forecast, by Country 2019 & 2032
- Table 57: Middle East Gold Potassium Cyanide Industry Revenue (Million) Forecast, by Application 2019 & 2032
- Table 58: Middle East Gold Potassium Cyanide Industry Volume (K Tons) Forecast, by Application 2019 & 2032
- Table 59: Africa Gold Potassium Cyanide Industry Revenue (Million) Forecast, by Application 2019 & 2032
- Table 60: Africa Gold Potassium Cyanide Industry Volume (K Tons) Forecast, by Application 2019 & 2032
- Table 61: Global Gold Potassium Cyanide Industry Revenue Million Forecast, by Type 2019 & 2032
- Table 62: Global Gold Potassium Cyanide Industry Volume K Tons Forecast, by Type 2019 & 2032
- Table 63: Global Gold Potassium Cyanide Industry Revenue Million Forecast, by Applications 2019 & 2032
- Table 64: Global Gold Potassium Cyanide Industry Volume K Tons Forecast, by Applications 2019 & 2032
- Table 65: Global Gold Potassium Cyanide Industry Revenue Million Forecast, by Country 2019 & 2032
- Table 66: Global Gold Potassium Cyanide Industry Volume K Tons Forecast, by Country 2019 & 2032
- Table 67: China Gold Potassium Cyanide Industry Revenue (Million) Forecast, by Application 2019 & 2032
- Table 68: China Gold Potassium Cyanide Industry Volume (K Tons) Forecast, by Application 2019 & 2032
- Table 69: India Gold Potassium Cyanide Industry Revenue (Million) Forecast, by Application 2019 & 2032
- Table 70: India Gold Potassium Cyanide Industry Volume (K Tons) Forecast, by Application 2019 & 2032
- Table 71: Japan Gold Potassium Cyanide Industry Revenue (Million) Forecast, by Application 2019 & 2032
- Table 72: Japan Gold Potassium Cyanide Industry Volume (K Tons) Forecast, by Application 2019 & 2032
- Table 73: South Korea Gold Potassium Cyanide Industry Revenue (Million) Forecast, by Application 2019 & 2032
- Table 74: South Korea Gold Potassium Cyanide Industry Volume (K Tons) Forecast, by Application 2019 & 2032
- Table 75: Rest of Asia Pacific Gold Potassium Cyanide Industry Revenue (Million) Forecast, by Application 2019 & 2032
- Table 76: Rest of Asia Pacific Gold Potassium Cyanide Industry Volume (K Tons) Forecast, by Application 2019 & 2032
- Table 77: Global Gold Potassium Cyanide Industry Revenue Million Forecast, by Type 2019 & 2032
- Table 78: Global Gold Potassium Cyanide Industry Volume K Tons Forecast, by Type 2019 & 2032
- Table 79: Global Gold Potassium Cyanide Industry Revenue Million Forecast, by Applications 2019 & 2032
- Table 80: Global Gold Potassium Cyanide Industry Volume K Tons Forecast, by Applications 2019 & 2032
- Table 81: Global Gold Potassium Cyanide Industry Revenue Million Forecast, by Country 2019 & 2032
- Table 82: Global Gold Potassium Cyanide Industry Volume K Tons Forecast, by Country 2019 & 2032
- Table 83: United States Gold Potassium Cyanide Industry Revenue (Million) Forecast, by Application 2019 & 2032
- Table 84: United States Gold Potassium Cyanide Industry Volume (K Tons) Forecast, by Application 2019 & 2032
- Table 85: Canada Gold Potassium Cyanide Industry Revenue (Million) Forecast, by Application 2019 & 2032
- Table 86: Canada Gold Potassium Cyanide Industry Volume (K Tons) Forecast, by Application 2019 & 2032
- Table 87: Mexico Gold Potassium Cyanide Industry Revenue (Million) Forecast, by Application 2019 & 2032
- Table 88: Mexico Gold Potassium Cyanide Industry Volume (K Tons) Forecast, by Application 2019 & 2032
- Table 89: Global Gold Potassium Cyanide Industry Revenue Million Forecast, by Type 2019 & 2032
- Table 90: Global Gold Potassium Cyanide Industry Volume K Tons Forecast, by Type 2019 & 2032
- Table 91: Global Gold Potassium Cyanide Industry Revenue Million Forecast, by Applications 2019 & 2032
- Table 92: Global Gold Potassium Cyanide Industry Volume K Tons Forecast, by Applications 2019 & 2032
- Table 93: Global Gold Potassium Cyanide Industry Revenue Million Forecast, by Country 2019 & 2032
- Table 94: Global Gold Potassium Cyanide Industry Volume K Tons Forecast, by Country 2019 & 2032
- Table 95: Germany Gold Potassium Cyanide Industry Revenue (Million) Forecast, by Application 2019 & 2032
- Table 96: Germany Gold Potassium Cyanide Industry Volume (K Tons) Forecast, by Application 2019 & 2032
- Table 97: United Kingdom Gold Potassium Cyanide Industry Revenue (Million) Forecast, by Application 2019 & 2032
- Table 98: United Kingdom Gold Potassium Cyanide Industry Volume (K Tons) Forecast, by Application 2019 & 2032
- Table 99: France Gold Potassium Cyanide Industry Revenue (Million) Forecast, by Application 2019 & 2032
- Table 100: France Gold Potassium Cyanide Industry Volume (K Tons) Forecast, by Application 2019 & 2032
- Table 101: Italy Gold Potassium Cyanide Industry Revenue (Million) Forecast, by Application 2019 & 2032
- Table 102: Italy Gold Potassium Cyanide Industry Volume (K Tons) Forecast, by Application 2019 & 2032
- Table 103: Rest of Europe Gold Potassium Cyanide Industry Revenue (Million) Forecast, by Application 2019 & 2032
- Table 104: Rest of Europe Gold Potassium Cyanide Industry Volume (K Tons) Forecast, by Application 2019 & 2032
- Table 105: Global Gold Potassium Cyanide Industry Revenue Million Forecast, by Type 2019 & 2032
- Table 106: Global Gold Potassium Cyanide Industry Volume K Tons Forecast, by Type 2019 & 2032
- Table 107: Global Gold Potassium Cyanide Industry Revenue Million Forecast, by Applications 2019 & 2032
- Table 108: Global Gold Potassium Cyanide Industry Volume K Tons Forecast, by Applications 2019 & 2032
- Table 109: Global Gold Potassium Cyanide Industry Revenue Million Forecast, by Country 2019 & 2032
- Table 110: Global Gold Potassium Cyanide Industry Volume K Tons Forecast, by Country 2019 & 2032
- Table 111: Brazil Gold Potassium Cyanide Industry Revenue (Million) Forecast, by Application 2019 & 2032
- Table 112: Brazil Gold Potassium Cyanide Industry Volume (K Tons) Forecast, by Application 2019 & 2032
- Table 113: Argentina Gold Potassium Cyanide Industry Revenue (Million) Forecast, by Application 2019 & 2032
- Table 114: Argentina Gold Potassium Cyanide Industry Volume (K Tons) Forecast, by Application 2019 & 2032
- Table 115: Rest of South America Gold Potassium Cyanide Industry Revenue (Million) Forecast, by Application 2019 & 2032
- Table 116: Rest of South America Gold Potassium Cyanide Industry Volume (K Tons) Forecast, by Application 2019 & 2032
- Table 117: Global Gold Potassium Cyanide Industry Revenue Million Forecast, by Type 2019 & 2032
- Table 118: Global Gold Potassium Cyanide Industry Volume K Tons Forecast, by Type 2019 & 2032
- Table 119: Global Gold Potassium Cyanide Industry Revenue Million Forecast, by Applications 2019 & 2032
- Table 120: Global Gold Potassium Cyanide Industry Volume K Tons Forecast, by Applications 2019 & 2032
- Table 121: Global Gold Potassium Cyanide Industry Revenue Million Forecast, by Country 2019 & 2032
- Table 122: Global Gold Potassium Cyanide Industry Volume K Tons Forecast, by Country 2019 & 2032
- Table 123: Saudi Arabia Gold Potassium Cyanide Industry Revenue (Million) Forecast, by Application 2019 & 2032
- Table 124: Saudi Arabia Gold Potassium Cyanide Industry Volume (K Tons) Forecast, by Application 2019 & 2032
- Table 125: South Africa Gold Potassium Cyanide Industry Revenue (Million) Forecast, by Application 2019 & 2032
- Table 126: South Africa Gold Potassium Cyanide Industry Volume (K Tons) Forecast, by Application 2019 & 2032
- Table 127: Rest of Middle East and Africa Gold Potassium Cyanide Industry Revenue (Million) Forecast, by Application 2019 & 2032
- Table 128: Rest of Middle East and Africa Gold Potassium Cyanide Industry Volume (K Tons) Forecast, by Application 2019 & 2032
Frequently Asked Questions
1. What is the projected Compound Annual Growth Rate (CAGR) of the Gold Potassium Cyanide Industry?
The projected CAGR is approximately 2.97%.
2. Which companies are prominent players in the Gold Potassium Cyanide Industry?
Key companies in the market include LEGOR GROUP S p A, Parekh Industries Ltd, Bangalore Refinery, Prominex Precious Mineral Resources, Spectrum Chemical Manufacturing Corp, Umicore Electroplating, Innova Corporate, Alfa Aesar Thermo Fisher Scientific, Mahavir Expochem Ltd, METALOR Technologies SA.
3. What are the main segments of the Gold Potassium Cyanide Industry?
The market segments include Type, Applications.
4. Can you provide details about the market size?
The market size is estimated to be USD 1052.6 Million as of 2022.
5. What are some drivers contributing to market growth?
Increasing Applications for Electroplating of Gold; Growing Demand from the Electronics Industry.
6. What are the notable trends driving market growth?
Growing Demand from Electronics and Metal Plating Industries.
7. Are there any restraints impacting market growth?
High Toxic Nature and Impact of COVID-19 Pandemic; Other Restraints.
8. Can you provide examples of recent developments in the market?
November 2022: Besra Gold Inc announced its agreement with Quantum Metals Recovery Inc which will come into effect from January 2023. As per the agreement, Quantum Metals Recovery Inc will provide an amount of USD 300 million in financial support through the gold offtake purchase facility. The agreement consent between both companies would enable advancement in exploration and development planning for gold.
9. What pricing options are available for accessing the report?
Pricing options include single-user, multi-user, and enterprise licenses priced at USD 4750, USD 5250, and USD 8750 respectively.
10. Is the market size provided in terms of value or volume?
The market size is provided in terms of value, measured in Million and volume, measured in K Tons.
11. Are there any specific market keywords associated with the report?
Yes, the market keyword associated with the report is "Gold Potassium Cyanide Industry," which aids in identifying and referencing the specific market segment covered.
12. How do I determine which pricing option suits my needs best?
The pricing options vary based on user requirements and access needs. Individual users may opt for single-user licenses, while businesses requiring broader access may choose multi-user or enterprise licenses for cost-effective access to the report.
13. Are there any additional resources or data provided in the Gold Potassium Cyanide Industry report?
While the report offers comprehensive insights, it's advisable to review the specific contents or supplementary materials provided to ascertain if additional resources or data are available.
14. How can I stay updated on further developments or reports in the Gold Potassium Cyanide Industry?
To stay informed about further developments, trends, and reports in the Gold Potassium Cyanide Industry, consider subscribing to industry newsletters, following relevant companies and organizations, or regularly checking reputable industry news sources and publications.
Methodology
Step 1 - Identification of Relevant Samples Size from Population Database


Step 2 - Approaches for Defining Global Market Size (Value, Volume* & Price*)

Note*: In applicable scenarios
Step 3 - Data Sources
Primary Research
- Web Analytics
- Survey Reports
- Research Institute
- Latest Research Reports
- Opinion Leaders
Secondary Research
- Annual Reports
- White Paper
- Latest Press Release
- Industry Association
- Paid Database
- Investor Presentations

Step 4 - Data Triangulation
Involves using different sources of information in order to increase the validity of a study
These sources are likely to be stakeholders in a program - participants, other researchers, program staff, other community members, and so on.
Then we put all data in single framework & apply various statistical tools to find out the dynamic on the market.
During the analysis stage, feedback from the stakeholder groups would be compared to determine areas of agreement as well as areas of divergence


