

Key Insights
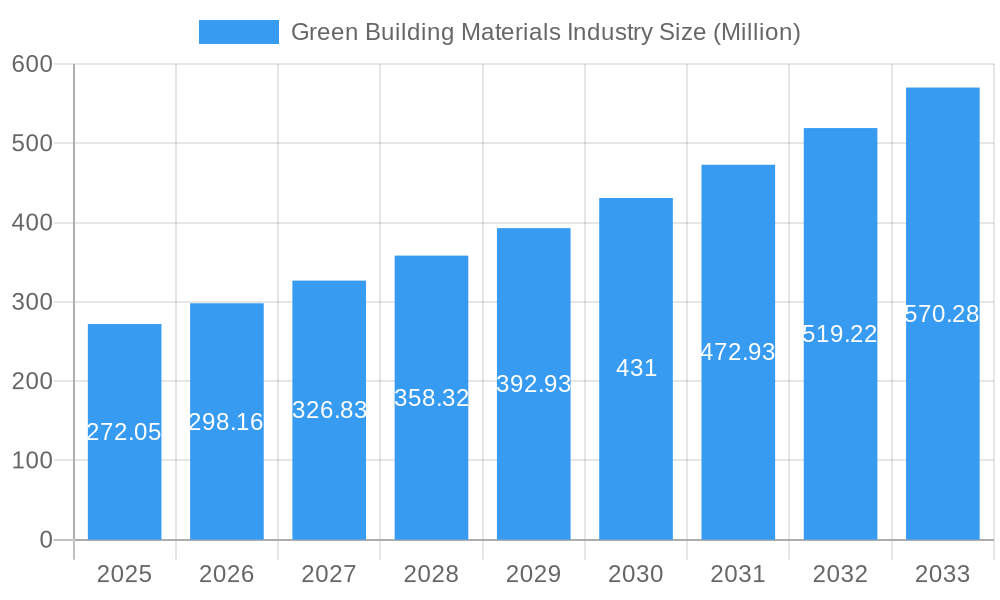
The global green building materials market is experiencing robust growth, projected to reach \$272.05 million in 2025 and exhibiting a Compound Annual Growth Rate (CAGR) of 9.73% from 2025 to 2033. This expansion is driven by several key factors. Increasing environmental awareness and stringent government regulations aimed at reducing carbon emissions are compelling building developers and owners to adopt sustainable practices. Furthermore, the rising demand for energy-efficient buildings, coupled with increasing consumer preference for eco-friendly products, is significantly boosting market demand. Technological advancements leading to the development of innovative, high-performance green building materials further fuel this growth. Key applications such as framing, insulation, roofing, and exterior siding are experiencing particularly high growth, fueled by new construction and renovation projects in the residential, commercial, and industrial sectors. The Asia-Pacific region, particularly China and India, are expected to be major contributors to market growth due to rapid urbanization and infrastructure development. While challenges such as high initial costs associated with some green building materials and a lack of awareness in certain regions exist, the long-term benefits in terms of reduced operational costs and environmental impact are increasingly outweighing these concerns, ensuring sustained market expansion.
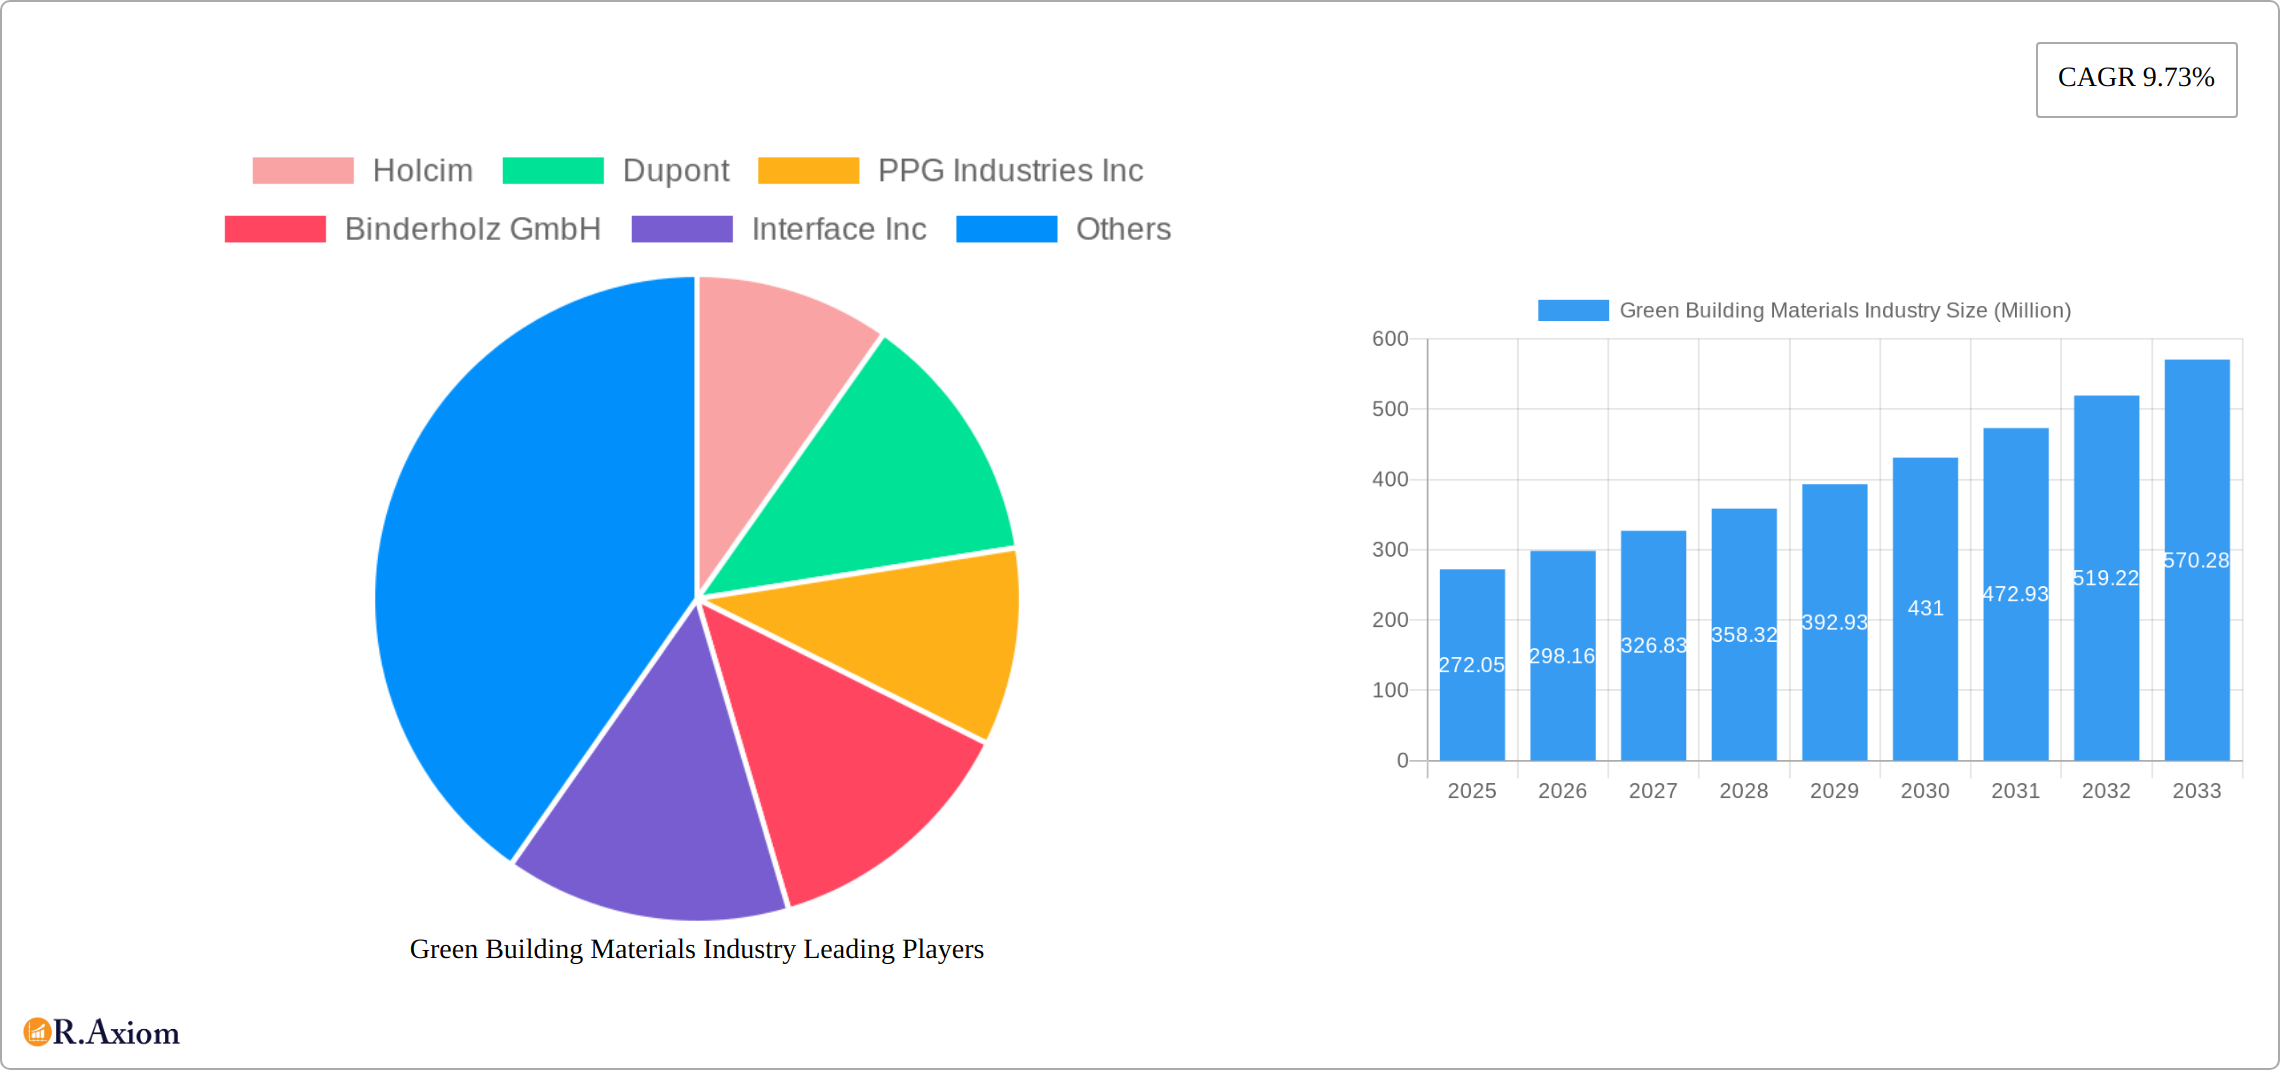
Green Building Materials Industry Market Size (In Million)
The market segmentation reveals significant opportunities across various application areas and end-use industries. Framing materials, utilizing sustainable wood and engineered lumber, are gaining traction, while insulation materials are experiencing robust growth due to rising energy costs and stricter building codes. Roofing, exterior siding, and interior finishing segments also contribute substantially. Geographically, the North American and European markets currently hold significant shares, but the Asia-Pacific region is projected to witness the most substantial growth in the forecast period, driven by strong economic growth and expanding construction sectors. Key players such as Holcim, DuPont, and Owens Corning are actively involved in research and development, leading to the introduction of new and improved green building materials. This competition is further driving innovation and market growth, contributing to a more sustainable and environmentally conscious built environment.
Green Building Materials Industry Company Market Share
Green Building Materials Industry Market Report: 2019-2033
This comprehensive report provides a detailed analysis of the Green Building Materials industry, encompassing market size, growth projections, competitive landscape, and key trends from 2019 to 2033. The study covers various segments, including application (Framing, Insulation, Roofing, Exterior Siding, Interior Finishing, Other Applications) and end-use industry (Residential, Commercial, Industrial and Institutional, Infrastructure), offering actionable insights for industry stakeholders. The report utilizes data from the historical period (2019-2024), base year (2025), and estimated year (2025), providing a robust forecast for 2025-2033. The total market size is estimated at $XX Million in 2025 and is projected to reach $XX Million by 2033, exhibiting a CAGR of XX%.
Green Building Materials Industry Market Concentration & Innovation
The green building materials market is experiencing a dynamic interplay of consolidation and innovation. Leading players, including Holcim, DuPont, PPG Industries Inc, Binderholz GmbH, Interface Inc, Owens Corning, Kingspan Group, BASF SE, Soben International (Asia-Pacific) Ltd, Saint-Gobain (Certainteed), and Sika AG, are shaping the industry landscape. While the market demonstrates moderate concentration, with the top five players holding an estimated XX% market share in 2025, a trend of increased consolidation via mergers and acquisitions (M&A) is clearly evident. Recent significant M&A activity, such as Holcim's acquisition of Wiltshire Heavy Building Materials in October 2022 (valued at $XX Million) and Saint-Gobain's acquisition of Kaycan in August 2022 (valued at $XX Million), underscores the competitive drive for expanded market share and penetration into new market segments. This consolidation is fueled by several factors: stringent environmental regulations pushing for sustainable alternatives, escalating consumer demand for eco-conscious building solutions, and continuous advancements in material science that are generating improved product performance and eco-friendly alternatives. The regulatory environment, encompassing building codes and environmental standards, plays a crucial role in material adoption rates. The emergence of product substitutes, including recycled materials and bio-based alternatives, is intensifying competition and accelerating innovation. Furthermore, end-user preferences for sustainable and energy-efficient building solutions are significantly bolstering the growth trajectory of the green building materials sector.
- Market Share (2025): Top 5 players - XX%; Top 10 players - XX%
- M&A Deal Value (2019-2024): $XX Billion (estimated)
Green Building Materials Industry Industry Trends & Insights
The green building materials market is experiencing robust growth, propelled by several factors. Rising environmental awareness and stricter environmental regulations are driving the adoption of sustainable building practices. Government initiatives promoting green building technologies and incentives are further bolstering market expansion. Technological advancements in material science are leading to the development of innovative, high-performance green building materials with improved durability, energy efficiency, and reduced environmental impact. Consumer preferences are increasingly shifting toward environmentally friendly and sustainable products, impacting purchasing decisions. Competitive dynamics are intense, with companies investing heavily in research and development, strategic partnerships, and acquisitions to maintain market leadership. The market is witnessing increased adoption of sustainable practices across the supply chain, reducing the carbon footprint and environmental impact associated with manufacturing and transportation. The market is also influenced by fluctuations in raw material prices and economic conditions. Specific market growth drivers include increased construction activity globally, government policies aimed at sustainable development, and rising awareness of indoor air quality and health benefits associated with eco-friendly building materials. The compounded annual growth rate (CAGR) for the forecast period (2025-2033) is projected at XX%, with market penetration increasing from XX% in 2025 to XX% by 2033.
Dominant Markets & Segments in Green Building Materials Industry
The North American region is currently the dominant market for green building materials, driven by stringent environmental regulations, substantial construction activity, and increased consumer awareness. Within this region, the United States holds the largest market share. In terms of segments, the Roofing and Insulation segments are currently the largest, contributing to approximately XX% of the total market value in 2025, followed by Exterior Siding. The Commercial sector dominates the end-use market segment, driven by high construction activity and sustainability initiatives by corporations. However, the Residential segment is projected to experience the fastest growth rate in the forecast period.
- Key Drivers for North America: Stringent environmental regulations, significant construction activity, high consumer awareness.
- Key Drivers for the Roofing Segment: Increasing demand for energy-efficient roofing solutions, government regulations on energy consumption.
- Key Drivers for the Commercial Sector: Corporate sustainability initiatives, large-scale construction projects.
Green Building Materials Industry Product Developments
Recent product innovations in the green building materials industry focus on improving sustainability, energy efficiency, and performance. These include bio-based materials, recycled content materials, and advanced composites. Companies are incorporating recycled materials into their products to reduce environmental impact and lower costs. Innovative insulation materials with enhanced thermal performance are gaining traction, while advanced roofing systems are designed for improved durability and energy efficiency. New exterior siding options with improved weather resistance and aesthetic appeal are also emerging. These developments reflect technological advancements, meeting growing market demand for sustainable and high-performance products.
Report Scope & Segmentation Analysis
This report segments the green building materials market based on application (Framing, Insulation, Roofing, Exterior Siding, Interior Finishing, Other Applications) and end-use industry (Residential, Commercial, Industrial and Institutional, Infrastructure). Each segment is analyzed individually, providing insights into market size, growth projections, and competitive dynamics. For example, the Framing segment is witnessing increased demand for sustainable timber and engineered wood products, while the Insulation segment is witnessing increased demand for eco-friendly alternatives such as cellulose and mineral wool. Similarly, the Residential segment is expected to witness robust growth during the forecast period driven by rising disposable incomes and a preference for energy-efficient homes. The Commercial segment is driven by large-scale construction projects and corporate sustainability initiatives. Detailed growth projections and competitive landscapes are provided for each segment in the complete report.
Key Drivers of Green Building Materials Industry Growth
Several key factors are driving the growth of the green building materials industry. Stringent environmental regulations promoting sustainable building practices are a significant catalyst. Growing consumer awareness of the environmental impact of traditional building materials is driving demand for eco-friendly alternatives. Government incentives and subsidies are further boosting market expansion. Technological advancements leading to innovative, high-performance green building materials are also key drivers. Increased construction activity globally and rising disposable incomes are contributing factors. Finally, the focus on improving energy efficiency and indoor air quality is influencing market growth.
Challenges in the Green Building Materials Industry Sector
The green building materials industry faces several challenges. The high initial cost of green materials compared to traditional counterparts can hinder adoption, especially in price-sensitive markets. Supply chain disruptions and raw material price volatility can impact production and pricing. Competition from established players and the emergence of new entrants create a challenging market environment. Furthermore, inconsistent implementation of environmental regulations across regions creates uncertainties. These factors contribute to varying degrees of market penetration and adoption rates globally. The estimated impact of these challenges on the market size in 2025 is approximately $XX Million.
Emerging Opportunities in Green Building Materials Industry
Several emerging opportunities exist in the green building materials industry. The growing demand for sustainable and circular economy practices is creating opportunities for innovative recycling and reuse solutions. The development of new bio-based materials and advanced composite materials presents significant opportunities for technological advancements. Expanding into developing economies with growing construction sectors offers untapped market potential. Furthermore, catering to the rising demand for energy-efficient and smart building solutions creates further growth opportunities for the industry. These opportunities are expected to contribute to $XX Million in additional market value by 2033.
Leading Players in the Green Building Materials Industry Market
- Holcim
- Dupont
- PPG Industries Inc
- Binderholz GmbH
- Interface Inc
- Owens Corning
- Kingspan Group
- BASF SE
- Soben International (Asia-Pacific) Ltd
- Saint- Gobain (Certainteed)
- Sika AG
Key Developments in Green Building Materials Industry Industry
- January 2022: Binderholz GmbH acquired BSW Timber Ltd, becoming Europe's largest sawmill and solid wood processing company.
- August 2022: Saint-Gobain acquired Kaycan, strengthening its global leadership in light and sustainable construction, particularly in sidings.
- October 2022: Holcim acquired Wiltshire Heavy Building Materials, expanding its UK market presence in green building solutions and material circularity.
Strategic Outlook for Green Building Materials Industry Market
The future of the green building materials market is promising, driven by several factors. Continued growth in construction activity globally, coupled with increasing environmental awareness and stringent regulations, will fuel demand for sustainable building materials. Technological advancements and innovations in material science will continue to drive product development and market expansion. Government policies supporting green building initiatives and incentives will further propel market growth. The focus on energy efficiency and sustainable development will continue to create opportunities for companies offering innovative and high-performance green building solutions. The market is poised for significant growth, with substantial potential for expansion in both developed and developing economies.
Green Building Materials Industry Segmentation
-
1. Application
- 1.1. Framing
- 1.2. Insulation
- 1.3. Roofing
- 1.4. Exterior Siding
- 1.5. Interior Finishing
- 1.6. Other Applications
-
2. End-use Industry
- 2.1. Residential
- 2.2. Commercial
- 2.3. Industrial and Institutional
- 2.4. Infrastructure
Green Building Materials Industry Segmentation By Geography
-
1. Asia Pacific
- 1.1. China
- 1.2. India
- 1.3. Japan
- 1.4. South Korea
- 1.5. Rest of Asia Pacific
-
2. North America
- 2.1. United States
- 2.2. Canada
- 2.3. Mexico
-
3. Europe
- 3.1. Germany
- 3.2. United Kingdom
- 3.3. Italy
- 3.4. France
- 3.5. Rest of Europe
-
4. South America
- 4.1. Brazil
- 4.2. Argentina
- 4.3. Rest of South America
- 5. Middle East
-
6. Saudi Arabia
- 6.1. South Africa
- 6.2. Rest of Middle East
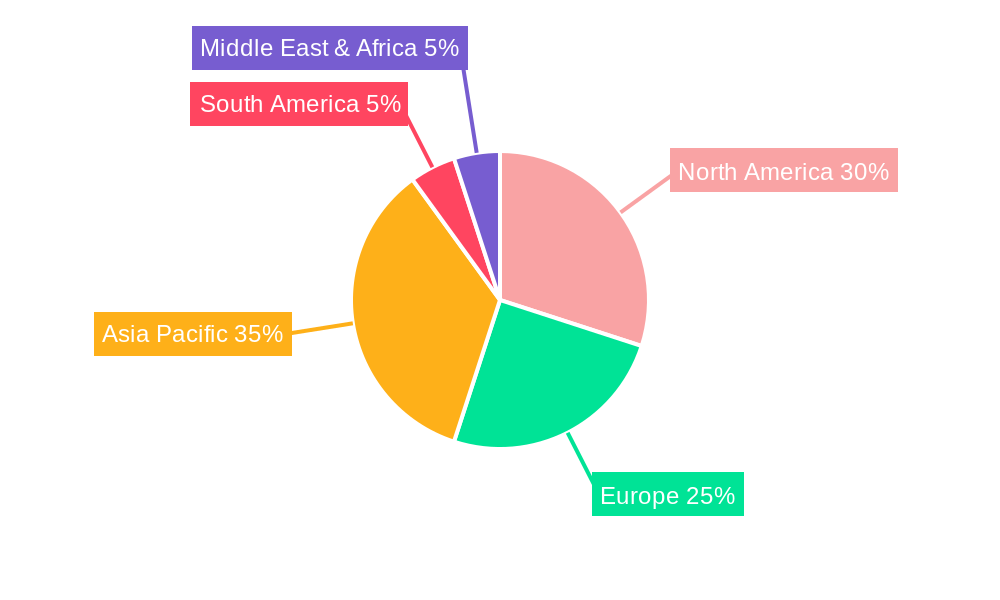
Green Building Materials Industry Regional Market Share
Geographic Coverage of Green Building Materials Industry
Green Building Materials Industry REPORT HIGHLIGHTS
| Aspects | Details |
|---|---|
| Study Period | 2020-2034 |
| Base Year | 2025 |
| Estimated Year | 2026 |
| Forecast Period | 2026-2034 |
| Historical Period | 2020-2025 |
| Growth Rate | CAGR of 9.73% from 2020-2034 |
| Segmentation |
|
Table of Contents
- 1. Introduction
- 1.1. Research Scope
- 1.2. Market Segmentation
- 1.3. Research Objective
- 1.4. Definitions and Assumptions
- 2. Executive Summary
- 2.1. Market Snapshot
- 3. Market Dynamics
- 3.1. Market Drivers
- 3.2. Market Restrains
- 3.3. Market Trends
- 3.4. Market Opportunities
- 4. Market Factor Analysis
- 4.1. Porters Five Forces
- 4.1.1. Bargaining Power of Suppliers
- 4.1.2. Bargaining Power of Buyers
- 4.1.3. Threat of New Entrants
- 4.1.4. Threat of Substitutes
- 4.1.5. Competitive Rivalry
- 4.2. PESTEL analysis
- 4.3. BCG Analysis
- 4.3.1. Stars (High Growth, High Market Share)
- 4.3.2. Cash Cows (Low Growth, High Market Share)
- 4.3.3. Question Mark (High Growth, Low Market Share)
- 4.3.4. Dogs (Low Growth, Low Market Share)
- 4.4. Ansoff Matrix Analysis
- 4.5. Supply Chain Analysis
- 4.6. Regulatory Landscape
- 4.7. Current Market Potential and Opportunity Assessment (TAM–SAM–SOM Framework)
- 4.8. RAX Analyst Note
- 4.1. Porters Five Forces
- 5. Market Analysis, Insights and Forecast 2021-2033
- 5.1. Market Analysis, Insights and Forecast - by Application
- 5.1.1. Framing
- 5.1.2. Insulation
- 5.1.3. Roofing
- 5.1.4. Exterior Siding
- 5.1.5. Interior Finishing
- 5.1.6. Other Applications
- 5.2. Market Analysis, Insights and Forecast - by End-use Industry
- 5.2.1. Residential
- 5.2.2. Commercial
- 5.2.3. Industrial and Institutional
- 5.2.4. Infrastructure
- 5.3. Market Analysis, Insights and Forecast - by Region
- 5.3.1. Asia Pacific
- 5.3.2. North America
- 5.3.3. Europe
- 5.3.4. South America
- 5.3.5. Middle East
- 5.3.6. Saudi Arabia
- 5.1. Market Analysis, Insights and Forecast - by Application
- 6. Global Green Building Materials Industry Analysis, Insights and Forecast, 2021-2033
- 6.1. Market Analysis, Insights and Forecast - by Application
- 6.1.1. Framing
- 6.1.2. Insulation
- 6.1.3. Roofing
- 6.1.4. Exterior Siding
- 6.1.5. Interior Finishing
- 6.1.6. Other Applications
- 6.2. Market Analysis, Insights and Forecast - by End-use Industry
- 6.2.1. Residential
- 6.2.2. Commercial
- 6.2.3. Industrial and Institutional
- 6.2.4. Infrastructure
- 6.1. Market Analysis, Insights and Forecast - by Application
- 7. Asia Pacific Green Building Materials Industry Analysis, Insights and Forecast, 2020-2032
- 7.1. Market Analysis, Insights and Forecast - by Application
- 7.1.1. Framing
- 7.1.2. Insulation
- 7.1.3. Roofing
- 7.1.4. Exterior Siding
- 7.1.5. Interior Finishing
- 7.1.6. Other Applications
- 7.2. Market Analysis, Insights and Forecast - by End-use Industry
- 7.2.1. Residential
- 7.2.2. Commercial
- 7.2.3. Industrial and Institutional
- 7.2.4. Infrastructure
- 7.1. Market Analysis, Insights and Forecast - by Application
- 8. North America Green Building Materials Industry Analysis, Insights and Forecast, 2020-2032
- 8.1. Market Analysis, Insights and Forecast - by Application
- 8.1.1. Framing
- 8.1.2. Insulation
- 8.1.3. Roofing
- 8.1.4. Exterior Siding
- 8.1.5. Interior Finishing
- 8.1.6. Other Applications
- 8.2. Market Analysis, Insights and Forecast - by End-use Industry
- 8.2.1. Residential
- 8.2.2. Commercial
- 8.2.3. Industrial and Institutional
- 8.2.4. Infrastructure
- 8.1. Market Analysis, Insights and Forecast - by Application
- 9. Europe Green Building Materials Industry Analysis, Insights and Forecast, 2020-2032
- 9.1. Market Analysis, Insights and Forecast - by Application
- 9.1.1. Framing
- 9.1.2. Insulation
- 9.1.3. Roofing
- 9.1.4. Exterior Siding
- 9.1.5. Interior Finishing
- 9.1.6. Other Applications
- 9.2. Market Analysis, Insights and Forecast - by End-use Industry
- 9.2.1. Residential
- 9.2.2. Commercial
- 9.2.3. Industrial and Institutional
- 9.2.4. Infrastructure
- 9.1. Market Analysis, Insights and Forecast - by Application
- 10. South America Green Building Materials Industry Analysis, Insights and Forecast, 2020-2032
- 10.1. Market Analysis, Insights and Forecast - by Application
- 10.1.1. Framing
- 10.1.2. Insulation
- 10.1.3. Roofing
- 10.1.4. Exterior Siding
- 10.1.5. Interior Finishing
- 10.1.6. Other Applications
- 10.2. Market Analysis, Insights and Forecast - by End-use Industry
- 10.2.1. Residential
- 10.2.2. Commercial
- 10.2.3. Industrial and Institutional
- 10.2.4. Infrastructure
- 10.1. Market Analysis, Insights and Forecast - by Application
- 11. Middle East Green Building Materials Industry Analysis, Insights and Forecast, 2020-2032
- 11.1. Market Analysis, Insights and Forecast - by Application
- 11.1.1. Framing
- 11.1.2. Insulation
- 11.1.3. Roofing
- 11.1.4. Exterior Siding
- 11.1.5. Interior Finishing
- 11.1.6. Other Applications
- 11.2. Market Analysis, Insights and Forecast - by End-use Industry
- 11.2.1. Residential
- 11.2.2. Commercial
- 11.2.3. Industrial and Institutional
- 11.2.4. Infrastructure
- 11.1. Market Analysis, Insights and Forecast - by Application
- 12. Saudi Arabia Green Building Materials Industry Analysis, Insights and Forecast, 2020-2032
- 12.1. Market Analysis, Insights and Forecast - by Application
- 12.1.1. Framing
- 12.1.2. Insulation
- 12.1.3. Roofing
- 12.1.4. Exterior Siding
- 12.1.5. Interior Finishing
- 12.1.6. Other Applications
- 12.2. Market Analysis, Insights and Forecast - by End-use Industry
- 12.2.1. Residential
- 12.2.2. Commercial
- 12.2.3. Industrial and Institutional
- 12.2.4. Infrastructure
- 12.1. Market Analysis, Insights and Forecast - by Application
- 13. Competitive Analysis
- 13.1. Company Profiles
- 13.1.1 Holcim
- 13.1.1.1. Company Overview
- 13.1.1.2. Products
- 13.1.1.3. Company Financials
- 13.1.1.4. SWOT Analysis
- 13.1.2 Dupont
- 13.1.2.1. Company Overview
- 13.1.2.2. Products
- 13.1.2.3. Company Financials
- 13.1.2.4. SWOT Analysis
- 13.1.3 PPG Industries Inc
- 13.1.3.1. Company Overview
- 13.1.3.2. Products
- 13.1.3.3. Company Financials
- 13.1.3.4. SWOT Analysis
- 13.1.4 Binderholz GmbH
- 13.1.4.1. Company Overview
- 13.1.4.2. Products
- 13.1.4.3. Company Financials
- 13.1.4.4. SWOT Analysis
- 13.1.5 Interface Inc
- 13.1.5.1. Company Overview
- 13.1.5.2. Products
- 13.1.5.3. Company Financials
- 13.1.5.4. SWOT Analysis
- 13.1.6 Owens Corning
- 13.1.6.1. Company Overview
- 13.1.6.2. Products
- 13.1.6.3. Company Financials
- 13.1.6.4. SWOT Analysis
- 13.1.7 Kingspan Group
- 13.1.7.1. Company Overview
- 13.1.7.2. Products
- 13.1.7.3. Company Financials
- 13.1.7.4. SWOT Analysis
- 13.1.8 BASF SE
- 13.1.8.1. Company Overview
- 13.1.8.2. Products
- 13.1.8.3. Company Financials
- 13.1.8.4. SWOT Analysis
- 13.1.9 Soben International (Asia-Pacific) Ltd*List Not Exhaustive
- 13.1.9.1. Company Overview
- 13.1.9.2. Products
- 13.1.9.3. Company Financials
- 13.1.9.4. SWOT Analysis
- 13.1.10 Saint- Gobain (Certainteed)
- 13.1.10.1. Company Overview
- 13.1.10.2. Products
- 13.1.10.3. Company Financials
- 13.1.10.4. SWOT Analysis
- 13.1.11 Sika AG
- 13.1.11.1. Company Overview
- 13.1.11.2. Products
- 13.1.11.3. Company Financials
- 13.1.11.4. SWOT Analysis
- 13.1.1 Holcim
- 13.2. Market Entropy
- 13.2.1 Company's Key Areas Served
- 13.2.2 Recent Developments
- 13.3. Company Market Share Analysis 2025
- 13.3.1 Top 5 Companies Market Share Analysis
- 13.3.2 Top 3 Companies Market Share Analysis
- 13.4. List of Potential Customers
- 14. Research Methodology
List of Figures
- Figure 1: Global Green Building Materials Industry Revenue Breakdown (Million, %) by Region 2025 & 2033
- Figure 2: Asia Pacific Green Building Materials Industry Revenue (Million), by Application 2025 & 2033
- Figure 3: Asia Pacific Green Building Materials Industry Revenue Share (%), by Application 2025 & 2033
- Figure 4: Asia Pacific Green Building Materials Industry Revenue (Million), by End-use Industry 2025 & 2033
- Figure 5: Asia Pacific Green Building Materials Industry Revenue Share (%), by End-use Industry 2025 & 2033
- Figure 6: Asia Pacific Green Building Materials Industry Revenue (Million), by Country 2025 & 2033
- Figure 7: Asia Pacific Green Building Materials Industry Revenue Share (%), by Country 2025 & 2033
- Figure 8: North America Green Building Materials Industry Revenue (Million), by Application 2025 & 2033
- Figure 9: North America Green Building Materials Industry Revenue Share (%), by Application 2025 & 2033
- Figure 10: North America Green Building Materials Industry Revenue (Million), by End-use Industry 2025 & 2033
- Figure 11: North America Green Building Materials Industry Revenue Share (%), by End-use Industry 2025 & 2033
- Figure 12: North America Green Building Materials Industry Revenue (Million), by Country 2025 & 2033
- Figure 13: North America Green Building Materials Industry Revenue Share (%), by Country 2025 & 2033
- Figure 14: Europe Green Building Materials Industry Revenue (Million), by Application 2025 & 2033
- Figure 15: Europe Green Building Materials Industry Revenue Share (%), by Application 2025 & 2033
- Figure 16: Europe Green Building Materials Industry Revenue (Million), by End-use Industry 2025 & 2033
- Figure 17: Europe Green Building Materials Industry Revenue Share (%), by End-use Industry 2025 & 2033
- Figure 18: Europe Green Building Materials Industry Revenue (Million), by Country 2025 & 2033
- Figure 19: Europe Green Building Materials Industry Revenue Share (%), by Country 2025 & 2033
- Figure 20: South America Green Building Materials Industry Revenue (Million), by Application 2025 & 2033
- Figure 21: South America Green Building Materials Industry Revenue Share (%), by Application 2025 & 2033
- Figure 22: South America Green Building Materials Industry Revenue (Million), by End-use Industry 2025 & 2033
- Figure 23: South America Green Building Materials Industry Revenue Share (%), by End-use Industry 2025 & 2033
- Figure 24: South America Green Building Materials Industry Revenue (Million), by Country 2025 & 2033
- Figure 25: South America Green Building Materials Industry Revenue Share (%), by Country 2025 & 2033
- Figure 26: Middle East Green Building Materials Industry Revenue (Million), by Application 2025 & 2033
- Figure 27: Middle East Green Building Materials Industry Revenue Share (%), by Application 2025 & 2033
- Figure 28: Middle East Green Building Materials Industry Revenue (Million), by End-use Industry 2025 & 2033
- Figure 29: Middle East Green Building Materials Industry Revenue Share (%), by End-use Industry 2025 & 2033
- Figure 30: Middle East Green Building Materials Industry Revenue (Million), by Country 2025 & 2033
- Figure 31: Middle East Green Building Materials Industry Revenue Share (%), by Country 2025 & 2033
- Figure 32: Saudi Arabia Green Building Materials Industry Revenue (Million), by Application 2025 & 2033
- Figure 33: Saudi Arabia Green Building Materials Industry Revenue Share (%), by Application 2025 & 2033
- Figure 34: Saudi Arabia Green Building Materials Industry Revenue (Million), by End-use Industry 2025 & 2033
- Figure 35: Saudi Arabia Green Building Materials Industry Revenue Share (%), by End-use Industry 2025 & 2033
- Figure 36: Saudi Arabia Green Building Materials Industry Revenue (Million), by Country 2025 & 2033
- Figure 37: Saudi Arabia Green Building Materials Industry Revenue Share (%), by Country 2025 & 2033
List of Tables
- Table 1: Global Green Building Materials Industry Revenue Million Forecast, by Application 2020 & 2033
- Table 2: Global Green Building Materials Industry Revenue Million Forecast, by End-use Industry 2020 & 2033
- Table 3: Global Green Building Materials Industry Revenue Million Forecast, by Region 2020 & 2033
- Table 4: Global Green Building Materials Industry Revenue Million Forecast, by Application 2020 & 2033
- Table 5: Global Green Building Materials Industry Revenue Million Forecast, by End-use Industry 2020 & 2033
- Table 6: Global Green Building Materials Industry Revenue Million Forecast, by Country 2020 & 2033
- Table 7: China Green Building Materials Industry Revenue (Million) Forecast, by Application 2020 & 2033
- Table 8: India Green Building Materials Industry Revenue (Million) Forecast, by Application 2020 & 2033
- Table 9: Japan Green Building Materials Industry Revenue (Million) Forecast, by Application 2020 & 2033
- Table 10: South Korea Green Building Materials Industry Revenue (Million) Forecast, by Application 2020 & 2033
- Table 11: Rest of Asia Pacific Green Building Materials Industry Revenue (Million) Forecast, by Application 2020 & 2033
- Table 12: Global Green Building Materials Industry Revenue Million Forecast, by Application 2020 & 2033
- Table 13: Global Green Building Materials Industry Revenue Million Forecast, by End-use Industry 2020 & 2033
- Table 14: Global Green Building Materials Industry Revenue Million Forecast, by Country 2020 & 2033
- Table 15: United States Green Building Materials Industry Revenue (Million) Forecast, by Application 2020 & 2033
- Table 16: Canada Green Building Materials Industry Revenue (Million) Forecast, by Application 2020 & 2033
- Table 17: Mexico Green Building Materials Industry Revenue (Million) Forecast, by Application 2020 & 2033
- Table 18: Global Green Building Materials Industry Revenue Million Forecast, by Application 2020 & 2033
- Table 19: Global Green Building Materials Industry Revenue Million Forecast, by End-use Industry 2020 & 2033
- Table 20: Global Green Building Materials Industry Revenue Million Forecast, by Country 2020 & 2033
- Table 21: Germany Green Building Materials Industry Revenue (Million) Forecast, by Application 2020 & 2033
- Table 22: United Kingdom Green Building Materials Industry Revenue (Million) Forecast, by Application 2020 & 2033
- Table 23: Italy Green Building Materials Industry Revenue (Million) Forecast, by Application 2020 & 2033
- Table 24: France Green Building Materials Industry Revenue (Million) Forecast, by Application 2020 & 2033
- Table 25: Rest of Europe Green Building Materials Industry Revenue (Million) Forecast, by Application 2020 & 2033
- Table 26: Global Green Building Materials Industry Revenue Million Forecast, by Application 2020 & 2033
- Table 27: Global Green Building Materials Industry Revenue Million Forecast, by End-use Industry 2020 & 2033
- Table 28: Global Green Building Materials Industry Revenue Million Forecast, by Country 2020 & 2033
- Table 29: Brazil Green Building Materials Industry Revenue (Million) Forecast, by Application 2020 & 2033
- Table 30: Argentina Green Building Materials Industry Revenue (Million) Forecast, by Application 2020 & 2033
- Table 31: Rest of South America Green Building Materials Industry Revenue (Million) Forecast, by Application 2020 & 2033
- Table 32: Global Green Building Materials Industry Revenue Million Forecast, by Application 2020 & 2033
- Table 33: Global Green Building Materials Industry Revenue Million Forecast, by End-use Industry 2020 & 2033
- Table 34: Global Green Building Materials Industry Revenue Million Forecast, by Country 2020 & 2033
- Table 35: Global Green Building Materials Industry Revenue Million Forecast, by Application 2020 & 2033
- Table 36: Global Green Building Materials Industry Revenue Million Forecast, by End-use Industry 2020 & 2033
- Table 37: Global Green Building Materials Industry Revenue Million Forecast, by Country 2020 & 2033
- Table 38: South Africa Green Building Materials Industry Revenue (Million) Forecast, by Application 2020 & 2033
- Table 39: Rest of Middle East Green Building Materials Industry Revenue (Million) Forecast, by Application 2020 & 2033
Frequently Asked Questions
1. What is the projected Compound Annual Growth Rate (CAGR) of the Green Building Materials Industry?
The projected CAGR is approximately 9.73%.
2. Which companies are prominent players in the Green Building Materials Industry?
Key companies in the market include Holcim, Dupont, PPG Industries Inc, Binderholz GmbH, Interface Inc, Owens Corning, Kingspan Group, BASF SE, Soben International (Asia-Pacific) Ltd*List Not Exhaustive, Saint- Gobain (Certainteed), Sika AG.
3. What are the main segments of the Green Building Materials Industry?
The market segments include Application, End-use Industry.
4. Can you provide details about the market size?
The market size is estimated to be USD 272.05 Million as of 2022.
5. What are some drivers contributing to market growth?
Increasing Demand for Insulation and Energy-efficient Buildings; Favorable Government Policies for Green Buildings.
6. What are the notable trends driving market growth?
Increasing Consumption of Green Building Materials in the Residential End-use Industry.
7. Are there any restraints impacting market growth?
High Initial Capital Investment Compared to Conventional Buildings.
8. Can you provide examples of recent developments in the market?
October 2022: Holcim acquired Wiltshire Heavy Building Materials, one of the leading companies providing building solutions and material circularity in the United Kingdom. This acquisition will strengthen Holcim's market presence in the United Kingdom's green building materials market.
9. What pricing options are available for accessing the report?
Pricing options include single-user, multi-user, and enterprise licenses priced at USD 4750, USD 5250, and USD 8750 respectively.
10. Is the market size provided in terms of value or volume?
The market size is provided in terms of value, measured in Million.
11. Are there any specific market keywords associated with the report?
Yes, the market keyword associated with the report is "Green Building Materials Industry," which aids in identifying and referencing the specific market segment covered.
12. How do I determine which pricing option suits my needs best?
The pricing options vary based on user requirements and access needs. Individual users may opt for single-user licenses, while businesses requiring broader access may choose multi-user or enterprise licenses for cost-effective access to the report.
13. Are there any additional resources or data provided in the Green Building Materials Industry report?
While the report offers comprehensive insights, it's advisable to review the specific contents or supplementary materials provided to ascertain if additional resources or data are available.
14. How can I stay updated on further developments or reports in the Green Building Materials Industry?
To stay informed about further developments, trends, and reports in the Green Building Materials Industry, consider subscribing to industry newsletters, following relevant companies and organizations, or regularly checking reputable industry news sources and publications.
Methodology
Step 1 - Identification of Relevant Samples Size from Population Database


Step 2 - Approaches for Defining Global Market Size (Value, Volume* & Price*)

Note*: In applicable scenarios
Step 3 - Data Sources
Primary Research
- Web Analytics
- Survey Reports
- Research Institute
- Latest Research Reports
- Opinion Leaders
Secondary Research
- Annual Reports
- White Paper
- Latest Press Release
- Industry Association
- Paid Database
- Investor Presentations

Step 4 - Data Triangulation
Involves using different sources of information in order to increase the validity of a study
These sources are likely to be stakeholders in a program - participants, other researchers, program staff, other community members, and so on.
Then we put all data in single framework & apply various statistical tools to find out the dynamic on the market.
During the analysis stage, feedback from the stakeholder groups would be compared to determine areas of agreement as well as areas of divergence