

Key Insights
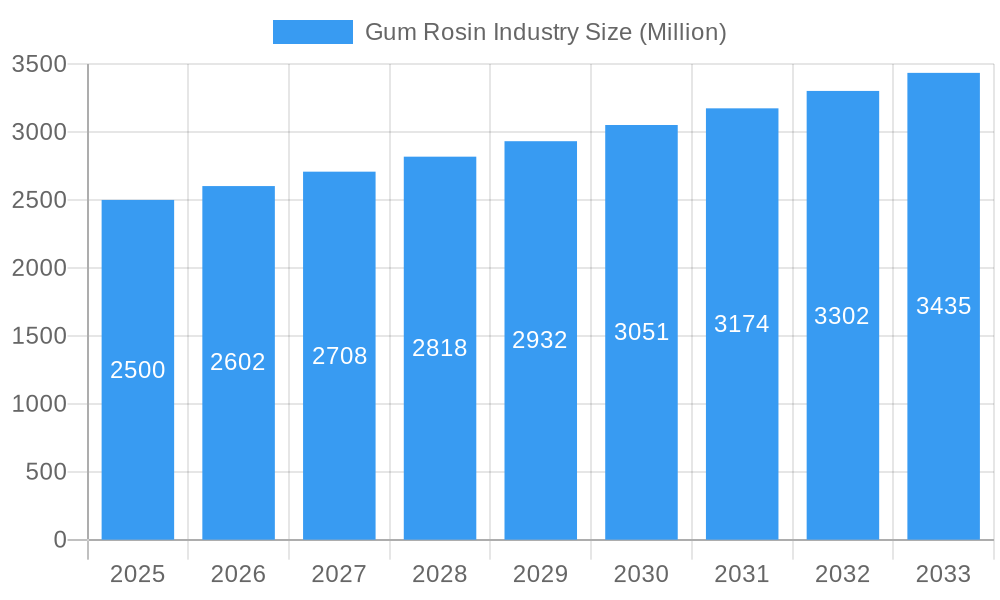
The global Gum Rosin market is projected for significant expansion, estimated at 2632.6 million by 2025. The market is expected to grow at a Compound Annual Growth Rate (CAGR) of 4.4% from 2025 to 2033. This growth is underpinned by escalating demand across key applications including paper sizing, printing inks, adhesives, sealants, paints, and coatings. Driving factors include the robust expansion of the construction and packaging sectors, alongside population growth, which fuels the need for printed materials. Continuous innovation in rosin derivatives with improved functionalities further supports market ascent. However, the market navigates challenges such as volatile pine resin pricing, stringent VOC regulations, and the availability of synthetic alternatives.
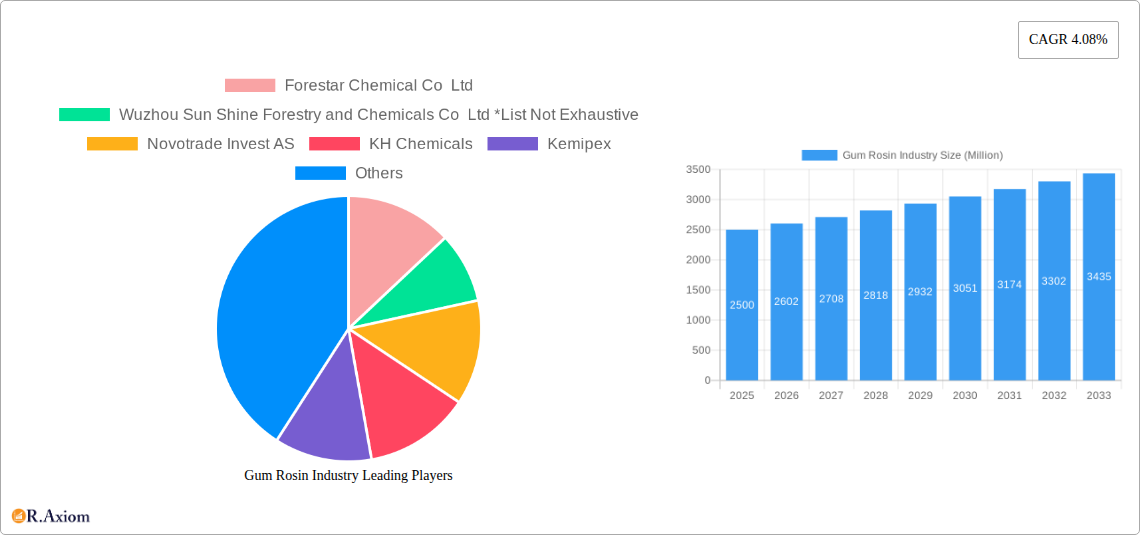
Gum Rosin Industry Market Size (In Billion)
Despite these hurdles, positive market dynamics are evident. A pronounced shift towards sustainable and bio-based materials is increasing demand for Gum Rosin as a renewable resource, particularly in environmentally conscious regions with strict regulations. Strategic market expansion into developing economies with burgeoning industrial sectors, complemented by collaborations between producers and end-users, are further catalyzing growth. Market segmentation by application enables manufacturers to develop specialized solutions, enhancing market penetration and fostering innovation. The competitive environment features a blend of established and new entrants, promoting product variety and price competition. The Gum Rosin market is therefore positioned for sustained growth, fueled by innovation, sustainability, and evolving industry trends.
Gum Rosin Industry Company Market Share
Gum Rosin Industry: A Comprehensive Market Report (2019-2033)
This comprehensive report provides an in-depth analysis of the global gum rosin industry, covering market size, segmentation, growth drivers, challenges, and key players. The study period spans from 2019 to 2033, with 2025 serving as the base and estimated year. The forecast period is 2025-2033, and the historical period covers 2019-2024. This report is crucial for industry stakeholders, investors, and businesses seeking to understand the current landscape and future trajectory of the gum rosin market. The total market size in 2025 is estimated at xx Million USD.
Gum Rosin Industry Market Concentration & Innovation
The gum rosin market exhibits a moderately concentrated structure, with several large players holding significant market share. However, the presence of numerous smaller regional players adds to the complexity. Forestar Chemical Co Ltd and Wuzhou Sun Shine Forestry and Chemicals Co Ltd are among the prominent companies, though precise market share data for individual players is confidential and varies yearly. Market concentration is further influenced by M&A activities, with deal values fluctuating depending on the size and strategic importance of the acquired companies. Recent years have seen xx Million USD in M&A transactions, primarily focused on consolidating production capacities and expanding geographic reach. Innovation in the industry is driven by the need to improve product quality, sustainability, and find new applications for gum rosin derivatives. Regulatory frameworks vary across regions, impacting production and usage. Key regulatory aspects include environmental regulations regarding resin extraction and the safety standards for rosin applications in various industries. Substitutes, like synthetic resins, pose a competitive threat, but gum rosin continues to maintain its dominance due to its unique properties and cost-effectiveness in certain applications. End-user trends show growing preference for sustainable and eco-friendly alternatives.
- Market Share: Exact figures unavailable due to confidential company data.
- M&A Deal Values (2019-2024): xx Million USD (estimated)
- Key Innovation Drivers: Sustainability, new applications, improved quality.
- Regulatory Landscape: Varies regionally; focuses on environmental and safety aspects.
Gum Rosin Industry Industry Trends & Insights
The global gum rosin market is projected to witness a Compound Annual Growth Rate (CAGR) of xx% during the forecast period (2025-2033). This growth is primarily propelled by the increasing demand from key end-use sectors such as paper sizing, adhesives, and paints and coatings. Technological advancements in rosin modification and processing have led to the development of new products with enhanced properties and broader applications. Consumer preferences towards natural and sustainable materials are also driving market growth. However, the market faces challenges from the rise of synthetic alternatives and fluctuations in raw material prices. Market penetration of gum rosin derivatives in emerging economies is also a key factor driving future growth, although specifics vary by region and application. Competitive dynamics are intense, with companies focusing on product diversification, strategic partnerships, and geographic expansion to gain a competitive edge.
- CAGR (2025-2033): xx%
- Market Penetration: Highest in developed regions, growing in emerging markets.
Dominant Markets & Segments in Gum Rosin Industry
The Asia-Pacific region currently dominates the global gum rosin market due to the substantial presence of major producers and significant end-user industries. China holds the largest market share within the region due to its robust paper and packaging sector. Specific countries will also exhibit differences in market performance, impacted by factors such as economic growth and government policies.
- Dominant Region: Asia-Pacific (particularly China)
- Key Drivers (Asia-Pacific):
- Strong growth in paper and packaging industries.
- Increasing construction activities boosting demand for adhesives and sealants.
- Favorable economic policies supporting industrial growth.
- Well-established supply chains.
- Dominant Segment (Application): Paper sizing remains the largest segment due to its widespread use in paper manufacturing. Other major segments include Adhesives & Sealants, Paints & Coatings, and Printing Inks. Further, the dominance of the Paper sizing segment is primarily due to the established and widespread use of gum rosin in the production of paper. Adhesives and Sealants benefit from the need for high-quality, sustainable binding materials. Paints and Coatings leverage gum rosin's unique properties for enhancing gloss, durability, and adhesion. Printing inks utilize gum rosin for specific properties impacting print quality. Other applications represent a smaller but growing market, showcasing the continuous innovation in extending its use to new fields.
Gum Rosin Industry Product Developments
Recent product innovations focus on developing modified rosin derivatives with enhanced properties such as improved tack, adhesion, and water resistance. This is achieved through chemical modification processes that optimize performance for specific applications. These new products offer significant competitive advantages, expanding market reach and allowing manufacturers to cater to diverse industry needs. The technological trends emphasize improving sustainability and reducing environmental impact through bio-based modifications and optimized production processes. This market fit directly responds to increasing demand for eco-friendly and cost-effective solutions.
Report Scope & Segmentation Analysis
This report segments the gum rosin market by application: Paper Sizing, Printing Ink, Adhesives and Sealants, Rubber, Paints and Coatings, and Other Applications. Each segment's market size, growth projection, and competitive dynamics are analyzed separately. For instance, the paper sizing segment is expected to show steady growth, fueled by the increasing demand for paper products. The adhesives and sealants segment benefits from the growth in construction and packaging industries, with different products experiencing varying demand levels. Paints and coatings utilize gum rosin for specific properties in their formulations, and market performance here depends heavily on developments within the broader paints market. The printing ink segment shows variable trends, with some segments showing steady growth and others facing challenges from digital printing technologies. The "Other Applications" segment accounts for smaller but diverse market segments. Each segment will show varying levels of market concentration and growth potential.
Key Drivers of Gum Rosin Industry Growth
The growth of the gum rosin industry is driven by several factors. Increased demand from the paper and packaging sector remains a crucial driver. The construction industry's expansion fuels the demand for adhesives and sealants. Moreover, the automotive industry's use of gum rosin in tires and other components contributes to market growth. Technological advancements in rosin modification and processing contribute to creating specialized products with enhanced applications. Favorable government policies supporting sustainable materials also create positive market momentum.
Challenges in the Gum Rosin Industry Sector
The gum rosin industry faces several challenges. Fluctuations in raw material prices represent a major concern. The increasing availability and competition from synthetic resins pose a significant threat. Stricter environmental regulations increase production costs and compliance complexities. Supply chain disruptions due to geopolitical events or natural disasters can significantly impact production and pricing. These factors negatively affect profitability and market stability, making risk mitigation crucial for businesses.
Emerging Opportunities in Gum Rosin Industry
The gum rosin industry presents several emerging opportunities. Growing demand for sustainable and bio-based materials creates potential for expanding markets. Developing new applications in emerging industries like bioplastics and renewable energy presents lucrative prospects. Innovations in rosin modification and processing create opportunities for high-value, specialized products. Expanding into new geographical markets, particularly in developing economies with growing industrial sectors, is also a considerable opportunity.
Leading Players in the Gum Rosin Industry Market
- Forestar Chemical Co Ltd
- Wuzhou Sun Shine Forestry and Chemicals Co Ltd
- Novotrade Invest AS
- KH Chemicals
- Kemipex
- PT INDOPICRI (Indonesia Pine Chemical Industri)
- Harima Chemicals Group Inc
- Guangxi Dinghong Resin Co Ltd
- Finjetchemical Co Ltd
- Silver Fern Chemical Inc
- Guangxi Tone Resin Chemical Co Ltd
- United Resins
- Foreverest Resources Ltd
- Arakawa Chemical Industries Ltd
- DRT (Dérivés Résiniques et Terpéniques)
Key Developments in Gum Rosin Industry Industry
- 2022 Q4: Company X launched a new modified rosin derivative with improved water resistance.
- 2023 Q1: Merger between Company Y and Company Z resulted in a larger market share.
- 2023 Q3: New environmental regulations introduced in Region A impacted production costs.
- 2024 Q2: Company A announced a significant expansion of its production facility.
Strategic Outlook for Gum Rosin Industry Market
The future of the gum rosin market looks promising, driven by increasing demand from various end-use sectors and continuous innovation in product development. The focus on sustainability and the development of bio-based alternatives will shape the industry's trajectory. Expanding into new applications and markets, particularly in developing economies, presents significant growth opportunities. Strategic partnerships and investments in research and development will be crucial for success in this dynamic market.
Gum Rosin Industry Segmentation
-
1. Application
- 1.1. Paper Sizing
- 1.2. Printing Ink
- 1.3. Adhesives and Sealants
- 1.4. Rubber
- 1.5. Paints and Coatings
- 1.6. Other Applications
Gum Rosin Industry Segmentation By Geography
-
1. Asia Pacific
- 1.1. China
- 1.2. India
- 1.3. Japan
- 1.4. South Korea
- 1.5. Rest of Asia Pacific
-
2. North America
- 2.1. United States
- 2.2. Canada
- 2.3. Mexico
-
3. Europe
- 3.1. Germany
- 3.2. United Kingdom
- 3.3. Italy
- 3.4. France
- 3.5. Rest of Europe
-
4. South America
- 4.1. Brazil
- 4.2. Argentina
- 4.3. Rest of South America
-
5. Middle East and Africa
- 5.1. Saudi Arabia
- 5.2. South Africa
- 5.3. Rest of Middle East and Africa
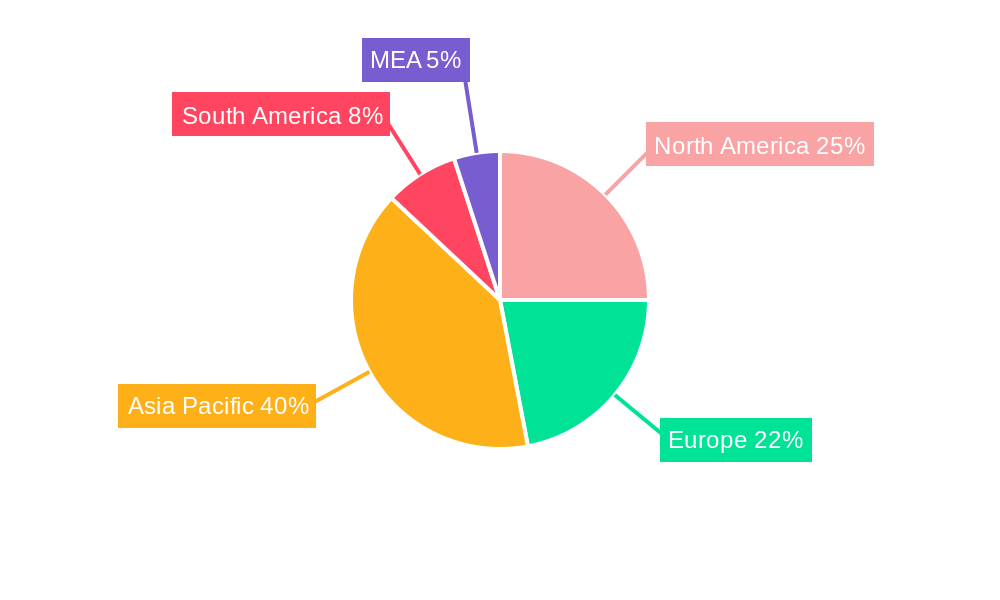
Gum Rosin Industry Regional Market Share
Geographic Coverage of Gum Rosin Industry
Gum Rosin Industry REPORT HIGHLIGHTS
| Aspects | Details |
|---|---|
| Study Period | 2020-2034 |
| Base Year | 2025 |
| Estimated Year | 2026 |
| Forecast Period | 2026-2034 |
| Historical Period | 2020-2025 |
| Growth Rate | CAGR of 4.4% from 2020-2034 |
| Segmentation |
|
Table of Contents
- 1. Introduction
- 1.1. Research Scope
- 1.2. Market Segmentation
- 1.3. Research Objective
- 1.4. Definitions and Assumptions
- 2. Executive Summary
- 2.1. Market Snapshot
- 3. Market Dynamics
- 3.1. Market Drivers
- 3.2. Market Restrains
- 3.3. Market Trends
- 3.4. Market Opportunities
- 4. Market Factor Analysis
- 4.1. Porters Five Forces
- 4.1.1. Bargaining Power of Suppliers
- 4.1.2. Bargaining Power of Buyers
- 4.1.3. Threat of New Entrants
- 4.1.4. Threat of Substitutes
- 4.1.5. Competitive Rivalry
- 4.2. PESTEL analysis
- 4.3. BCG Analysis
- 4.3.1. Stars (High Growth, High Market Share)
- 4.3.2. Cash Cows (Low Growth, High Market Share)
- 4.3.3. Question Mark (High Growth, Low Market Share)
- 4.3.4. Dogs (Low Growth, Low Market Share)
- 4.4. Ansoff Matrix Analysis
- 4.5. Supply Chain Analysis
- 4.6. Regulatory Landscape
- 4.7. Current Market Potential and Opportunity Assessment (TAM–SAM–SOM Framework)
- 4.8. RAX Analyst Note
- 4.1. Porters Five Forces
- 5. Market Analysis, Insights and Forecast 2021-2033
- 5.1. Market Analysis, Insights and Forecast - by Application
- 5.1.1. Paper Sizing
- 5.1.2. Printing Ink
- 5.1.3. Adhesives and Sealants
- 5.1.4. Rubber
- 5.1.5. Paints and Coatings
- 5.1.6. Other Applications
- 5.2. Market Analysis, Insights and Forecast - by Region
- 5.2.1. Asia Pacific
- 5.2.2. North America
- 5.2.3. Europe
- 5.2.4. South America
- 5.2.5. Middle East and Africa
- 5.1. Market Analysis, Insights and Forecast - by Application
- 6. Global Gum Rosin Industry Analysis, Insights and Forecast, 2021-2033
- 6.1. Market Analysis, Insights and Forecast - by Application
- 6.1.1. Paper Sizing
- 6.1.2. Printing Ink
- 6.1.3. Adhesives and Sealants
- 6.1.4. Rubber
- 6.1.5. Paints and Coatings
- 6.1.6. Other Applications
- 6.1. Market Analysis, Insights and Forecast - by Application
- 7. Asia Pacific Gum Rosin Industry Analysis, Insights and Forecast, 2020-2032
- 7.1. Market Analysis, Insights and Forecast - by Application
- 7.1.1. Paper Sizing
- 7.1.2. Printing Ink
- 7.1.3. Adhesives and Sealants
- 7.1.4. Rubber
- 7.1.5. Paints and Coatings
- 7.1.6. Other Applications
- 7.1. Market Analysis, Insights and Forecast - by Application
- 8. North America Gum Rosin Industry Analysis, Insights and Forecast, 2020-2032
- 8.1. Market Analysis, Insights and Forecast - by Application
- 8.1.1. Paper Sizing
- 8.1.2. Printing Ink
- 8.1.3. Adhesives and Sealants
- 8.1.4. Rubber
- 8.1.5. Paints and Coatings
- 8.1.6. Other Applications
- 8.1. Market Analysis, Insights and Forecast - by Application
- 9. Europe Gum Rosin Industry Analysis, Insights and Forecast, 2020-2032
- 9.1. Market Analysis, Insights and Forecast - by Application
- 9.1.1. Paper Sizing
- 9.1.2. Printing Ink
- 9.1.3. Adhesives and Sealants
- 9.1.4. Rubber
- 9.1.5. Paints and Coatings
- 9.1.6. Other Applications
- 9.1. Market Analysis, Insights and Forecast - by Application
- 10. South America Gum Rosin Industry Analysis, Insights and Forecast, 2020-2032
- 10.1. Market Analysis, Insights and Forecast - by Application
- 10.1.1. Paper Sizing
- 10.1.2. Printing Ink
- 10.1.3. Adhesives and Sealants
- 10.1.4. Rubber
- 10.1.5. Paints and Coatings
- 10.1.6. Other Applications
- 10.1. Market Analysis, Insights and Forecast - by Application
- 11. Middle East and Africa Gum Rosin Industry Analysis, Insights and Forecast, 2020-2032
- 11.1. Market Analysis, Insights and Forecast - by Application
- 11.1.1. Paper Sizing
- 11.1.2. Printing Ink
- 11.1.3. Adhesives and Sealants
- 11.1.4. Rubber
- 11.1.5. Paints and Coatings
- 11.1.6. Other Applications
- 11.1. Market Analysis, Insights and Forecast - by Application
- 12. Competitive Analysis
- 12.1. Company Profiles
- 12.1.1 Forestar Chemical Co Ltd
- 12.1.1.1. Company Overview
- 12.1.1.2. Products
- 12.1.1.3. Company Financials
- 12.1.1.4. SWOT Analysis
- 12.1.2 Wuzhou Sun Shine Forestry and Chemicals Co Ltd *List Not Exhaustive
- 12.1.2.1. Company Overview
- 12.1.2.2. Products
- 12.1.2.3. Company Financials
- 12.1.2.4. SWOT Analysis
- 12.1.3 Novotrade Invest AS
- 12.1.3.1. Company Overview
- 12.1.3.2. Products
- 12.1.3.3. Company Financials
- 12.1.3.4. SWOT Analysis
- 12.1.4 KH Chemicals
- 12.1.4.1. Company Overview
- 12.1.4.2. Products
- 12.1.4.3. Company Financials
- 12.1.4.4. SWOT Analysis
- 12.1.5 Kemipex
- 12.1.5.1. Company Overview
- 12.1.5.2. Products
- 12.1.5.3. Company Financials
- 12.1.5.4. SWOT Analysis
- 12.1.6 PT INDOPICRI ( Indonesia Pine Chemical Industri )
- 12.1.6.1. Company Overview
- 12.1.6.2. Products
- 12.1.6.3. Company Financials
- 12.1.6.4. SWOT Analysis
- 12.1.7 Harima Chemicals Group Inc
- 12.1.7.1. Company Overview
- 12.1.7.2. Products
- 12.1.7.3. Company Financials
- 12.1.7.4. SWOT Analysis
- 12.1.8 Guangxi Dinghong Resin Co Ltd
- 12.1.8.1. Company Overview
- 12.1.8.2. Products
- 12.1.8.3. Company Financials
- 12.1.8.4. SWOT Analysis
- 12.1.9 Finjetchemical Co Ltd
- 12.1.9.1. Company Overview
- 12.1.9.2. Products
- 12.1.9.3. Company Financials
- 12.1.9.4. SWOT Analysis
- 12.1.10 Silver Fern Chemical Inc
- 12.1.10.1. Company Overview
- 12.1.10.2. Products
- 12.1.10.3. Company Financials
- 12.1.10.4. SWOT Analysis
- 12.1.11 Guangxi Tone Resin Chemical Co Ltd
- 12.1.11.1. Company Overview
- 12.1.11.2. Products
- 12.1.11.3. Company Financials
- 12.1.11.4. SWOT Analysis
- 12.1.12 United Resins
- 12.1.12.1. Company Overview
- 12.1.12.2. Products
- 12.1.12.3. Company Financials
- 12.1.12.4. SWOT Analysis
- 12.1.13 Foreverest Resources Ltd
- 12.1.13.1. Company Overview
- 12.1.13.2. Products
- 12.1.13.3. Company Financials
- 12.1.13.4. SWOT Analysis
- 12.1.14 Arakawa Chemical Industries Ltd
- 12.1.14.1. Company Overview
- 12.1.14.2. Products
- 12.1.14.3. Company Financials
- 12.1.14.4. SWOT Analysis
- 12.1.15 DRT (Dérivés Résiniques et Terpéniques)
- 12.1.15.1. Company Overview
- 12.1.15.2. Products
- 12.1.15.3. Company Financials
- 12.1.15.4. SWOT Analysis
- 12.1.1 Forestar Chemical Co Ltd
- 12.2. Market Entropy
- 12.2.1 Company's Key Areas Served
- 12.2.2 Recent Developments
- 12.3. Company Market Share Analysis 2025
- 12.3.1 Top 5 Companies Market Share Analysis
- 12.3.2 Top 3 Companies Market Share Analysis
- 12.4. List of Potential Customers
- 13. Research Methodology
List of Figures
- Figure 1: Global Gum Rosin Industry Revenue Breakdown (million, %) by Region 2025 & 2033
- Figure 2: Global Gum Rosin Industry Volume Breakdown (K Tons, %) by Region 2025 & 2033
- Figure 3: Asia Pacific Gum Rosin Industry Revenue (million), by Application 2025 & 2033
- Figure 4: Asia Pacific Gum Rosin Industry Volume (K Tons), by Application 2025 & 2033
- Figure 5: Asia Pacific Gum Rosin Industry Revenue Share (%), by Application 2025 & 2033
- Figure 6: Asia Pacific Gum Rosin Industry Volume Share (%), by Application 2025 & 2033
- Figure 7: Asia Pacific Gum Rosin Industry Revenue (million), by Country 2025 & 2033
- Figure 8: Asia Pacific Gum Rosin Industry Volume (K Tons), by Country 2025 & 2033
- Figure 9: Asia Pacific Gum Rosin Industry Revenue Share (%), by Country 2025 & 2033
- Figure 10: Asia Pacific Gum Rosin Industry Volume Share (%), by Country 2025 & 2033
- Figure 11: North America Gum Rosin Industry Revenue (million), by Application 2025 & 2033
- Figure 12: North America Gum Rosin Industry Volume (K Tons), by Application 2025 & 2033
- Figure 13: North America Gum Rosin Industry Revenue Share (%), by Application 2025 & 2033
- Figure 14: North America Gum Rosin Industry Volume Share (%), by Application 2025 & 2033
- Figure 15: North America Gum Rosin Industry Revenue (million), by Country 2025 & 2033
- Figure 16: North America Gum Rosin Industry Volume (K Tons), by Country 2025 & 2033
- Figure 17: North America Gum Rosin Industry Revenue Share (%), by Country 2025 & 2033
- Figure 18: North America Gum Rosin Industry Volume Share (%), by Country 2025 & 2033
- Figure 19: Europe Gum Rosin Industry Revenue (million), by Application 2025 & 2033
- Figure 20: Europe Gum Rosin Industry Volume (K Tons), by Application 2025 & 2033
- Figure 21: Europe Gum Rosin Industry Revenue Share (%), by Application 2025 & 2033
- Figure 22: Europe Gum Rosin Industry Volume Share (%), by Application 2025 & 2033
- Figure 23: Europe Gum Rosin Industry Revenue (million), by Country 2025 & 2033
- Figure 24: Europe Gum Rosin Industry Volume (K Tons), by Country 2025 & 2033
- Figure 25: Europe Gum Rosin Industry Revenue Share (%), by Country 2025 & 2033
- Figure 26: Europe Gum Rosin Industry Volume Share (%), by Country 2025 & 2033
- Figure 27: South America Gum Rosin Industry Revenue (million), by Application 2025 & 2033
- Figure 28: South America Gum Rosin Industry Volume (K Tons), by Application 2025 & 2033
- Figure 29: South America Gum Rosin Industry Revenue Share (%), by Application 2025 & 2033
- Figure 30: South America Gum Rosin Industry Volume Share (%), by Application 2025 & 2033
- Figure 31: South America Gum Rosin Industry Revenue (million), by Country 2025 & 2033
- Figure 32: South America Gum Rosin Industry Volume (K Tons), by Country 2025 & 2033
- Figure 33: South America Gum Rosin Industry Revenue Share (%), by Country 2025 & 2033
- Figure 34: South America Gum Rosin Industry Volume Share (%), by Country 2025 & 2033
- Figure 35: Middle East and Africa Gum Rosin Industry Revenue (million), by Application 2025 & 2033
- Figure 36: Middle East and Africa Gum Rosin Industry Volume (K Tons), by Application 2025 & 2033
- Figure 37: Middle East and Africa Gum Rosin Industry Revenue Share (%), by Application 2025 & 2033
- Figure 38: Middle East and Africa Gum Rosin Industry Volume Share (%), by Application 2025 & 2033
- Figure 39: Middle East and Africa Gum Rosin Industry Revenue (million), by Country 2025 & 2033
- Figure 40: Middle East and Africa Gum Rosin Industry Volume (K Tons), by Country 2025 & 2033
- Figure 41: Middle East and Africa Gum Rosin Industry Revenue Share (%), by Country 2025 & 2033
- Figure 42: Middle East and Africa Gum Rosin Industry Volume Share (%), by Country 2025 & 2033
List of Tables
- Table 1: Global Gum Rosin Industry Revenue million Forecast, by Application 2020 & 2033
- Table 2: Global Gum Rosin Industry Volume K Tons Forecast, by Application 2020 & 2033
- Table 3: Global Gum Rosin Industry Revenue million Forecast, by Region 2020 & 2033
- Table 4: Global Gum Rosin Industry Volume K Tons Forecast, by Region 2020 & 2033
- Table 5: Global Gum Rosin Industry Revenue million Forecast, by Application 2020 & 2033
- Table 6: Global Gum Rosin Industry Volume K Tons Forecast, by Application 2020 & 2033
- Table 7: Global Gum Rosin Industry Revenue million Forecast, by Country 2020 & 2033
- Table 8: Global Gum Rosin Industry Volume K Tons Forecast, by Country 2020 & 2033
- Table 9: China Gum Rosin Industry Revenue (million) Forecast, by Application 2020 & 2033
- Table 10: China Gum Rosin Industry Volume (K Tons) Forecast, by Application 2020 & 2033
- Table 11: India Gum Rosin Industry Revenue (million) Forecast, by Application 2020 & 2033
- Table 12: India Gum Rosin Industry Volume (K Tons) Forecast, by Application 2020 & 2033
- Table 13: Japan Gum Rosin Industry Revenue (million) Forecast, by Application 2020 & 2033
- Table 14: Japan Gum Rosin Industry Volume (K Tons) Forecast, by Application 2020 & 2033
- Table 15: South Korea Gum Rosin Industry Revenue (million) Forecast, by Application 2020 & 2033
- Table 16: South Korea Gum Rosin Industry Volume (K Tons) Forecast, by Application 2020 & 2033
- Table 17: Rest of Asia Pacific Gum Rosin Industry Revenue (million) Forecast, by Application 2020 & 2033
- Table 18: Rest of Asia Pacific Gum Rosin Industry Volume (K Tons) Forecast, by Application 2020 & 2033
- Table 19: Global Gum Rosin Industry Revenue million Forecast, by Application 2020 & 2033
- Table 20: Global Gum Rosin Industry Volume K Tons Forecast, by Application 2020 & 2033
- Table 21: Global Gum Rosin Industry Revenue million Forecast, by Country 2020 & 2033
- Table 22: Global Gum Rosin Industry Volume K Tons Forecast, by Country 2020 & 2033
- Table 23: United States Gum Rosin Industry Revenue (million) Forecast, by Application 2020 & 2033
- Table 24: United States Gum Rosin Industry Volume (K Tons) Forecast, by Application 2020 & 2033
- Table 25: Canada Gum Rosin Industry Revenue (million) Forecast, by Application 2020 & 2033
- Table 26: Canada Gum Rosin Industry Volume (K Tons) Forecast, by Application 2020 & 2033
- Table 27: Mexico Gum Rosin Industry Revenue (million) Forecast, by Application 2020 & 2033
- Table 28: Mexico Gum Rosin Industry Volume (K Tons) Forecast, by Application 2020 & 2033
- Table 29: Global Gum Rosin Industry Revenue million Forecast, by Application 2020 & 2033
- Table 30: Global Gum Rosin Industry Volume K Tons Forecast, by Application 2020 & 2033
- Table 31: Global Gum Rosin Industry Revenue million Forecast, by Country 2020 & 2033
- Table 32: Global Gum Rosin Industry Volume K Tons Forecast, by Country 2020 & 2033
- Table 33: Germany Gum Rosin Industry Revenue (million) Forecast, by Application 2020 & 2033
- Table 34: Germany Gum Rosin Industry Volume (K Tons) Forecast, by Application 2020 & 2033
- Table 35: United Kingdom Gum Rosin Industry Revenue (million) Forecast, by Application 2020 & 2033
- Table 36: United Kingdom Gum Rosin Industry Volume (K Tons) Forecast, by Application 2020 & 2033
- Table 37: Italy Gum Rosin Industry Revenue (million) Forecast, by Application 2020 & 2033
- Table 38: Italy Gum Rosin Industry Volume (K Tons) Forecast, by Application 2020 & 2033
- Table 39: France Gum Rosin Industry Revenue (million) Forecast, by Application 2020 & 2033
- Table 40: France Gum Rosin Industry Volume (K Tons) Forecast, by Application 2020 & 2033
- Table 41: Rest of Europe Gum Rosin Industry Revenue (million) Forecast, by Application 2020 & 2033
- Table 42: Rest of Europe Gum Rosin Industry Volume (K Tons) Forecast, by Application 2020 & 2033
- Table 43: Global Gum Rosin Industry Revenue million Forecast, by Application 2020 & 2033
- Table 44: Global Gum Rosin Industry Volume K Tons Forecast, by Application 2020 & 2033
- Table 45: Global Gum Rosin Industry Revenue million Forecast, by Country 2020 & 2033
- Table 46: Global Gum Rosin Industry Volume K Tons Forecast, by Country 2020 & 2033
- Table 47: Brazil Gum Rosin Industry Revenue (million) Forecast, by Application 2020 & 2033
- Table 48: Brazil Gum Rosin Industry Volume (K Tons) Forecast, by Application 2020 & 2033
- Table 49: Argentina Gum Rosin Industry Revenue (million) Forecast, by Application 2020 & 2033
- Table 50: Argentina Gum Rosin Industry Volume (K Tons) Forecast, by Application 2020 & 2033
- Table 51: Rest of South America Gum Rosin Industry Revenue (million) Forecast, by Application 2020 & 2033
- Table 52: Rest of South America Gum Rosin Industry Volume (K Tons) Forecast, by Application 2020 & 2033
- Table 53: Global Gum Rosin Industry Revenue million Forecast, by Application 2020 & 2033
- Table 54: Global Gum Rosin Industry Volume K Tons Forecast, by Application 2020 & 2033
- Table 55: Global Gum Rosin Industry Revenue million Forecast, by Country 2020 & 2033
- Table 56: Global Gum Rosin Industry Volume K Tons Forecast, by Country 2020 & 2033
- Table 57: Saudi Arabia Gum Rosin Industry Revenue (million) Forecast, by Application 2020 & 2033
- Table 58: Saudi Arabia Gum Rosin Industry Volume (K Tons) Forecast, by Application 2020 & 2033
- Table 59: South Africa Gum Rosin Industry Revenue (million) Forecast, by Application 2020 & 2033
- Table 60: South Africa Gum Rosin Industry Volume (K Tons) Forecast, by Application 2020 & 2033
- Table 61: Rest of Middle East and Africa Gum Rosin Industry Revenue (million) Forecast, by Application 2020 & 2033
- Table 62: Rest of Middle East and Africa Gum Rosin Industry Volume (K Tons) Forecast, by Application 2020 & 2033
Frequently Asked Questions
1. What is the projected Compound Annual Growth Rate (CAGR) of the Gum Rosin Industry?
The projected CAGR is approximately 4.4%.
2. Which companies are prominent players in the Gum Rosin Industry?
Key companies in the market include Forestar Chemical Co Ltd, Wuzhou Sun Shine Forestry and Chemicals Co Ltd *List Not Exhaustive, Novotrade Invest AS, KH Chemicals, Kemipex, PT INDOPICRI ( Indonesia Pine Chemical Industri ), Harima Chemicals Group Inc, Guangxi Dinghong Resin Co Ltd, Finjetchemical Co Ltd, Silver Fern Chemical Inc, Guangxi Tone Resin Chemical Co Ltd, United Resins, Foreverest Resources Ltd, Arakawa Chemical Industries Ltd, DRT (Dérivés Résiniques et Terpéniques).
3. What are the main segments of the Gum Rosin Industry?
The market segments include Application.
4. Can you provide details about the market size?
The market size is estimated to be USD 2632.6 million as of 2022.
5. What are some drivers contributing to market growth?
Growing Demand for Bio-based Adhesives and Sealants; Burgeoning Paper Packaging Industry; Other Drivers.
6. What are the notable trends driving market growth?
The Adhesives and Sealants Segment is Expected to Dominate the Market.
7. Are there any restraints impacting market growth?
Shift of Interest toward Tall Oil Rosin-based Phenolic Resins; Other Restraints.
8. Can you provide examples of recent developments in the market?
N/A
9. What pricing options are available for accessing the report?
Pricing options include single-user, multi-user, and enterprise licenses priced at USD 4750, USD 5250, and USD 8750 respectively.
10. Is the market size provided in terms of value or volume?
The market size is provided in terms of value, measured in million and volume, measured in K Tons.
11. Are there any specific market keywords associated with the report?
Yes, the market keyword associated with the report is "Gum Rosin Industry," which aids in identifying and referencing the specific market segment covered.
12. How do I determine which pricing option suits my needs best?
The pricing options vary based on user requirements and access needs. Individual users may opt for single-user licenses, while businesses requiring broader access may choose multi-user or enterprise licenses for cost-effective access to the report.
13. Are there any additional resources or data provided in the Gum Rosin Industry report?
While the report offers comprehensive insights, it's advisable to review the specific contents or supplementary materials provided to ascertain if additional resources or data are available.
14. How can I stay updated on further developments or reports in the Gum Rosin Industry?
To stay informed about further developments, trends, and reports in the Gum Rosin Industry, consider subscribing to industry newsletters, following relevant companies and organizations, or regularly checking reputable industry news sources and publications.
Methodology
Step 1 - Identification of Relevant Samples Size from Population Database


Step 2 - Approaches for Defining Global Market Size (Value, Volume* & Price*)

Note*: In applicable scenarios
Step 3 - Data Sources
Primary Research
- Web Analytics
- Survey Reports
- Research Institute
- Latest Research Reports
- Opinion Leaders
Secondary Research
- Annual Reports
- White Paper
- Latest Press Release
- Industry Association
- Paid Database
- Investor Presentations

Step 4 - Data Triangulation
Involves using different sources of information in order to increase the validity of a study
These sources are likely to be stakeholders in a program - participants, other researchers, program staff, other community members, and so on.
Then we put all data in single framework & apply various statistical tools to find out the dynamic on the market.
During the analysis stage, feedback from the stakeholder groups would be compared to determine areas of agreement as well as areas of divergence