
Key Insights
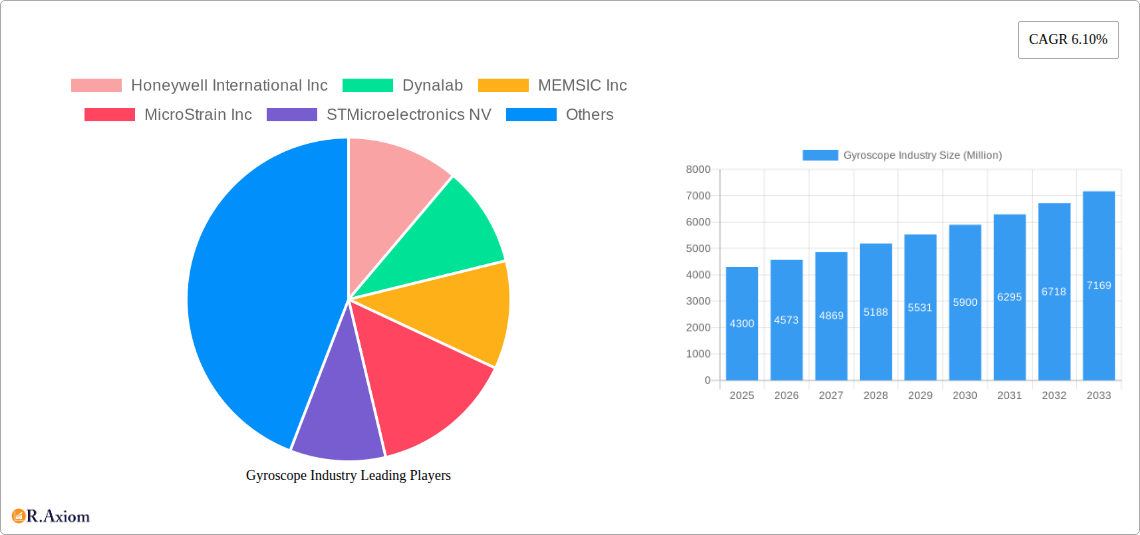
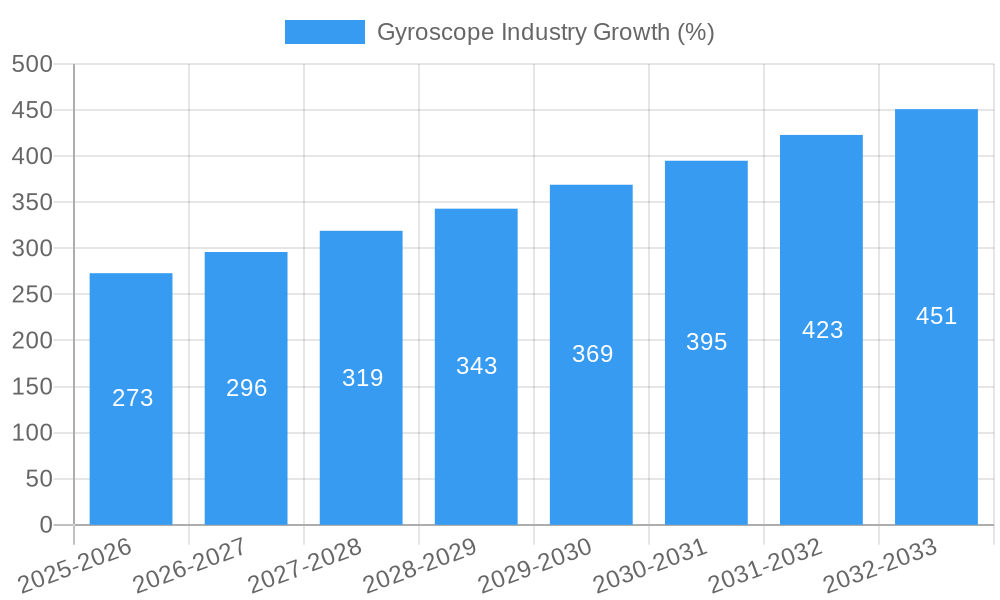
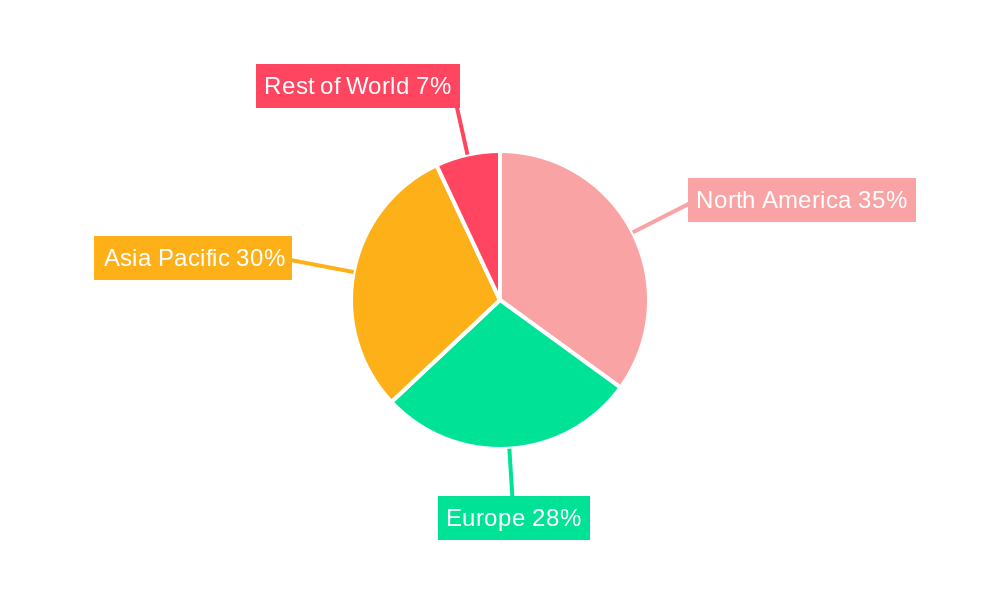
The global gyroscope market, valued at $4.30 billion in 2025, is projected to experience robust growth, driven by increasing demand across diverse sectors. A Compound Annual Growth Rate (CAGR) of 6.10% from 2025 to 2033 indicates a significant expansion, primarily fueled by the escalating adoption of advanced driver-assistance systems (ADAS) in the automotive industry and the continuous growth of the aerospace and defense sectors. The miniaturization of gyroscopes, particularly MEMS gyroscopes, is lowering production costs and enabling integration into smaller devices, thus expanding their applications in consumer electronics, such as smartphones and wearables. Furthermore, the rising need for precise navigation and positioning systems in industrial automation and robotics is contributing significantly to market expansion. While challenges like technological limitations in certain gyroscope types and the need for improved accuracy in specific applications exist, the overall market outlook remains positive, driven by continuous technological advancements and increasing demand across various sectors. The market segmentation reveals a dominance of MEMS gyroscopes due to their cost-effectiveness and widespread applicability. However, FOG, RLG, and HRG gyroscopes maintain a significant presence in high-precision applications, particularly within aerospace and defense. North America and Asia Pacific are expected to be key regional markets, driven by technological advancements and strong industrial growth in these regions.
The continued integration of gyroscope technology into emerging fields like Internet of Things (IoT) devices, drones, and autonomous vehicles will propel market growth. The focus on developing more energy-efficient and reliable gyroscopes is a key trend. Companies are actively investing in research and development to improve accuracy, miniaturize components, and enhance durability. Strategic partnerships and collaborations between gyroscope manufacturers and end-user industries are further strengthening the market. Despite potential competitive pressures and technological disruptions, the long-term outlook for the gyroscope market remains exceptionally promising, with substantial growth opportunities across various technological advancements and applications.
This comprehensive report provides a detailed analysis of the gyroscope industry, covering market size, segmentation, key players, technological advancements, and future growth prospects. The study period spans from 2019 to 2033, with 2025 as the base and estimated year. The report utilizes data from the historical period (2019-2024) to project market trends during the forecast period (2025-2033). It caters to industry stakeholders, investors, and researchers seeking actionable insights into this dynamic market. Key segments analyzed include MEMS Gyroscopes, Fiber Optic Gyroscopes (FOG), Ring Laser Gyroscopes (RLG), Hemispherical Resonating Gyroscopes (HRG), Dynamically Tuned Gyroscopes (DTG), and other technologies, across various end-user verticals like Consumer Electronics, Automotive, Aerospace & Defense, Industrial, Marine, and others. The report projects a market value of xx Million by 2033.
Gyroscope Industry Market Concentration & Innovation
The gyroscope industry exhibits a moderately concentrated market structure, with key players like Honeywell International Inc, Robert Bosch GmbH, and Analog Devices Inc holding significant market share. However, the presence of several smaller, specialized companies fosters innovation and competition. Market share distribution is dynamic, influenced by technological advancements and strategic acquisitions. The global market value was xx Million in 2024, projected to grow to xx Million in 2033, signifying significant potential.
- Market Concentration: The top 5 players account for approximately xx% of the global market.
- Innovation Drivers: Miniaturization, enhanced precision, lower power consumption, and integration with other sensors drive innovation.
- Regulatory Frameworks: Stringent safety and performance standards in sectors like aerospace and automotive influence gyroscope development.
- Product Substitutes: Technological advancements in alternative sensor technologies pose a subtle competitive threat.
- End-User Trends: The increasing demand for autonomous vehicles and drones fuels industry growth.
- M&A Activities: Consolidation through mergers and acquisitions is a common strategy to expand market reach and technology portfolios. Recent M&A deals have involved values ranging from xx Million to xx Million.
Gyroscope Industry Industry Trends & Insights
The gyroscope industry is experiencing robust growth, driven by several factors. The Compound Annual Growth Rate (CAGR) during the forecast period is estimated at xx%. This growth is fueled by increasing demand across diverse end-user sectors, especially in the automotive and aerospace and defense industries. The growing adoption of autonomous vehicles, drones, and robotics significantly boosts market penetration for high-precision gyroscopes. Technological disruptions, including the development of smaller, more efficient MEMS gyroscopes, continue to reshape the competitive landscape. Consumer preferences for advanced features in electronic devices further stimulate demand for gyroscopes. Competitive dynamics are intensifying, with companies focusing on product differentiation, technological innovation, and strategic partnerships. Market penetration in the automotive sector is projected to reach xx% by 2033.
Dominant Markets & Segments in Gyroscope Industry
The MEMS gyroscope segment dominates the market due to its cost-effectiveness, miniaturization potential, and widespread application across consumer electronics and automotive sectors. The aerospace and defense end-user vertical showcases the highest growth due to increased investments in defense modernization and the proliferation of autonomous systems.
- Leading Region/Country: North America and Asia currently hold the largest market share, driven by strong technological advancements and significant consumer electronics manufacturing.
Key Drivers (by Segment):
- MEMS Gyroscope: Cost-effectiveness, miniaturization, high volume production.
- FOG: High accuracy and stability demanded by aerospace and defense applications.
- RLG: Excellent performance in high-precision navigation systems.
- HRG: Superior accuracy and stability for strategic applications.
- DTG: Cost-effective option for some industrial applications.
- Consumer Electronics: Growth driven by smartphone penetration and wearable technology.
- Automotive: Autonomous driving and advanced driver-assistance systems (ADAS) propel market expansion.
- Aerospace & Defense: Stringent demands for precision and reliability fuel this segment's high growth.
Gyroscope Industry Product Developments
Recent product developments highlight the trend toward miniaturization and improved precision. Companies are focusing on integrating gyroscopes with other sensors to create sophisticated inertial measurement units (IMUs) for diverse applications. The emphasis on lower power consumption and enhanced reliability caters to emerging trends in portable electronics and autonomous systems. These developments are enhancing the market fit of gyroscopes across various industries.
Report Scope & Segmentation Analysis
This report segments the gyroscope market by technology (MEMS, FOG, RLG, HRG, DTG, Others) and end-user vertical (Consumer Electronics, Automotive, Aerospace & Defense, Industrial, Marine, Others). Each segment's growth projections, market sizes, and competitive dynamics are analyzed individually. The MEMS gyroscope segment is projected to maintain its dominance, while the automotive and aerospace & defense sectors drive significant growth across end-user verticals.
Key Drivers of Gyroscope Industry Growth
The gyroscope industry's growth is propelled by several key factors, including:
- Technological advancements: Miniaturization, improved accuracy, and lower power consumption.
- Economic growth: Increased spending on consumer electronics, autonomous vehicles, and defense systems.
- Regulatory factors: Stringent safety regulations in key industries like aerospace and automotive.
Challenges in the Gyroscope Industry Sector
Despite promising growth prospects, several challenges exist:
- Intense competition: Established players and emerging companies compete fiercely, affecting profitability.
- Supply chain disruptions: Global events and geopolitical factors can impact component availability.
- Technological obsolescence: Rapid technological changes require continuous innovation to stay competitive.
Emerging Opportunities in Gyroscope Industry
Several emerging opportunities exist:
- Expansion into new applications: Growth in robotics, augmented reality (AR), and virtual reality (VR).
- Development of advanced sensor fusion technologies: Integration with GPS, accelerometers, and other sensors.
- Growth in developing economies: Expanding markets offer substantial growth potential.
Leading Players in the Gyroscope Industry Market
- Honeywell International Inc
- Dynalab
- MEMSIC Inc
- MicroStrain Inc
- STMicroelectronics NV
- Robert Bosch GmbH
- InnaLabs
- Murata Manufacturing Co Ltd
- Analog Devices Inc
- EMCORE Corporation
- Vectornav Technologies LLC
Key Developments in Gyroscope Industry Industry
- October 2023: Honeywell launched the HGuide i400 IMU, setting a new standard for compact precision in defense, industrial, and autonomous applications.
- September 2023: EMCORE introduced the TAC-440 MEMS IMU, the world's smallest 1°/hour IMU, replacing Honeywell's 1930 and 4930 IMUs.
Strategic Outlook for Gyroscope Industry Market
The gyroscope industry is poised for continued growth, driven by technological advancements, increasing demand across diverse sectors, and the emergence of new applications. The focus on miniaturization, improved accuracy, and enhanced integration with other sensors will shape future market dynamics. Opportunities exist in developing advanced sensor fusion technologies and expanding into new markets, such as robotics and wearable technology, ensuring sustained growth for years to come.
Gyroscope Industry Segmentation
-
1. Technology
- 1.1. MEMS Gyroscope
- 1.2. Fiber Optic Gyroscope (FOG)
- 1.3. Ring Laser Gyroscope (RLG)
- 1.4. Hemispherical Resonating Gyroscope (HRG)
- 1.5. Dynamically Tuned Gyroscopes (DTG)
- 1.6. Other Technologies
-
2. End-user Vertical
- 2.1. Consumer Electronics
- 2.2. Automotive
- 2.3. Aerospace and Defense
- 2.4. Industrial
- 2.5. Marine
- 2.6. Other End-user Verticals
Gyroscope Industry Segmentation By Geography
-
1. North America
- 1.1. United States
- 1.2. Canada
-
2. Europe
- 2.1. Germany
- 2.2. United Kingdom
- 2.3. France
-
3. Asia
- 3.1. China
- 3.2. Japan
- 3.3. India
- 4. Australia and New Zealand
- 5. Latin America
- 6. Middle East and Africa
Gyroscope Industry REPORT HIGHLIGHTS
| Aspects | Details |
|---|---|
| Study Period | 2019-2033 |
| Base Year | 2024 |
| Estimated Year | 2025 |
| Forecast Period | 2025-2033 |
| Historical Period | 2019-2024 |
| Growth Rate | CAGR of 6.10% from 2019-2033 |
| Segmentation |
|
Table of Contents
- 1. Introduction
- 1.1. Research Scope
- 1.2. Market Segmentation
- 1.3. Research Methodology
- 1.4. Definitions and Assumptions
- 2. Executive Summary
- 2.1. Introduction
- 3. Market Dynamics
- 3.1. Introduction
- 3.2. Market Drivers
- 3.2.1. Rapid Rise of Unmanned Vehicle in Both Defense and Civilian Applications; Technological Advancements Enabling More Effective Components at a Smaller and Lighter Size
- 3.3. Market Restrains
- 3.3.1. Substantial Increase in Complexity Challenging the Market Demand
- 3.4. Market Trends
- 3.4.1. Automotive to be the Fastest Growing End-user Vertical
- 4. Market Factor Analysis
- 4.1. Porters Five Forces
- 4.2. Supply/Value Chain
- 4.3. PESTEL analysis
- 4.4. Market Entropy
- 4.5. Patent/Trademark Analysis
- 5. Global Gyroscope Industry Analysis, Insights and Forecast, 2019-2031
- 5.1. Market Analysis, Insights and Forecast - by Technology
- 5.1.1. MEMS Gyroscope
- 5.1.2. Fiber Optic Gyroscope (FOG)
- 5.1.3. Ring Laser Gyroscope (RLG)
- 5.1.4. Hemispherical Resonating Gyroscope (HRG)
- 5.1.5. Dynamically Tuned Gyroscopes (DTG)
- 5.1.6. Other Technologies
- 5.2. Market Analysis, Insights and Forecast - by End-user Vertical
- 5.2.1. Consumer Electronics
- 5.2.2. Automotive
- 5.2.3. Aerospace and Defense
- 5.2.4. Industrial
- 5.2.5. Marine
- 5.2.6. Other End-user Verticals
- 5.3. Market Analysis, Insights and Forecast - by Region
- 5.3.1. North America
- 5.3.2. Europe
- 5.3.3. Asia
- 5.3.4. Australia and New Zealand
- 5.3.5. Latin America
- 5.3.6. Middle East and Africa
- 5.1. Market Analysis, Insights and Forecast - by Technology
- 6. North America Gyroscope Industry Analysis, Insights and Forecast, 2019-2031
- 6.1. Market Analysis, Insights and Forecast - by Technology
- 6.1.1. MEMS Gyroscope
- 6.1.2. Fiber Optic Gyroscope (FOG)
- 6.1.3. Ring Laser Gyroscope (RLG)
- 6.1.4. Hemispherical Resonating Gyroscope (HRG)
- 6.1.5. Dynamically Tuned Gyroscopes (DTG)
- 6.1.6. Other Technologies
- 6.2. Market Analysis, Insights and Forecast - by End-user Vertical
- 6.2.1. Consumer Electronics
- 6.2.2. Automotive
- 6.2.3. Aerospace and Defense
- 6.2.4. Industrial
- 6.2.5. Marine
- 6.2.6. Other End-user Verticals
- 6.1. Market Analysis, Insights and Forecast - by Technology
- 7. Europe Gyroscope Industry Analysis, Insights and Forecast, 2019-2031
- 7.1. Market Analysis, Insights and Forecast - by Technology
- 7.1.1. MEMS Gyroscope
- 7.1.2. Fiber Optic Gyroscope (FOG)
- 7.1.3. Ring Laser Gyroscope (RLG)
- 7.1.4. Hemispherical Resonating Gyroscope (HRG)
- 7.1.5. Dynamically Tuned Gyroscopes (DTG)
- 7.1.6. Other Technologies
- 7.2. Market Analysis, Insights and Forecast - by End-user Vertical
- 7.2.1. Consumer Electronics
- 7.2.2. Automotive
- 7.2.3. Aerospace and Defense
- 7.2.4. Industrial
- 7.2.5. Marine
- 7.2.6. Other End-user Verticals
- 7.1. Market Analysis, Insights and Forecast - by Technology
- 8. Asia Gyroscope Industry Analysis, Insights and Forecast, 2019-2031
- 8.1. Market Analysis, Insights and Forecast - by Technology
- 8.1.1. MEMS Gyroscope
- 8.1.2. Fiber Optic Gyroscope (FOG)
- 8.1.3. Ring Laser Gyroscope (RLG)
- 8.1.4. Hemispherical Resonating Gyroscope (HRG)
- 8.1.5. Dynamically Tuned Gyroscopes (DTG)
- 8.1.6. Other Technologies
- 8.2. Market Analysis, Insights and Forecast - by End-user Vertical
- 8.2.1. Consumer Electronics
- 8.2.2. Automotive
- 8.2.3. Aerospace and Defense
- 8.2.4. Industrial
- 8.2.5. Marine
- 8.2.6. Other End-user Verticals
- 8.1. Market Analysis, Insights and Forecast - by Technology
- 9. Australia and New Zealand Gyroscope Industry Analysis, Insights and Forecast, 2019-2031
- 9.1. Market Analysis, Insights and Forecast - by Technology
- 9.1.1. MEMS Gyroscope
- 9.1.2. Fiber Optic Gyroscope (FOG)
- 9.1.3. Ring Laser Gyroscope (RLG)
- 9.1.4. Hemispherical Resonating Gyroscope (HRG)
- 9.1.5. Dynamically Tuned Gyroscopes (DTG)
- 9.1.6. Other Technologies
- 9.2. Market Analysis, Insights and Forecast - by End-user Vertical
- 9.2.1. Consumer Electronics
- 9.2.2. Automotive
- 9.2.3. Aerospace and Defense
- 9.2.4. Industrial
- 9.2.5. Marine
- 9.2.6. Other End-user Verticals
- 9.1. Market Analysis, Insights and Forecast - by Technology
- 10. Latin America Gyroscope Industry Analysis, Insights and Forecast, 2019-2031
- 10.1. Market Analysis, Insights and Forecast - by Technology
- 10.1.1. MEMS Gyroscope
- 10.1.2. Fiber Optic Gyroscope (FOG)
- 10.1.3. Ring Laser Gyroscope (RLG)
- 10.1.4. Hemispherical Resonating Gyroscope (HRG)
- 10.1.5. Dynamically Tuned Gyroscopes (DTG)
- 10.1.6. Other Technologies
- 10.2. Market Analysis, Insights and Forecast - by End-user Vertical
- 10.2.1. Consumer Electronics
- 10.2.2. Automotive
- 10.2.3. Aerospace and Defense
- 10.2.4. Industrial
- 10.2.5. Marine
- 10.2.6. Other End-user Verticals
- 10.1. Market Analysis, Insights and Forecast - by Technology
- 11. Middle East and Africa Gyroscope Industry Analysis, Insights and Forecast, 2019-2031
- 11.1. Market Analysis, Insights and Forecast - by Technology
- 11.1.1. MEMS Gyroscope
- 11.1.2. Fiber Optic Gyroscope (FOG)
- 11.1.3. Ring Laser Gyroscope (RLG)
- 11.1.4. Hemispherical Resonating Gyroscope (HRG)
- 11.1.5. Dynamically Tuned Gyroscopes (DTG)
- 11.1.6. Other Technologies
- 11.2. Market Analysis, Insights and Forecast - by End-user Vertical
- 11.2.1. Consumer Electronics
- 11.2.2. Automotive
- 11.2.3. Aerospace and Defense
- 11.2.4. Industrial
- 11.2.5. Marine
- 11.2.6. Other End-user Verticals
- 11.1. Market Analysis, Insights and Forecast - by Technology
- 12. North America Gyroscope Industry Analysis, Insights and Forecast, 2019-2031
- 12.1. Market Analysis, Insights and Forecast - By Country/Sub-region
- 12.1.1 United States
- 12.1.2 Canada
- 13. Europe Gyroscope Industry Analysis, Insights and Forecast, 2019-2031
- 13.1. Market Analysis, Insights and Forecast - By Country/Sub-region
- 13.1.1 Germany
- 13.1.2 United Kingdom
- 13.1.3 France
- 13.1.4 Rest of Europe
- 14. Asia Pacific Gyroscope Industry Analysis, Insights and Forecast, 2019-2031
- 14.1. Market Analysis, Insights and Forecast - By Country/Sub-region
- 14.1.1 China
- 14.1.2 Japan
- 14.1.3 India
- 14.1.4 Rest of Asia Pacific
- 15. Rest of the World Gyroscope Industry Analysis, Insights and Forecast, 2019-2031
- 15.1. Market Analysis, Insights and Forecast - By Country/Sub-region
- 15.1.1.
- 16. Competitive Analysis
- 16.1. Global Market Share Analysis 2024
- 16.2. Company Profiles
- 16.2.1 Honeywell International Inc
- 16.2.1.1. Overview
- 16.2.1.2. Products
- 16.2.1.3. SWOT Analysis
- 16.2.1.4. Recent Developments
- 16.2.1.5. Financials (Based on Availability)
- 16.2.2 Dynalab
- 16.2.2.1. Overview
- 16.2.2.2. Products
- 16.2.2.3. SWOT Analysis
- 16.2.2.4. Recent Developments
- 16.2.2.5. Financials (Based on Availability)
- 16.2.3 MEMSIC Inc
- 16.2.3.1. Overview
- 16.2.3.2. Products
- 16.2.3.3. SWOT Analysis
- 16.2.3.4. Recent Developments
- 16.2.3.5. Financials (Based on Availability)
- 16.2.4 MicroStrain Inc
- 16.2.4.1. Overview
- 16.2.4.2. Products
- 16.2.4.3. SWOT Analysis
- 16.2.4.4. Recent Developments
- 16.2.4.5. Financials (Based on Availability)
- 16.2.5 STMicroelectronics NV
- 16.2.5.1. Overview
- 16.2.5.2. Products
- 16.2.5.3. SWOT Analysis
- 16.2.5.4. Recent Developments
- 16.2.5.5. Financials (Based on Availability)
- 16.2.6 Robert Bosch GmbH
- 16.2.6.1. Overview
- 16.2.6.2. Products
- 16.2.6.3. SWOT Analysis
- 16.2.6.4. Recent Developments
- 16.2.6.5. Financials (Based on Availability)
- 16.2.7 InnaLabs
- 16.2.7.1. Overview
- 16.2.7.2. Products
- 16.2.7.3. SWOT Analysis
- 16.2.7.4. Recent Developments
- 16.2.7.5. Financials (Based on Availability)
- 16.2.8 Murata Manufacturing Co Ltd
- 16.2.8.1. Overview
- 16.2.8.2. Products
- 16.2.8.3. SWOT Analysis
- 16.2.8.4. Recent Developments
- 16.2.8.5. Financials (Based on Availability)
- 16.2.9 Analog Devices Inc
- 16.2.9.1. Overview
- 16.2.9.2. Products
- 16.2.9.3. SWOT Analysis
- 16.2.9.4. Recent Developments
- 16.2.9.5. Financials (Based on Availability)
- 16.2.10 EMCORE Corporation
- 16.2.10.1. Overview
- 16.2.10.2. Products
- 16.2.10.3. SWOT Analysis
- 16.2.10.4. Recent Developments
- 16.2.10.5. Financials (Based on Availability)
- 16.2.11 Vectornav Technologies LLC
- 16.2.11.1. Overview
- 16.2.11.2. Products
- 16.2.11.3. SWOT Analysis
- 16.2.11.4. Recent Developments
- 16.2.11.5. Financials (Based on Availability)
- 16.2.1 Honeywell International Inc
List of Figures
- Figure 1: Global Gyroscope Industry Revenue Breakdown (Million, %) by Region 2024 & 2032
- Figure 2: North America Gyroscope Industry Revenue (Million), by Country 2024 & 2032
- Figure 3: North America Gyroscope Industry Revenue Share (%), by Country 2024 & 2032
- Figure 4: Europe Gyroscope Industry Revenue (Million), by Country 2024 & 2032
- Figure 5: Europe Gyroscope Industry Revenue Share (%), by Country 2024 & 2032
- Figure 6: Asia Pacific Gyroscope Industry Revenue (Million), by Country 2024 & 2032
- Figure 7: Asia Pacific Gyroscope Industry Revenue Share (%), by Country 2024 & 2032
- Figure 8: Rest of the World Gyroscope Industry Revenue (Million), by Country 2024 & 2032
- Figure 9: Rest of the World Gyroscope Industry Revenue Share (%), by Country 2024 & 2032
- Figure 10: North America Gyroscope Industry Revenue (Million), by Technology 2024 & 2032
- Figure 11: North America Gyroscope Industry Revenue Share (%), by Technology 2024 & 2032
- Figure 12: North America Gyroscope Industry Revenue (Million), by End-user Vertical 2024 & 2032
- Figure 13: North America Gyroscope Industry Revenue Share (%), by End-user Vertical 2024 & 2032
- Figure 14: North America Gyroscope Industry Revenue (Million), by Country 2024 & 2032
- Figure 15: North America Gyroscope Industry Revenue Share (%), by Country 2024 & 2032
- Figure 16: Europe Gyroscope Industry Revenue (Million), by Technology 2024 & 2032
- Figure 17: Europe Gyroscope Industry Revenue Share (%), by Technology 2024 & 2032
- Figure 18: Europe Gyroscope Industry Revenue (Million), by End-user Vertical 2024 & 2032
- Figure 19: Europe Gyroscope Industry Revenue Share (%), by End-user Vertical 2024 & 2032
- Figure 20: Europe Gyroscope Industry Revenue (Million), by Country 2024 & 2032
- Figure 21: Europe Gyroscope Industry Revenue Share (%), by Country 2024 & 2032
- Figure 22: Asia Gyroscope Industry Revenue (Million), by Technology 2024 & 2032
- Figure 23: Asia Gyroscope Industry Revenue Share (%), by Technology 2024 & 2032
- Figure 24: Asia Gyroscope Industry Revenue (Million), by End-user Vertical 2024 & 2032
- Figure 25: Asia Gyroscope Industry Revenue Share (%), by End-user Vertical 2024 & 2032
- Figure 26: Asia Gyroscope Industry Revenue (Million), by Country 2024 & 2032
- Figure 27: Asia Gyroscope Industry Revenue Share (%), by Country 2024 & 2032
- Figure 28: Australia and New Zealand Gyroscope Industry Revenue (Million), by Technology 2024 & 2032
- Figure 29: Australia and New Zealand Gyroscope Industry Revenue Share (%), by Technology 2024 & 2032
- Figure 30: Australia and New Zealand Gyroscope Industry Revenue (Million), by End-user Vertical 2024 & 2032
- Figure 31: Australia and New Zealand Gyroscope Industry Revenue Share (%), by End-user Vertical 2024 & 2032
- Figure 32: Australia and New Zealand Gyroscope Industry Revenue (Million), by Country 2024 & 2032
- Figure 33: Australia and New Zealand Gyroscope Industry Revenue Share (%), by Country 2024 & 2032
- Figure 34: Latin America Gyroscope Industry Revenue (Million), by Technology 2024 & 2032
- Figure 35: Latin America Gyroscope Industry Revenue Share (%), by Technology 2024 & 2032
- Figure 36: Latin America Gyroscope Industry Revenue (Million), by End-user Vertical 2024 & 2032
- Figure 37: Latin America Gyroscope Industry Revenue Share (%), by End-user Vertical 2024 & 2032
- Figure 38: Latin America Gyroscope Industry Revenue (Million), by Country 2024 & 2032
- Figure 39: Latin America Gyroscope Industry Revenue Share (%), by Country 2024 & 2032
- Figure 40: Middle East and Africa Gyroscope Industry Revenue (Million), by Technology 2024 & 2032
- Figure 41: Middle East and Africa Gyroscope Industry Revenue Share (%), by Technology 2024 & 2032
- Figure 42: Middle East and Africa Gyroscope Industry Revenue (Million), by End-user Vertical 2024 & 2032
- Figure 43: Middle East and Africa Gyroscope Industry Revenue Share (%), by End-user Vertical 2024 & 2032
- Figure 44: Middle East and Africa Gyroscope Industry Revenue (Million), by Country 2024 & 2032
- Figure 45: Middle East and Africa Gyroscope Industry Revenue Share (%), by Country 2024 & 2032
List of Tables
- Table 1: Global Gyroscope Industry Revenue Million Forecast, by Region 2019 & 2032
- Table 2: Global Gyroscope Industry Revenue Million Forecast, by Technology 2019 & 2032
- Table 3: Global Gyroscope Industry Revenue Million Forecast, by End-user Vertical 2019 & 2032
- Table 4: Global Gyroscope Industry Revenue Million Forecast, by Region 2019 & 2032
- Table 5: Global Gyroscope Industry Revenue Million Forecast, by Country 2019 & 2032
- Table 6: United States Gyroscope Industry Revenue (Million) Forecast, by Application 2019 & 2032
- Table 7: Canada Gyroscope Industry Revenue (Million) Forecast, by Application 2019 & 2032
- Table 8: Global Gyroscope Industry Revenue Million Forecast, by Country 2019 & 2032
- Table 9: Germany Gyroscope Industry Revenue (Million) Forecast, by Application 2019 & 2032
- Table 10: United Kingdom Gyroscope Industry Revenue (Million) Forecast, by Application 2019 & 2032
- Table 11: France Gyroscope Industry Revenue (Million) Forecast, by Application 2019 & 2032
- Table 12: Rest of Europe Gyroscope Industry Revenue (Million) Forecast, by Application 2019 & 2032
- Table 13: Global Gyroscope Industry Revenue Million Forecast, by Country 2019 & 2032
- Table 14: China Gyroscope Industry Revenue (Million) Forecast, by Application 2019 & 2032
- Table 15: Japan Gyroscope Industry Revenue (Million) Forecast, by Application 2019 & 2032
- Table 16: India Gyroscope Industry Revenue (Million) Forecast, by Application 2019 & 2032
- Table 17: Rest of Asia Pacific Gyroscope Industry Revenue (Million) Forecast, by Application 2019 & 2032
- Table 18: Global Gyroscope Industry Revenue Million Forecast, by Country 2019 & 2032
- Table 19: Gyroscope Industry Revenue (Million) Forecast, by Application 2019 & 2032
- Table 20: Global Gyroscope Industry Revenue Million Forecast, by Technology 2019 & 2032
- Table 21: Global Gyroscope Industry Revenue Million Forecast, by End-user Vertical 2019 & 2032
- Table 22: Global Gyroscope Industry Revenue Million Forecast, by Country 2019 & 2032
- Table 23: United States Gyroscope Industry Revenue (Million) Forecast, by Application 2019 & 2032
- Table 24: Canada Gyroscope Industry Revenue (Million) Forecast, by Application 2019 & 2032
- Table 25: Global Gyroscope Industry Revenue Million Forecast, by Technology 2019 & 2032
- Table 26: Global Gyroscope Industry Revenue Million Forecast, by End-user Vertical 2019 & 2032
- Table 27: Global Gyroscope Industry Revenue Million Forecast, by Country 2019 & 2032
- Table 28: Germany Gyroscope Industry Revenue (Million) Forecast, by Application 2019 & 2032
- Table 29: United Kingdom Gyroscope Industry Revenue (Million) Forecast, by Application 2019 & 2032
- Table 30: France Gyroscope Industry Revenue (Million) Forecast, by Application 2019 & 2032
- Table 31: Global Gyroscope Industry Revenue Million Forecast, by Technology 2019 & 2032
- Table 32: Global Gyroscope Industry Revenue Million Forecast, by End-user Vertical 2019 & 2032
- Table 33: Global Gyroscope Industry Revenue Million Forecast, by Country 2019 & 2032
- Table 34: China Gyroscope Industry Revenue (Million) Forecast, by Application 2019 & 2032
- Table 35: Japan Gyroscope Industry Revenue (Million) Forecast, by Application 2019 & 2032
- Table 36: India Gyroscope Industry Revenue (Million) Forecast, by Application 2019 & 2032
- Table 37: Global Gyroscope Industry Revenue Million Forecast, by Technology 2019 & 2032
- Table 38: Global Gyroscope Industry Revenue Million Forecast, by End-user Vertical 2019 & 2032
- Table 39: Global Gyroscope Industry Revenue Million Forecast, by Country 2019 & 2032
- Table 40: Global Gyroscope Industry Revenue Million Forecast, by Technology 2019 & 2032
- Table 41: Global Gyroscope Industry Revenue Million Forecast, by End-user Vertical 2019 & 2032
- Table 42: Global Gyroscope Industry Revenue Million Forecast, by Country 2019 & 2032
- Table 43: Global Gyroscope Industry Revenue Million Forecast, by Technology 2019 & 2032
- Table 44: Global Gyroscope Industry Revenue Million Forecast, by End-user Vertical 2019 & 2032
- Table 45: Global Gyroscope Industry Revenue Million Forecast, by Country 2019 & 2032
Frequently Asked Questions
1. What is the projected Compound Annual Growth Rate (CAGR) of the Gyroscope Industry?
The projected CAGR is approximately 6.10%.
2. Which companies are prominent players in the Gyroscope Industry?
Key companies in the market include Honeywell International Inc, Dynalab, MEMSIC Inc, MicroStrain Inc, STMicroelectronics NV, Robert Bosch GmbH, InnaLabs, Murata Manufacturing Co Ltd, Analog Devices Inc, EMCORE Corporation, Vectornav Technologies LLC.
3. What are the main segments of the Gyroscope Industry?
The market segments include Technology, End-user Vertical.
4. Can you provide details about the market size?
The market size is estimated to be USD 4.30 Million as of 2022.
5. What are some drivers contributing to market growth?
Rapid Rise of Unmanned Vehicle in Both Defense and Civilian Applications; Technological Advancements Enabling More Effective Components at a Smaller and Lighter Size.
6. What are the notable trends driving market growth?
Automotive to be the Fastest Growing End-user Vertical.
7. Are there any restraints impacting market growth?
Substantial Increase in Complexity Challenging the Market Demand.
8. Can you provide examples of recent developments in the market?
October 2023 - Honeywell expanded its HGuide industrial navigation portfolio by adding a new Inertial Measurement Unit (IMU), the HGuide i400. This new IMU is specifically designed for a wide array of defense, industrial, and autonomous applications across air, land, and sea vehicles and related equipment. The HGuide i400 IMU, boasting a Gyro Bias Repeatability of under one degree per hour, sets a new standard for compact precision. Measuring just 28 mm x 25 mm, it delivers performance without compromising size or weight compared to existing units.
9. What pricing options are available for accessing the report?
Pricing options include single-user, multi-user, and enterprise licenses priced at USD 4750, USD 5250, and USD 8750 respectively.
10. Is the market size provided in terms of value or volume?
The market size is provided in terms of value, measured in Million.
11. Are there any specific market keywords associated with the report?
Yes, the market keyword associated with the report is "Gyroscope Industry," which aids in identifying and referencing the specific market segment covered.
12. How do I determine which pricing option suits my needs best?
The pricing options vary based on user requirements and access needs. Individual users may opt for single-user licenses, while businesses requiring broader access may choose multi-user or enterprise licenses for cost-effective access to the report.
13. Are there any additional resources or data provided in the Gyroscope Industry report?
While the report offers comprehensive insights, it's advisable to review the specific contents or supplementary materials provided to ascertain if additional resources or data are available.
14. How can I stay updated on further developments or reports in the Gyroscope Industry?
To stay informed about further developments, trends, and reports in the Gyroscope Industry, consider subscribing to industry newsletters, following relevant companies and organizations, or regularly checking reputable industry news sources and publications.
Methodology
Step 1 - Identification of Relevant Samples Size from Population Database


Step 2 - Approaches for Defining Global Market Size (Value, Volume* & Price*)

Note*: In applicable scenarios
Step 3 - Data Sources
Primary Research
- Web Analytics
- Survey Reports
- Research Institute
- Latest Research Reports
- Opinion Leaders
Secondary Research
- Annual Reports
- White Paper
- Latest Press Release
- Industry Association
- Paid Database
- Investor Presentations

Step 4 - Data Triangulation
Involves using different sources of information in order to increase the validity of a study
These sources are likely to be stakeholders in a program - participants, other researchers, program staff, other community members, and so on.
Then we put all data in single framework & apply various statistical tools to find out the dynamic on the market.
During the analysis stage, feedback from the stakeholder groups would be compared to determine areas of agreement as well as areas of divergence


