Key Insights
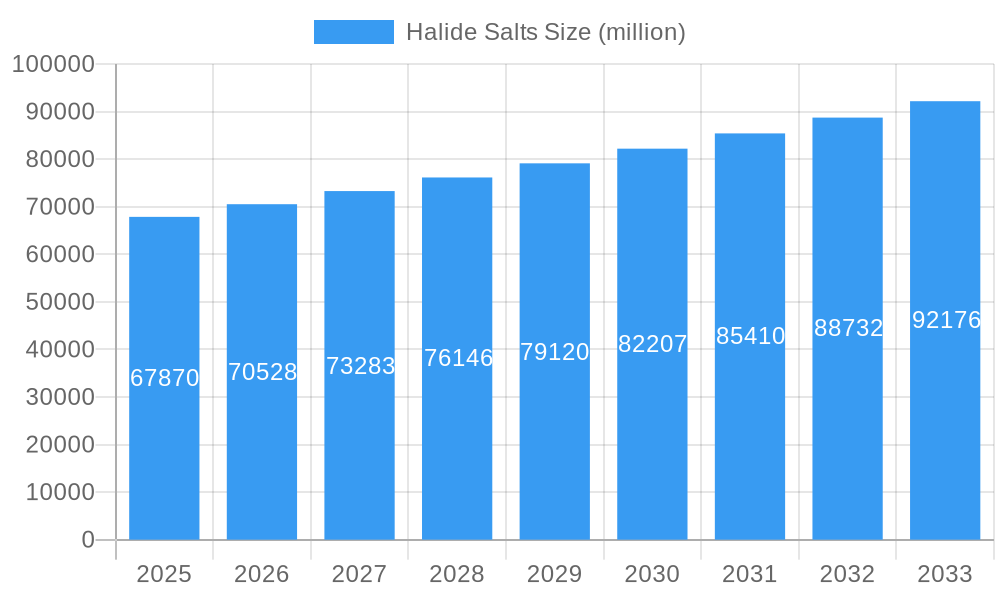
The global halide salts market, valued at $67,870 million in 2025, is projected to experience steady growth, driven by increasing demand across diverse sectors. The Compound Annual Growth Rate (CAGR) of 3.8% from 2025 to 2033 indicates a substantial market expansion over the forecast period. Key drivers include the growing use of halide salts in various applications, including water softening, de-icing, food processing, and chemical manufacturing. Technological advancements leading to more efficient production methods and the development of specialized halide salts with enhanced properties are also contributing factors. While potential regulatory changes related to environmental concerns and fluctuations in raw material prices could present challenges, the overall market outlook remains positive, fueled by ongoing industrialization and population growth, particularly in developing economies.
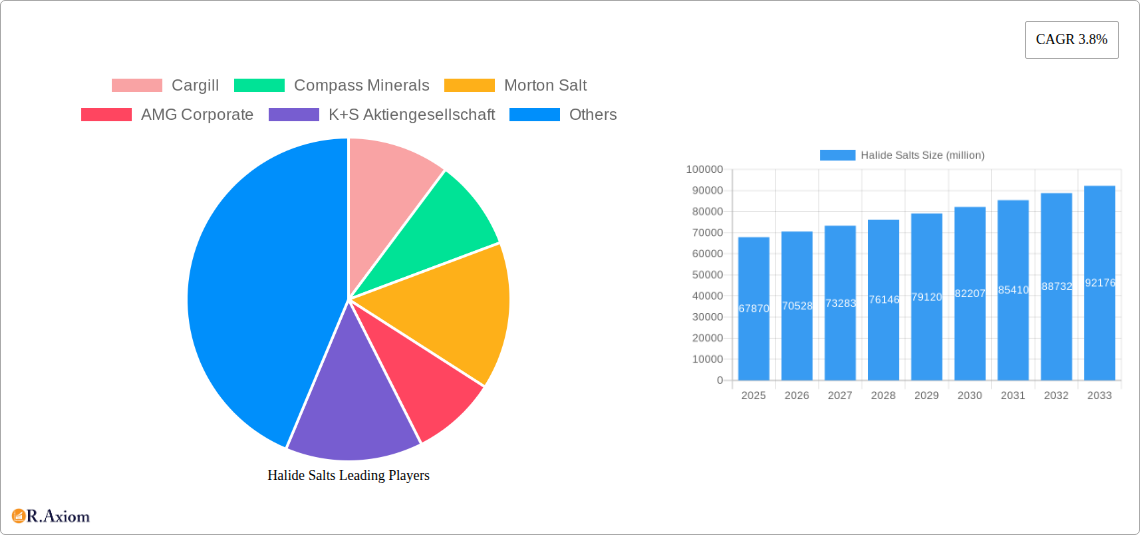
Halide Salts Market Size (In Billion)
The market is characterized by a mix of large multinational corporations and regional players. Major companies like Cargill, Compass Minerals, and Morton Salt dominate the market share, leveraging their established distribution networks and brand recognition. However, smaller companies are also contributing significantly, particularly in niche applications and regional markets. Competition is likely to intensify as companies invest in research and development to improve their product offerings and expand into new applications. The geographic distribution of the market is likely to vary based on factors such as industrial activity, climate conditions, and regulations, with North America and Europe currently holding considerable market shares, though developing regions in Asia and South America are anticipated to witness faster growth rates in the coming years. This robust growth is expected to create significant opportunities for both established and emerging players in the halide salts market.
Halide Salts Company Market Share
Halide Salts Market Report: 2019-2033 Forecast
This comprehensive report provides an in-depth analysis of the global Halide Salts market, offering invaluable insights for industry stakeholders, investors, and strategic decision-makers. The report covers the period from 2019 to 2033, with a focus on the forecast period of 2025-2033 and a base year of 2025. The study meticulously analyzes market dynamics, competitive landscapes, and emerging trends, providing actionable intelligence to navigate this dynamic sector. The report reveals a market valued at $XX million in 2025, projected to reach $XX million by 2033, exhibiting a CAGR of XX%.
Halide Salts Market Concentration & Innovation
The global halide salts market is moderately concentrated, with key players such as Cargill, Compass Minerals, and Morton Salt holding significant market share. However, the market also features several regional and specialized players contributing to the overall competition. The market share distribution amongst the top 5 players is estimated at approximately XX%. Innovation in halide salts is driven by the increasing demand for high-purity products across various applications, including food processing, water treatment, and industrial chemicals. Regulatory frameworks, particularly those concerning food safety and environmental protection, are constantly evolving and influencing product development and manufacturing processes. Substitutes for halide salts exist in specific niche applications, but their overall market penetration remains limited due to cost, performance, and regulatory compliance factors. M&A activity in the halide salts market has been moderate in recent years, with deal values typically ranging from $XX million to $XX million. Recent mergers and acquisitions have primarily focused on expanding geographic reach and product portfolios. End-user trends indicate a shift towards sustainable and environmentally friendly halide salt production methods.
Halide Salts Industry Trends & Insights
The halide salts market is experiencing significant growth, driven primarily by rising demand from the food and beverage, water treatment, and chemical industries. Technological advancements in halide salt production, such as improved extraction and purification techniques, are enhancing product quality and efficiency. Consumer preferences are increasingly favoring high-quality, sustainably produced halide salts. Competitive dynamics are marked by a combination of price competition and product differentiation, with companies focusing on innovation and brand building. The market's growth is projected to be influenced by several factors, including the increasing global population, industrialization, urbanization, and the rising demand for processed food and clean water. These trends collectively contribute to a substantial market expansion. The market exhibits a robust growth trajectory, fueled by increasing demand across key sectors. Technological advancements, particularly in refining and purification, have improved product quality and yield, enhancing cost-effectiveness. This report forecasts substantial growth for halide salts market, based on the projected demand from key applications, with specific CAGRs provided within the full report.
Dominant Markets & Segments in Halide Salts
- Dominant Region: North America currently holds the largest market share, driven by strong demand from the food processing and water treatment sectors, coupled with well-established infrastructure and regulatory frameworks that favor this region.
- Dominant Country: The United States emerges as the leading country, benefiting from significant domestic production capacity and strong demand within various industries.
- Dominant Segment: The food-grade segment commands the largest share, propelled by the rising consumption of processed foods and the increasing need for halide salts as preservatives and flavor enhancers.
The dominance of North America, specifically the United States, is attributed to several factors. Strong infrastructure, including transportation networks, distribution channels, and robust supply chains ensures efficient production and timely delivery to meet the increasing demand. Moreover, favorable economic policies, which include investments in the food industry and stringent regulations ensuring quality and safety, significantly contribute to the growth in the region.
Halide Salts Product Developments
Recent product innovations in the halide salts market have focused on developing high-purity products tailored to specific applications. This includes the development of specialized halide salts for food processing, water treatment, and industrial chemical applications. These innovations enhance product performance, improving efficiency and addressing specific user requirements. Technological advancements in purification methods, combined with a focus on sustainability, are enabling companies to offer enhanced halide salts, boosting their competitive advantage within the market.
Report Scope & Segmentation Analysis
The report provides a detailed segmentation of the halide salts market based on product type (sodium chloride, potassium chloride, calcium chloride, etc.), application (food processing, water treatment, chemical industry, etc.), and geography (North America, Europe, Asia-Pacific, etc.). Each segment's growth projection and market size are analyzed, highlighting the competitive dynamics within each segment.
Key Drivers of Halide Salts Growth
The growth of the halide salts market is driven by several factors: the rising demand for processed food and beverages fuels a significant part of the growth. Increased investments in water treatment infrastructure, particularly in developing economies, necessitate the use of halide salts for water purification. Furthermore, robust demand from the chemical industry, which uses halide salts as raw materials in various chemical processes, contributes to the market's overall expansion. Finally, consistent technological advancements in salt production enhance efficiency and sustainability, bolstering market growth.
Challenges in the Halide Salts Sector
The halide salts sector faces challenges, including fluctuations in raw material prices, which directly impact production costs and profitability. Supply chain disruptions, often exacerbated by geopolitical events or natural disasters, can significantly affect production and distribution. Furthermore, stringent regulatory requirements around product purity and environmental impact can increase operational costs. Intense competition among established players, characterized by both price-based and product differentiation-based strategies, poses further challenges to players attempting to penetrate and expand in this sector.
Emerging Opportunities in Halide Salts
Emerging opportunities lie in developing specialized halide salts for niche applications, such as pharmaceuticals and electronics. The growing demand for sustainable and environmentally friendly halide salt production methods presents significant opportunities for companies to enhance their brand image and expand into new markets. Furthermore, the exploration of new markets in developing economies holds promise for expansion and growth.
Leading Players in the Halide Salts Market
- Cargill
- Compass Minerals
- Morton Salt
- AMG Corporate
- K+S Aktiengesellschaft
- INEOS Group
- Nouryon
- ICL Group
- Solvay
- SALT Minerals
- Wilson Salt
- Derivados del Flúor
- Minera de Santa Marta
- CNSIC
- Sinochem Lantian
- Zhejiang Juhua
- Arab Potash
Key Developments in Halide Salts Industry
- 2022 Q4: Cargill announced a significant investment in expanding its halide salt production facility in [Location].
- 2023 Q1: Compass Minerals launched a new line of high-purity halide salts for the food industry.
- 2023 Q2: Morton Salt acquired a smaller regional halide salt producer, expanding its market presence.
- 2024 Q1: K+S Aktiengesellschaft invested in R&D for sustainable halide salt production. (Further specific examples of developments with dates need to be added based on actual market data.)
Strategic Outlook for Halide Salts Market
The halide salts market is poised for continued growth, driven by increasing demand across various sectors and ongoing technological advancements. Opportunities exist in developing specialized products, expanding into new geographical markets, and adopting sustainable production practices. Companies that prioritize innovation, sustainability, and efficient supply chains are well-positioned to capitalize on the market's future potential and achieve significant growth over the forecast period.
Halide Salts Segmentation
-
1. Application
- 1.1. Water Treatment
- 1.2. Metal Production
- 1.3. De-icing
- 1.4. Fertilizer Production
- 1.5. Pharmaceutical Manufacturing
- 1.6. Others
-
2. Type
- 2.1. Sodium Halides
- 2.2. Potassium Halides
- 2.3. Calcium Halides
- 2.4. Magnesium Halides
- 2.5. Iron Halides
- 2.6. Aluminum Halides
- 2.7. Copper Halides
- 2.8. Ammonium Halides
- 2.9. Other Halides
Halide Salts Segmentation By Geography
-
1. North America
- 1.1. United States
- 1.2. Canada
- 1.3. Mexico
-
2. South America
- 2.1. Brazil
- 2.2. Argentina
- 2.3. Rest of South America
-
3. Europe
- 3.1. United Kingdom
- 3.2. Germany
- 3.3. France
- 3.4. Italy
- 3.5. Spain
- 3.6. Russia
- 3.7. Benelux
- 3.8. Nordics
- 3.9. Rest of Europe
-
4. Middle East & Africa
- 4.1. Turkey
- 4.2. Israel
- 4.3. GCC
- 4.4. North Africa
- 4.5. South Africa
- 4.6. Rest of Middle East & Africa
-
5. Asia Pacific
- 5.1. China
- 5.2. India
- 5.3. Japan
- 5.4. South Korea
- 5.5. ASEAN
- 5.6. Oceania
- 5.7. Rest of Asia Pacific
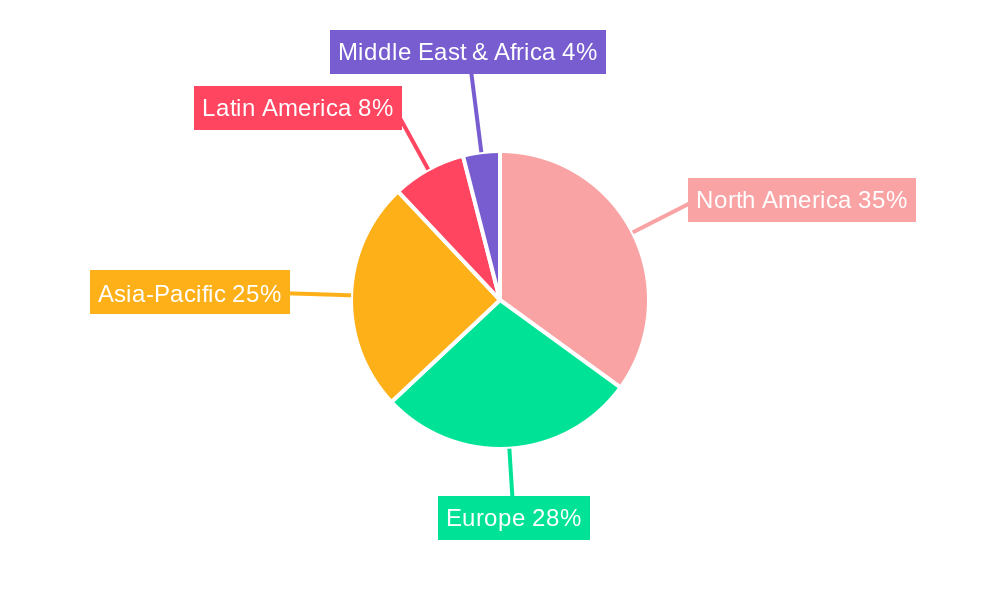
Halide Salts Regional Market Share
Geographic Coverage of Halide Salts
Halide Salts REPORT HIGHLIGHTS
| Aspects | Details |
|---|---|
| Study Period | 2020-2034 |
| Base Year | 2025 |
| Estimated Year | 2026 |
| Forecast Period | 2026-2034 |
| Historical Period | 2020-2025 |
| Growth Rate | CAGR of 3.8% from 2020-2034 |
| Segmentation |
|
Table of Contents
- 1. Introduction
- 1.1. Research Scope
- 1.2. Market Segmentation
- 1.3. Research Objective
- 1.4. Definitions and Assumptions
- 2. Executive Summary
- 2.1. Market Snapshot
- 3. Market Dynamics
- 3.1. Market Drivers
- 3.2. Market Restrains
- 3.3. Market Trends
- 3.4. Market Opportunities
- 4. Market Factor Analysis
- 4.1. Porters Five Forces
- 4.1.1. Bargaining Power of Suppliers
- 4.1.2. Bargaining Power of Buyers
- 4.1.3. Threat of New Entrants
- 4.1.4. Threat of Substitutes
- 4.1.5. Competitive Rivalry
- 4.2. PESTEL analysis
- 4.3. BCG Analysis
- 4.3.1. Stars (High Growth, High Market Share)
- 4.3.2. Cash Cows (Low Growth, High Market Share)
- 4.3.3. Question Mark (High Growth, Low Market Share)
- 4.3.4. Dogs (Low Growth, Low Market Share)
- 4.4. Ansoff Matrix Analysis
- 4.5. Supply Chain Analysis
- 4.6. Regulatory Landscape
- 4.7. Current Market Potential and Opportunity Assessment (TAM–SAM–SOM Framework)
- 4.8. RAX Analyst Note
- 4.1. Porters Five Forces
- 5. Market Analysis, Insights and Forecast 2021-2033
- 5.1. Market Analysis, Insights and Forecast - by Application
- 5.1.1. Water Treatment
- 5.1.2. Metal Production
- 5.1.3. De-icing
- 5.1.4. Fertilizer Production
- 5.1.5. Pharmaceutical Manufacturing
- 5.1.6. Others
- 5.2. Market Analysis, Insights and Forecast - by Type
- 5.2.1. Sodium Halides
- 5.2.2. Potassium Halides
- 5.2.3. Calcium Halides
- 5.2.4. Magnesium Halides
- 5.2.5. Iron Halides
- 5.2.6. Aluminum Halides
- 5.2.7. Copper Halides
- 5.2.8. Ammonium Halides
- 5.2.9. Other Halides
- 5.3. Market Analysis, Insights and Forecast - by Region
- 5.3.1. North America
- 5.3.2. South America
- 5.3.3. Europe
- 5.3.4. Middle East & Africa
- 5.3.5. Asia Pacific
- 5.1. Market Analysis, Insights and Forecast - by Application
- 6. Global Halide Salts Analysis, Insights and Forecast, 2021-2033
- 6.1. Market Analysis, Insights and Forecast - by Application
- 6.1.1. Water Treatment
- 6.1.2. Metal Production
- 6.1.3. De-icing
- 6.1.4. Fertilizer Production
- 6.1.5. Pharmaceutical Manufacturing
- 6.1.6. Others
- 6.2. Market Analysis, Insights and Forecast - by Type
- 6.2.1. Sodium Halides
- 6.2.2. Potassium Halides
- 6.2.3. Calcium Halides
- 6.2.4. Magnesium Halides
- 6.2.5. Iron Halides
- 6.2.6. Aluminum Halides
- 6.2.7. Copper Halides
- 6.2.8. Ammonium Halides
- 6.2.9. Other Halides
- 6.1. Market Analysis, Insights and Forecast - by Application
- 7. North America Halide Salts Analysis, Insights and Forecast, 2020-2032
- 7.1. Market Analysis, Insights and Forecast - by Application
- 7.1.1. Water Treatment
- 7.1.2. Metal Production
- 7.1.3. De-icing
- 7.1.4. Fertilizer Production
- 7.1.5. Pharmaceutical Manufacturing
- 7.1.6. Others
- 7.2. Market Analysis, Insights and Forecast - by Type
- 7.2.1. Sodium Halides
- 7.2.2. Potassium Halides
- 7.2.3. Calcium Halides
- 7.2.4. Magnesium Halides
- 7.2.5. Iron Halides
- 7.2.6. Aluminum Halides
- 7.2.7. Copper Halides
- 7.2.8. Ammonium Halides
- 7.2.9. Other Halides
- 7.1. Market Analysis, Insights and Forecast - by Application
- 8. South America Halide Salts Analysis, Insights and Forecast, 2020-2032
- 8.1. Market Analysis, Insights and Forecast - by Application
- 8.1.1. Water Treatment
- 8.1.2. Metal Production
- 8.1.3. De-icing
- 8.1.4. Fertilizer Production
- 8.1.5. Pharmaceutical Manufacturing
- 8.1.6. Others
- 8.2. Market Analysis, Insights and Forecast - by Type
- 8.2.1. Sodium Halides
- 8.2.2. Potassium Halides
- 8.2.3. Calcium Halides
- 8.2.4. Magnesium Halides
- 8.2.5. Iron Halides
- 8.2.6. Aluminum Halides
- 8.2.7. Copper Halides
- 8.2.8. Ammonium Halides
- 8.2.9. Other Halides
- 8.1. Market Analysis, Insights and Forecast - by Application
- 9. Europe Halide Salts Analysis, Insights and Forecast, 2020-2032
- 9.1. Market Analysis, Insights and Forecast - by Application
- 9.1.1. Water Treatment
- 9.1.2. Metal Production
- 9.1.3. De-icing
- 9.1.4. Fertilizer Production
- 9.1.5. Pharmaceutical Manufacturing
- 9.1.6. Others
- 9.2. Market Analysis, Insights and Forecast - by Type
- 9.2.1. Sodium Halides
- 9.2.2. Potassium Halides
- 9.2.3. Calcium Halides
- 9.2.4. Magnesium Halides
- 9.2.5. Iron Halides
- 9.2.6. Aluminum Halides
- 9.2.7. Copper Halides
- 9.2.8. Ammonium Halides
- 9.2.9. Other Halides
- 9.1. Market Analysis, Insights and Forecast - by Application
- 10. Middle East & Africa Halide Salts Analysis, Insights and Forecast, 2020-2032
- 10.1. Market Analysis, Insights and Forecast - by Application
- 10.1.1. Water Treatment
- 10.1.2. Metal Production
- 10.1.3. De-icing
- 10.1.4. Fertilizer Production
- 10.1.5. Pharmaceutical Manufacturing
- 10.1.6. Others
- 10.2. Market Analysis, Insights and Forecast - by Type
- 10.2.1. Sodium Halides
- 10.2.2. Potassium Halides
- 10.2.3. Calcium Halides
- 10.2.4. Magnesium Halides
- 10.2.5. Iron Halides
- 10.2.6. Aluminum Halides
- 10.2.7. Copper Halides
- 10.2.8. Ammonium Halides
- 10.2.9. Other Halides
- 10.1. Market Analysis, Insights and Forecast - by Application
- 11. Asia Pacific Halide Salts Analysis, Insights and Forecast, 2020-2032
- 11.1. Market Analysis, Insights and Forecast - by Application
- 11.1.1. Water Treatment
- 11.1.2. Metal Production
- 11.1.3. De-icing
- 11.1.4. Fertilizer Production
- 11.1.5. Pharmaceutical Manufacturing
- 11.1.6. Others
- 11.2. Market Analysis, Insights and Forecast - by Type
- 11.2.1. Sodium Halides
- 11.2.2. Potassium Halides
- 11.2.3. Calcium Halides
- 11.2.4. Magnesium Halides
- 11.2.5. Iron Halides
- 11.2.6. Aluminum Halides
- 11.2.7. Copper Halides
- 11.2.8. Ammonium Halides
- 11.2.9. Other Halides
- 11.1. Market Analysis, Insights and Forecast - by Application
- 12. Competitive Analysis
- 12.1. Company Profiles
- 12.1.1 Cargill
- 12.1.1.1. Company Overview
- 12.1.1.2. Products
- 12.1.1.3. Company Financials
- 12.1.1.4. SWOT Analysis
- 12.1.2 Compass Minerals
- 12.1.2.1. Company Overview
- 12.1.2.2. Products
- 12.1.2.3. Company Financials
- 12.1.2.4. SWOT Analysis
- 12.1.3 Morton Salt
- 12.1.3.1. Company Overview
- 12.1.3.2. Products
- 12.1.3.3. Company Financials
- 12.1.3.4. SWOT Analysis
- 12.1.4 AMG Corporate
- 12.1.4.1. Company Overview
- 12.1.4.2. Products
- 12.1.4.3. Company Financials
- 12.1.4.4. SWOT Analysis
- 12.1.5 K+S Aktiengesellschaft
- 12.1.5.1. Company Overview
- 12.1.5.2. Products
- 12.1.5.3. Company Financials
- 12.1.5.4. SWOT Analysis
- 12.1.6 INEOS Group
- 12.1.6.1. Company Overview
- 12.1.6.2. Products
- 12.1.6.3. Company Financials
- 12.1.6.4. SWOT Analysis
- 12.1.7 Nouryon
- 12.1.7.1. Company Overview
- 12.1.7.2. Products
- 12.1.7.3. Company Financials
- 12.1.7.4. SWOT Analysis
- 12.1.8 ICL Group
- 12.1.8.1. Company Overview
- 12.1.8.2. Products
- 12.1.8.3. Company Financials
- 12.1.8.4. SWOT Analysis
- 12.1.9 Solvay
- 12.1.9.1. Company Overview
- 12.1.9.2. Products
- 12.1.9.3. Company Financials
- 12.1.9.4. SWOT Analysis
- 12.1.10 SALT Minerals
- 12.1.10.1. Company Overview
- 12.1.10.2. Products
- 12.1.10.3. Company Financials
- 12.1.10.4. SWOT Analysis
- 12.1.11 Wilson Salt
- 12.1.11.1. Company Overview
- 12.1.11.2. Products
- 12.1.11.3. Company Financials
- 12.1.11.4. SWOT Analysis
- 12.1.12 Derivados del Flúor
- 12.1.12.1. Company Overview
- 12.1.12.2. Products
- 12.1.12.3. Company Financials
- 12.1.12.4. SWOT Analysis
- 12.1.13 Minera de Santa Marta
- 12.1.13.1. Company Overview
- 12.1.13.2. Products
- 12.1.13.3. Company Financials
- 12.1.13.4. SWOT Analysis
- 12.1.14 CNSIC
- 12.1.14.1. Company Overview
- 12.1.14.2. Products
- 12.1.14.3. Company Financials
- 12.1.14.4. SWOT Analysis
- 12.1.15 Sinochem Lantian
- 12.1.15.1. Company Overview
- 12.1.15.2. Products
- 12.1.15.3. Company Financials
- 12.1.15.4. SWOT Analysis
- 12.1.16 Zhejiang Juhua
- 12.1.16.1. Company Overview
- 12.1.16.2. Products
- 12.1.16.3. Company Financials
- 12.1.16.4. SWOT Analysis
- 12.1.17 Arab Potash
- 12.1.17.1. Company Overview
- 12.1.17.2. Products
- 12.1.17.3. Company Financials
- 12.1.17.4. SWOT Analysis
- 12.1.1 Cargill
- 12.2. Market Entropy
- 12.2.1 Company's Key Areas Served
- 12.2.2 Recent Developments
- 12.3. Company Market Share Analysis 2025
- 12.3.1 Top 5 Companies Market Share Analysis
- 12.3.2 Top 3 Companies Market Share Analysis
- 12.4. List of Potential Customers
- 13. Research Methodology
List of Figures
- Figure 1: Global Halide Salts Revenue Breakdown (million, %) by Region 2025 & 2033
- Figure 2: Global Halide Salts Volume Breakdown (K, %) by Region 2025 & 2033
- Figure 3: North America Halide Salts Revenue (million), by Application 2025 & 2033
- Figure 4: North America Halide Salts Volume (K), by Application 2025 & 2033
- Figure 5: North America Halide Salts Revenue Share (%), by Application 2025 & 2033
- Figure 6: North America Halide Salts Volume Share (%), by Application 2025 & 2033
- Figure 7: North America Halide Salts Revenue (million), by Type 2025 & 2033
- Figure 8: North America Halide Salts Volume (K), by Type 2025 & 2033
- Figure 9: North America Halide Salts Revenue Share (%), by Type 2025 & 2033
- Figure 10: North America Halide Salts Volume Share (%), by Type 2025 & 2033
- Figure 11: North America Halide Salts Revenue (million), by Country 2025 & 2033
- Figure 12: North America Halide Salts Volume (K), by Country 2025 & 2033
- Figure 13: North America Halide Salts Revenue Share (%), by Country 2025 & 2033
- Figure 14: North America Halide Salts Volume Share (%), by Country 2025 & 2033
- Figure 15: South America Halide Salts Revenue (million), by Application 2025 & 2033
- Figure 16: South America Halide Salts Volume (K), by Application 2025 & 2033
- Figure 17: South America Halide Salts Revenue Share (%), by Application 2025 & 2033
- Figure 18: South America Halide Salts Volume Share (%), by Application 2025 & 2033
- Figure 19: South America Halide Salts Revenue (million), by Type 2025 & 2033
- Figure 20: South America Halide Salts Volume (K), by Type 2025 & 2033
- Figure 21: South America Halide Salts Revenue Share (%), by Type 2025 & 2033
- Figure 22: South America Halide Salts Volume Share (%), by Type 2025 & 2033
- Figure 23: South America Halide Salts Revenue (million), by Country 2025 & 2033
- Figure 24: South America Halide Salts Volume (K), by Country 2025 & 2033
- Figure 25: South America Halide Salts Revenue Share (%), by Country 2025 & 2033
- Figure 26: South America Halide Salts Volume Share (%), by Country 2025 & 2033
- Figure 27: Europe Halide Salts Revenue (million), by Application 2025 & 2033
- Figure 28: Europe Halide Salts Volume (K), by Application 2025 & 2033
- Figure 29: Europe Halide Salts Revenue Share (%), by Application 2025 & 2033
- Figure 30: Europe Halide Salts Volume Share (%), by Application 2025 & 2033
- Figure 31: Europe Halide Salts Revenue (million), by Type 2025 & 2033
- Figure 32: Europe Halide Salts Volume (K), by Type 2025 & 2033
- Figure 33: Europe Halide Salts Revenue Share (%), by Type 2025 & 2033
- Figure 34: Europe Halide Salts Volume Share (%), by Type 2025 & 2033
- Figure 35: Europe Halide Salts Revenue (million), by Country 2025 & 2033
- Figure 36: Europe Halide Salts Volume (K), by Country 2025 & 2033
- Figure 37: Europe Halide Salts Revenue Share (%), by Country 2025 & 2033
- Figure 38: Europe Halide Salts Volume Share (%), by Country 2025 & 2033
- Figure 39: Middle East & Africa Halide Salts Revenue (million), by Application 2025 & 2033
- Figure 40: Middle East & Africa Halide Salts Volume (K), by Application 2025 & 2033
- Figure 41: Middle East & Africa Halide Salts Revenue Share (%), by Application 2025 & 2033
- Figure 42: Middle East & Africa Halide Salts Volume Share (%), by Application 2025 & 2033
- Figure 43: Middle East & Africa Halide Salts Revenue (million), by Type 2025 & 2033
- Figure 44: Middle East & Africa Halide Salts Volume (K), by Type 2025 & 2033
- Figure 45: Middle East & Africa Halide Salts Revenue Share (%), by Type 2025 & 2033
- Figure 46: Middle East & Africa Halide Salts Volume Share (%), by Type 2025 & 2033
- Figure 47: Middle East & Africa Halide Salts Revenue (million), by Country 2025 & 2033
- Figure 48: Middle East & Africa Halide Salts Volume (K), by Country 2025 & 2033
- Figure 49: Middle East & Africa Halide Salts Revenue Share (%), by Country 2025 & 2033
- Figure 50: Middle East & Africa Halide Salts Volume Share (%), by Country 2025 & 2033
- Figure 51: Asia Pacific Halide Salts Revenue (million), by Application 2025 & 2033
- Figure 52: Asia Pacific Halide Salts Volume (K), by Application 2025 & 2033
- Figure 53: Asia Pacific Halide Salts Revenue Share (%), by Application 2025 & 2033
- Figure 54: Asia Pacific Halide Salts Volume Share (%), by Application 2025 & 2033
- Figure 55: Asia Pacific Halide Salts Revenue (million), by Type 2025 & 2033
- Figure 56: Asia Pacific Halide Salts Volume (K), by Type 2025 & 2033
- Figure 57: Asia Pacific Halide Salts Revenue Share (%), by Type 2025 & 2033
- Figure 58: Asia Pacific Halide Salts Volume Share (%), by Type 2025 & 2033
- Figure 59: Asia Pacific Halide Salts Revenue (million), by Country 2025 & 2033
- Figure 60: Asia Pacific Halide Salts Volume (K), by Country 2025 & 2033
- Figure 61: Asia Pacific Halide Salts Revenue Share (%), by Country 2025 & 2033
- Figure 62: Asia Pacific Halide Salts Volume Share (%), by Country 2025 & 2033
List of Tables
- Table 1: Global Halide Salts Revenue million Forecast, by Application 2020 & 2033
- Table 2: Global Halide Salts Volume K Forecast, by Application 2020 & 2033
- Table 3: Global Halide Salts Revenue million Forecast, by Type 2020 & 2033
- Table 4: Global Halide Salts Volume K Forecast, by Type 2020 & 2033
- Table 5: Global Halide Salts Revenue million Forecast, by Region 2020 & 2033
- Table 6: Global Halide Salts Volume K Forecast, by Region 2020 & 2033
- Table 7: Global Halide Salts Revenue million Forecast, by Application 2020 & 2033
- Table 8: Global Halide Salts Volume K Forecast, by Application 2020 & 2033
- Table 9: Global Halide Salts Revenue million Forecast, by Type 2020 & 2033
- Table 10: Global Halide Salts Volume K Forecast, by Type 2020 & 2033
- Table 11: Global Halide Salts Revenue million Forecast, by Country 2020 & 2033
- Table 12: Global Halide Salts Volume K Forecast, by Country 2020 & 2033
- Table 13: United States Halide Salts Revenue (million) Forecast, by Application 2020 & 2033
- Table 14: United States Halide Salts Volume (K) Forecast, by Application 2020 & 2033
- Table 15: Canada Halide Salts Revenue (million) Forecast, by Application 2020 & 2033
- Table 16: Canada Halide Salts Volume (K) Forecast, by Application 2020 & 2033
- Table 17: Mexico Halide Salts Revenue (million) Forecast, by Application 2020 & 2033
- Table 18: Mexico Halide Salts Volume (K) Forecast, by Application 2020 & 2033
- Table 19: Global Halide Salts Revenue million Forecast, by Application 2020 & 2033
- Table 20: Global Halide Salts Volume K Forecast, by Application 2020 & 2033
- Table 21: Global Halide Salts Revenue million Forecast, by Type 2020 & 2033
- Table 22: Global Halide Salts Volume K Forecast, by Type 2020 & 2033
- Table 23: Global Halide Salts Revenue million Forecast, by Country 2020 & 2033
- Table 24: Global Halide Salts Volume K Forecast, by Country 2020 & 2033
- Table 25: Brazil Halide Salts Revenue (million) Forecast, by Application 2020 & 2033
- Table 26: Brazil Halide Salts Volume (K) Forecast, by Application 2020 & 2033
- Table 27: Argentina Halide Salts Revenue (million) Forecast, by Application 2020 & 2033
- Table 28: Argentina Halide Salts Volume (K) Forecast, by Application 2020 & 2033
- Table 29: Rest of South America Halide Salts Revenue (million) Forecast, by Application 2020 & 2033
- Table 30: Rest of South America Halide Salts Volume (K) Forecast, by Application 2020 & 2033
- Table 31: Global Halide Salts Revenue million Forecast, by Application 2020 & 2033
- Table 32: Global Halide Salts Volume K Forecast, by Application 2020 & 2033
- Table 33: Global Halide Salts Revenue million Forecast, by Type 2020 & 2033
- Table 34: Global Halide Salts Volume K Forecast, by Type 2020 & 2033
- Table 35: Global Halide Salts Revenue million Forecast, by Country 2020 & 2033
- Table 36: Global Halide Salts Volume K Forecast, by Country 2020 & 2033
- Table 37: United Kingdom Halide Salts Revenue (million) Forecast, by Application 2020 & 2033
- Table 38: United Kingdom Halide Salts Volume (K) Forecast, by Application 2020 & 2033
- Table 39: Germany Halide Salts Revenue (million) Forecast, by Application 2020 & 2033
- Table 40: Germany Halide Salts Volume (K) Forecast, by Application 2020 & 2033
- Table 41: France Halide Salts Revenue (million) Forecast, by Application 2020 & 2033
- Table 42: France Halide Salts Volume (K) Forecast, by Application 2020 & 2033
- Table 43: Italy Halide Salts Revenue (million) Forecast, by Application 2020 & 2033
- Table 44: Italy Halide Salts Volume (K) Forecast, by Application 2020 & 2033
- Table 45: Spain Halide Salts Revenue (million) Forecast, by Application 2020 & 2033
- Table 46: Spain Halide Salts Volume (K) Forecast, by Application 2020 & 2033
- Table 47: Russia Halide Salts Revenue (million) Forecast, by Application 2020 & 2033
- Table 48: Russia Halide Salts Volume (K) Forecast, by Application 2020 & 2033
- Table 49: Benelux Halide Salts Revenue (million) Forecast, by Application 2020 & 2033
- Table 50: Benelux Halide Salts Volume (K) Forecast, by Application 2020 & 2033
- Table 51: Nordics Halide Salts Revenue (million) Forecast, by Application 2020 & 2033
- Table 52: Nordics Halide Salts Volume (K) Forecast, by Application 2020 & 2033
- Table 53: Rest of Europe Halide Salts Revenue (million) Forecast, by Application 2020 & 2033
- Table 54: Rest of Europe Halide Salts Volume (K) Forecast, by Application 2020 & 2033
- Table 55: Global Halide Salts Revenue million Forecast, by Application 2020 & 2033
- Table 56: Global Halide Salts Volume K Forecast, by Application 2020 & 2033
- Table 57: Global Halide Salts Revenue million Forecast, by Type 2020 & 2033
- Table 58: Global Halide Salts Volume K Forecast, by Type 2020 & 2033
- Table 59: Global Halide Salts Revenue million Forecast, by Country 2020 & 2033
- Table 60: Global Halide Salts Volume K Forecast, by Country 2020 & 2033
- Table 61: Turkey Halide Salts Revenue (million) Forecast, by Application 2020 & 2033
- Table 62: Turkey Halide Salts Volume (K) Forecast, by Application 2020 & 2033
- Table 63: Israel Halide Salts Revenue (million) Forecast, by Application 2020 & 2033
- Table 64: Israel Halide Salts Volume (K) Forecast, by Application 2020 & 2033
- Table 65: GCC Halide Salts Revenue (million) Forecast, by Application 2020 & 2033
- Table 66: GCC Halide Salts Volume (K) Forecast, by Application 2020 & 2033
- Table 67: North Africa Halide Salts Revenue (million) Forecast, by Application 2020 & 2033
- Table 68: North Africa Halide Salts Volume (K) Forecast, by Application 2020 & 2033
- Table 69: South Africa Halide Salts Revenue (million) Forecast, by Application 2020 & 2033
- Table 70: South Africa Halide Salts Volume (K) Forecast, by Application 2020 & 2033
- Table 71: Rest of Middle East & Africa Halide Salts Revenue (million) Forecast, by Application 2020 & 2033
- Table 72: Rest of Middle East & Africa Halide Salts Volume (K) Forecast, by Application 2020 & 2033
- Table 73: Global Halide Salts Revenue million Forecast, by Application 2020 & 2033
- Table 74: Global Halide Salts Volume K Forecast, by Application 2020 & 2033
- Table 75: Global Halide Salts Revenue million Forecast, by Type 2020 & 2033
- Table 76: Global Halide Salts Volume K Forecast, by Type 2020 & 2033
- Table 77: Global Halide Salts Revenue million Forecast, by Country 2020 & 2033
- Table 78: Global Halide Salts Volume K Forecast, by Country 2020 & 2033
- Table 79: China Halide Salts Revenue (million) Forecast, by Application 2020 & 2033
- Table 80: China Halide Salts Volume (K) Forecast, by Application 2020 & 2033
- Table 81: India Halide Salts Revenue (million) Forecast, by Application 2020 & 2033
- Table 82: India Halide Salts Volume (K) Forecast, by Application 2020 & 2033
- Table 83: Japan Halide Salts Revenue (million) Forecast, by Application 2020 & 2033
- Table 84: Japan Halide Salts Volume (K) Forecast, by Application 2020 & 2033
- Table 85: South Korea Halide Salts Revenue (million) Forecast, by Application 2020 & 2033
- Table 86: South Korea Halide Salts Volume (K) Forecast, by Application 2020 & 2033
- Table 87: ASEAN Halide Salts Revenue (million) Forecast, by Application 2020 & 2033
- Table 88: ASEAN Halide Salts Volume (K) Forecast, by Application 2020 & 2033
- Table 89: Oceania Halide Salts Revenue (million) Forecast, by Application 2020 & 2033
- Table 90: Oceania Halide Salts Volume (K) Forecast, by Application 2020 & 2033
- Table 91: Rest of Asia Pacific Halide Salts Revenue (million) Forecast, by Application 2020 & 2033
- Table 92: Rest of Asia Pacific Halide Salts Volume (K) Forecast, by Application 2020 & 2033
Frequently Asked Questions
1. What is the projected Compound Annual Growth Rate (CAGR) of the Halide Salts?
The projected CAGR is approximately 3.8%.
2. Which companies are prominent players in the Halide Salts?
Key companies in the market include Cargill, Compass Minerals, Morton Salt, AMG Corporate, K+S Aktiengesellschaft, INEOS Group, Nouryon, ICL Group, Solvay, SALT Minerals, Wilson Salt, Derivados del Flúor, Minera de Santa Marta, CNSIC, Sinochem Lantian, Zhejiang Juhua, Arab Potash.
3. What are the main segments of the Halide Salts?
The market segments include Application, Type.
4. Can you provide details about the market size?
The market size is estimated to be USD 67870 million as of 2022.
5. What are some drivers contributing to market growth?
N/A
6. What are the notable trends driving market growth?
N/A
7. Are there any restraints impacting market growth?
N/A
8. Can you provide examples of recent developments in the market?
N/A
9. What pricing options are available for accessing the report?
Pricing options include single-user, multi-user, and enterprise licenses priced at USD 3950.00, USD 5925.00, and USD 7900.00 respectively.
10. Is the market size provided in terms of value or volume?
The market size is provided in terms of value, measured in million and volume, measured in K.
11. Are there any specific market keywords associated with the report?
Yes, the market keyword associated with the report is "Halide Salts," which aids in identifying and referencing the specific market segment covered.
12. How do I determine which pricing option suits my needs best?
The pricing options vary based on user requirements and access needs. Individual users may opt for single-user licenses, while businesses requiring broader access may choose multi-user or enterprise licenses for cost-effective access to the report.
13. Are there any additional resources or data provided in the Halide Salts report?
While the report offers comprehensive insights, it's advisable to review the specific contents or supplementary materials provided to ascertain if additional resources or data are available.
14. How can I stay updated on further developments or reports in the Halide Salts?
To stay informed about further developments, trends, and reports in the Halide Salts, consider subscribing to industry newsletters, following relevant companies and organizations, or regularly checking reputable industry news sources and publications.
Methodology
Step 1 - Identification of Relevant Samples Size from Population Database


Step 2 - Approaches for Defining Global Market Size (Value, Volume* & Price*)

Note*: In applicable scenarios
Step 3 - Data Sources
Primary Research
- Web Analytics
- Survey Reports
- Research Institute
- Latest Research Reports
- Opinion Leaders
Secondary Research
- Annual Reports
- White Paper
- Latest Press Release
- Industry Association
- Paid Database
- Investor Presentations

Step 4 - Data Triangulation
Involves using different sources of information in order to increase the validity of a study
These sources are likely to be stakeholders in a program - participants, other researchers, program staff, other community members, and so on.
Then we put all data in single framework & apply various statistical tools to find out the dynamic on the market.
During the analysis stage, feedback from the stakeholder groups would be compared to determine areas of agreement as well as areas of divergence

