

Key Insights
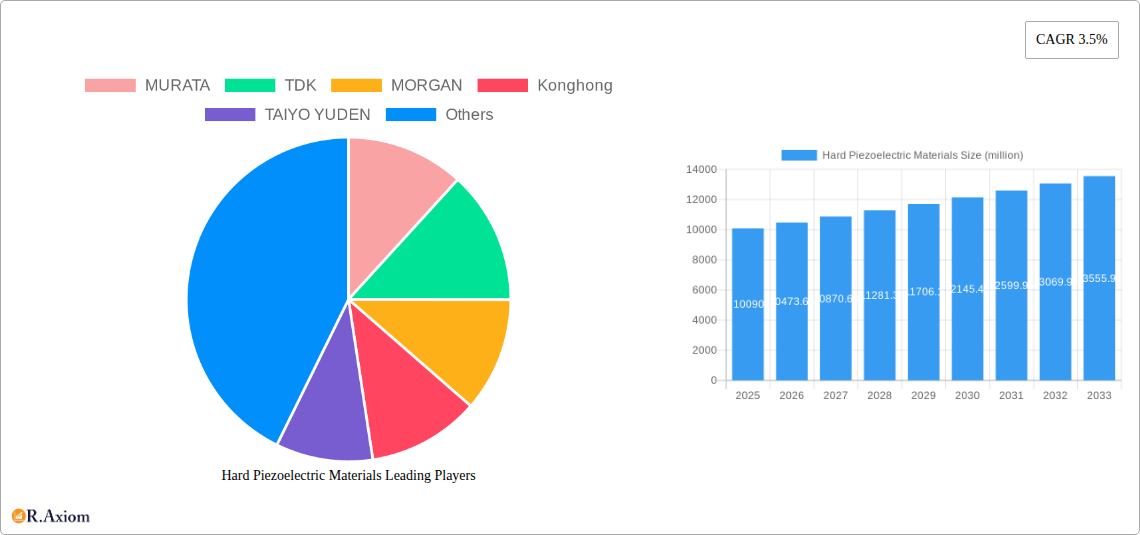
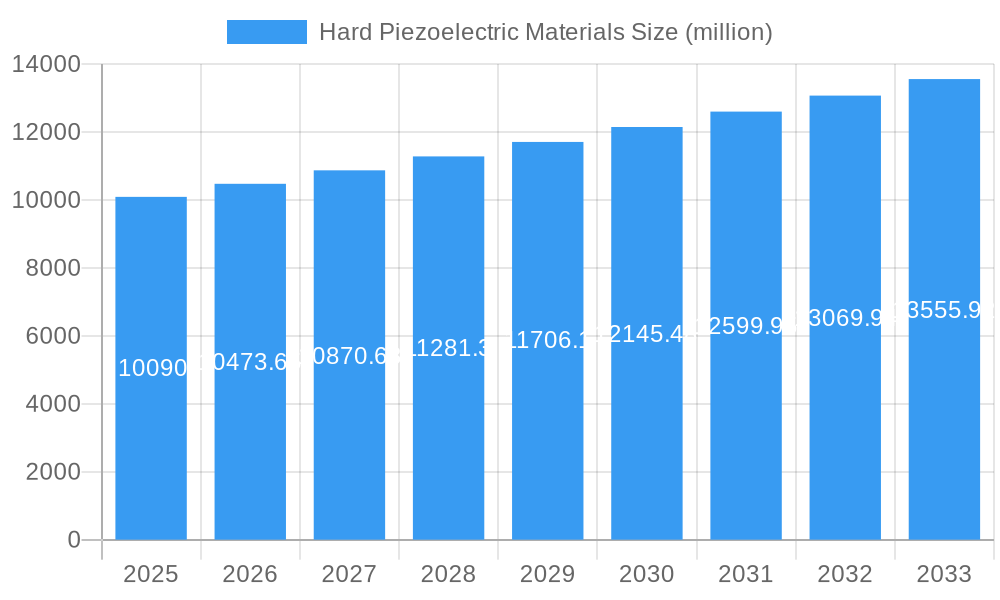
The hard piezoelectric materials market, valued at approximately $10.09 billion in 2025, is projected to experience steady growth, exhibiting a compound annual growth rate (CAGR) of 3.5% from 2025 to 2033. This growth is fueled by increasing demand across diverse sectors, primarily driven by the burgeoning automotive and electronics industries. The automotive sector's adoption of advanced driver-assistance systems (ADAS) and electric vehicles (EVs), requiring sophisticated sensors and actuators, significantly boosts market demand. Simultaneously, the electronics industry's continuous miniaturization and integration efforts create a strong need for high-performance piezoelectric materials in various applications, including resonators, filters, and actuators in smartphones, wearables, and other consumer electronics. Further contributing to market expansion is the growing adoption of piezoelectric materials in medical devices, particularly in ultrasound imaging and drug delivery systems. However, the market faces challenges such as high material costs and the complexity of manufacturing processes, which can potentially limit widespread adoption. Nevertheless, ongoing research and development focused on improving material properties and reducing production costs are expected to mitigate these restraints and sustain market growth throughout the forecast period.
Hard Piezoelectric Materials Market Size (In Billion)
The competitive landscape of the hard piezoelectric materials market is characterized by the presence of both established multinational corporations and smaller specialized companies. Key players like Murata, TDK, and Morgan are prominent due to their extensive product portfolios and global reach. However, regional players, particularly in Asia, are also making significant contributions. The market dynamics suggest a trend towards increased vertical integration, with companies seeking to control more aspects of the value chain, from material synthesis to component manufacturing. This trend, coupled with continuous innovation in material science and manufacturing techniques, points towards a dynamic and evolving market poised for sustained growth in the coming years. The focus on energy harvesting applications, improving sensor sensitivity and integrating piezoelectric materials into more compact devices will continue to shape future market developments.
Hard Piezoelectric Materials Company Market Share
Hard Piezoelectric Materials Market Report: 2019-2033
This comprehensive report provides a detailed analysis of the global hard piezoelectric materials market, offering actionable insights for industry stakeholders. The study period spans 2019-2033, with 2025 serving as the base and estimated year. The forecast period covers 2025-2033, while the historical period encompasses 2019-2024. The report projects a market valuation exceeding $xx million by 2033, driven by robust growth across key segments. This in-depth analysis incorporates market sizing, segmentation, competitive landscape, and future growth projections, empowering businesses to make informed strategic decisions.
Hard Piezoelectric Materials Market Concentration & Innovation
The global hard piezoelectric materials market exhibits a moderately concentrated landscape, with key players like Murata, TDK, and Morgan commanding significant market share. However, the presence of several regional and specialized manufacturers indicates a dynamic competitive environment. Innovation is a crucial driver, fueled by advancements in material science and manufacturing processes aiming to enhance piezoelectric properties, such as higher sensitivity and durability. Regulatory frameworks, particularly concerning material safety and environmental impact, influence product development and market access. Substitutes, such as alternative sensing technologies, present a competitive pressure, necessitating continuous innovation. End-user trends towards miniaturization and improved performance drive demand for higher-performing materials. M&A activity has been moderate, with deal values totaling approximately $xx million in the past five years, primarily focused on expanding product portfolios and geographic reach.
- Market Leaders: Murata, TDK, Morgan
- Market Share: Murata (xx%), TDK (xx%), Morgan (xx%), Others (xx%)
- M&A Activity (2019-2024): xx deals, total value $xx million
Hard Piezoelectric Materials Industry Trends & Insights
The hard piezoelectric materials market is experiencing robust growth, propelled by a compound annual growth rate (CAGR) of xx% during the forecast period (2025-2033). Key drivers include the expanding adoption of piezoelectric sensors and actuators in diverse applications across automotive, consumer electronics, healthcare, and industrial automation. Technological disruptions, such as the development of novel materials with enhanced performance characteristics and the integration of advanced manufacturing techniques, further contribute to market expansion. Consumer preferences for smaller, lighter, and more energy-efficient devices are fueling demand for advanced piezoelectric materials. Competitive dynamics are shaped by technological innovation, pricing strategies, and geographic expansion, with established players facing competition from emerging regional manufacturers. Market penetration in developing economies remains significant growth opportunity.
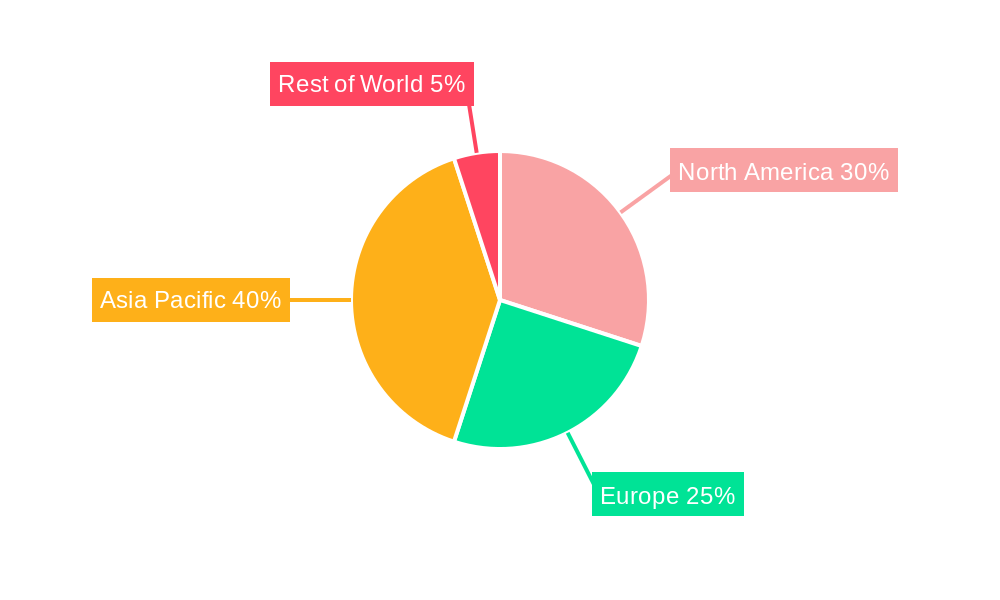
Dominant Markets & Segments in Hard Piezoelectric Materials
The Asia-Pacific region dominates the hard piezoelectric materials market, driven by robust growth in electronics manufacturing and automotive production in countries like China, Japan, and South Korea.
- Key Drivers in Asia-Pacific:
- Strong electronics manufacturing base
- Rapid growth of automotive industry
- Favorable government policies supporting technological advancements
- Expanding consumer electronics market
Europe and North America also hold significant market share, primarily driven by high demand from automotive and industrial sectors. The dominance of the Asia-Pacific region is expected to continue throughout the forecast period due to sustained economic growth and the increasing adoption of advanced technologies. Detailed analysis reveals that the automotive segment holds the largest share of market currently, while the consumer electronics segment is experiencing the fastest growth.
Hard Piezoelectric Materials Product Developments
Recent innovations focus on enhancing material properties, such as improved sensitivity, stability, and temperature resistance. New applications are emerging in energy harvesting, medical devices, and advanced sensors. Competitive advantages are gained through superior material formulations, optimized manufacturing processes, and tailored product designs meeting specific end-user needs. The trend towards miniaturization and integration of piezoelectric components into complex systems drives ongoing product development.
Report Scope & Segmentation Analysis
This report segments the hard piezoelectric materials market by material type (e.g., PZT, PMN-PT), application (automotive, consumer electronics, healthcare, industrial), and region (North America, Europe, Asia-Pacific, Rest of the World). Each segment's market size, growth projections, and competitive dynamics are analyzed in detail. The report also includes a comprehensive analysis of the technological advancements, market drivers, and restraints that are shaping the future of each segment.
Key Drivers of Hard Piezoelectric Materials Growth
The market's growth is primarily driven by increasing demand from the automotive industry (for sensors and actuators in advanced driver-assistance systems), the consumer electronics sector (for applications in smartphones, wearables, and other portable devices), and the healthcare industry (for use in medical imaging and therapeutic devices). Technological advancements in material science, leading to improved piezoelectric properties, and supportive government policies promoting technological innovation also contribute to market growth. Cost reduction in manufacturing processes is playing a significant role in expanding the market's reach.
Challenges in the Hard Piezoelectric Materials Sector
The hard piezoelectric materials sector faces challenges such as the high cost of raw materials, stringent regulatory requirements, and potential supply chain disruptions. Competition from alternative technologies and the need for continuous innovation to meet evolving customer demands also pose significant challenges. Fluctuations in raw material prices can impact profitability, requiring manufacturers to adopt cost-effective sourcing strategies and develop pricing models to mitigate the impact.
Emerging Opportunities in Hard Piezoelectric Materials
Emerging opportunities lie in the development of novel applications, such as energy harvesting from ambient vibrations and the integration of piezoelectric materials into flexible and wearable electronics. Expansion into new geographical markets, particularly developing economies, also presents significant growth potential. Research and development efforts focused on creating more sustainable and environmentally friendly piezoelectric materials are gaining traction, opening new market segments.
Leading Players in the Hard Piezoelectric Materials Market
- Murata
- TDK
- Morgan
- Konghong
- TAIYO YUDEN
- KYOCERA
- CeramTec
- PI Ceramic
- Noliac
- TRS
- KEPO Electronics
- APC International
- Smart Material
- Jiakang Electronics
- Audiowell Electronics
Key Developments in Hard Piezoelectric Materials Industry
- 2022-Q4: Murata launched a new high-performance piezoelectric actuator.
- 2023-Q1: TDK announced a strategic partnership to develop advanced piezoelectric materials for automotive applications.
- 2023-Q2: Morgan acquired a smaller piezoelectric material manufacturer, expanding its product portfolio.
- (Further key developments to be added based on actual data)
Strategic Outlook for Hard Piezoelectric Materials Market
The hard piezoelectric materials market is poised for significant growth in the coming years, driven by technological advancements, increasing demand from diverse end-use sectors, and the emergence of new applications. Strategic investments in R&D, partnerships, and acquisitions are crucial for companies to maintain a competitive edge. Focus on sustainability and environmental concerns will shape future market trends. Companies that can offer innovative products with superior performance characteristics and cost-effectiveness are well-positioned to capitalize on the market’s growth potential.
Hard Piezoelectric Materials Segmentation
-
1. Application
- 1.1. Industrial &Manufacturing
- 1.2. Automotive
- 1.3. Information & Telecommunication
- 1.4. Medical Devices
- 1.5. Others
-
2. Type
- 2.1. Lead Zirconate
- 2.2. Titanate (PZT)
- 2.3. Lead Titanate (PT)
- 2.4. Lead Magnesium Niobate (PMN)
- 2.5. Others
Hard Piezoelectric Materials Segmentation By Geography
-
1. North America
- 1.1. United States
- 1.2. Canada
- 1.3. Mexico
-
2. South America
- 2.1. Brazil
- 2.2. Argentina
- 2.3. Rest of South America
-
3. Europe
- 3.1. United Kingdom
- 3.2. Germany
- 3.3. France
- 3.4. Italy
- 3.5. Spain
- 3.6. Russia
- 3.7. Benelux
- 3.8. Nordics
- 3.9. Rest of Europe
-
4. Middle East & Africa
- 4.1. Turkey
- 4.2. Israel
- 4.3. GCC
- 4.4. North Africa
- 4.5. South Africa
- 4.6. Rest of Middle East & Africa
-
5. Asia Pacific
- 5.1. China
- 5.2. India
- 5.3. Japan
- 5.4. South Korea
- 5.5. ASEAN
- 5.6. Oceania
- 5.7. Rest of Asia Pacific
Hard Piezoelectric Materials Regional Market Share
Geographic Coverage of Hard Piezoelectric Materials
Hard Piezoelectric Materials REPORT HIGHLIGHTS
| Aspects | Details |
|---|---|
| Study Period | 2020-2034 |
| Base Year | 2025 |
| Estimated Year | 2026 |
| Forecast Period | 2026-2034 |
| Historical Period | 2020-2025 |
| Growth Rate | CAGR of 3.5% from 2020-2034 |
| Segmentation |
|
Table of Contents
- 1. Introduction
- 1.1. Research Scope
- 1.2. Market Segmentation
- 1.3. Research Objective
- 1.4. Definitions and Assumptions
- 2. Executive Summary
- 2.1. Market Snapshot
- 3. Market Dynamics
- 3.1. Market Drivers
- 3.2. Market Restrains
- 3.3. Market Trends
- 3.4. Market Opportunities
- 4. Market Factor Analysis
- 4.1. Porters Five Forces
- 4.1.1. Bargaining Power of Suppliers
- 4.1.2. Bargaining Power of Buyers
- 4.1.3. Threat of New Entrants
- 4.1.4. Threat of Substitutes
- 4.1.5. Competitive Rivalry
- 4.2. PESTEL analysis
- 4.3. BCG Analysis
- 4.3.1. Stars (High Growth, High Market Share)
- 4.3.2. Cash Cows (Low Growth, High Market Share)
- 4.3.3. Question Mark (High Growth, Low Market Share)
- 4.3.4. Dogs (Low Growth, Low Market Share)
- 4.4. Ansoff Matrix Analysis
- 4.5. Supply Chain Analysis
- 4.6. Regulatory Landscape
- 4.7. Current Market Potential and Opportunity Assessment (TAM–SAM–SOM Framework)
- 4.8. RAX Analyst Note
- 4.1. Porters Five Forces
- 5. Market Analysis, Insights and Forecast 2021-2033
- 5.1. Market Analysis, Insights and Forecast - by Application
- 5.1.1. Industrial &Manufacturing
- 5.1.2. Automotive
- 5.1.3. Information & Telecommunication
- 5.1.4. Medical Devices
- 5.1.5. Others
- 5.2. Market Analysis, Insights and Forecast - by Type
- 5.2.1. Lead Zirconate
- 5.2.2. Titanate (PZT)
- 5.2.3. Lead Titanate (PT)
- 5.2.4. Lead Magnesium Niobate (PMN)
- 5.2.5. Others
- 5.3. Market Analysis, Insights and Forecast - by Region
- 5.3.1. North America
- 5.3.2. South America
- 5.3.3. Europe
- 5.3.4. Middle East & Africa
- 5.3.5. Asia Pacific
- 5.1. Market Analysis, Insights and Forecast - by Application
- 6. Global Hard Piezoelectric Materials Analysis, Insights and Forecast, 2021-2033
- 6.1. Market Analysis, Insights and Forecast - by Application
- 6.1.1. Industrial &Manufacturing
- 6.1.2. Automotive
- 6.1.3. Information & Telecommunication
- 6.1.4. Medical Devices
- 6.1.5. Others
- 6.2. Market Analysis, Insights and Forecast - by Type
- 6.2.1. Lead Zirconate
- 6.2.2. Titanate (PZT)
- 6.2.3. Lead Titanate (PT)
- 6.2.4. Lead Magnesium Niobate (PMN)
- 6.2.5. Others
- 6.1. Market Analysis, Insights and Forecast - by Application
- 7. North America Hard Piezoelectric Materials Analysis, Insights and Forecast, 2020-2032
- 7.1. Market Analysis, Insights and Forecast - by Application
- 7.1.1. Industrial &Manufacturing
- 7.1.2. Automotive
- 7.1.3. Information & Telecommunication
- 7.1.4. Medical Devices
- 7.1.5. Others
- 7.2. Market Analysis, Insights and Forecast - by Type
- 7.2.1. Lead Zirconate
- 7.2.2. Titanate (PZT)
- 7.2.3. Lead Titanate (PT)
- 7.2.4. Lead Magnesium Niobate (PMN)
- 7.2.5. Others
- 7.1. Market Analysis, Insights and Forecast - by Application
- 8. South America Hard Piezoelectric Materials Analysis, Insights and Forecast, 2020-2032
- 8.1. Market Analysis, Insights and Forecast - by Application
- 8.1.1. Industrial &Manufacturing
- 8.1.2. Automotive
- 8.1.3. Information & Telecommunication
- 8.1.4. Medical Devices
- 8.1.5. Others
- 8.2. Market Analysis, Insights and Forecast - by Type
- 8.2.1. Lead Zirconate
- 8.2.2. Titanate (PZT)
- 8.2.3. Lead Titanate (PT)
- 8.2.4. Lead Magnesium Niobate (PMN)
- 8.2.5. Others
- 8.1. Market Analysis, Insights and Forecast - by Application
- 9. Europe Hard Piezoelectric Materials Analysis, Insights and Forecast, 2020-2032
- 9.1. Market Analysis, Insights and Forecast - by Application
- 9.1.1. Industrial &Manufacturing
- 9.1.2. Automotive
- 9.1.3. Information & Telecommunication
- 9.1.4. Medical Devices
- 9.1.5. Others
- 9.2. Market Analysis, Insights and Forecast - by Type
- 9.2.1. Lead Zirconate
- 9.2.2. Titanate (PZT)
- 9.2.3. Lead Titanate (PT)
- 9.2.4. Lead Magnesium Niobate (PMN)
- 9.2.5. Others
- 9.1. Market Analysis, Insights and Forecast - by Application
- 10. Middle East & Africa Hard Piezoelectric Materials Analysis, Insights and Forecast, 2020-2032
- 10.1. Market Analysis, Insights and Forecast - by Application
- 10.1.1. Industrial &Manufacturing
- 10.1.2. Automotive
- 10.1.3. Information & Telecommunication
- 10.1.4. Medical Devices
- 10.1.5. Others
- 10.2. Market Analysis, Insights and Forecast - by Type
- 10.2.1. Lead Zirconate
- 10.2.2. Titanate (PZT)
- 10.2.3. Lead Titanate (PT)
- 10.2.4. Lead Magnesium Niobate (PMN)
- 10.2.5. Others
- 10.1. Market Analysis, Insights and Forecast - by Application
- 11. Asia Pacific Hard Piezoelectric Materials Analysis, Insights and Forecast, 2020-2032
- 11.1. Market Analysis, Insights and Forecast - by Application
- 11.1.1. Industrial &Manufacturing
- 11.1.2. Automotive
- 11.1.3. Information & Telecommunication
- 11.1.4. Medical Devices
- 11.1.5. Others
- 11.2. Market Analysis, Insights and Forecast - by Type
- 11.2.1. Lead Zirconate
- 11.2.2. Titanate (PZT)
- 11.2.3. Lead Titanate (PT)
- 11.2.4. Lead Magnesium Niobate (PMN)
- 11.2.5. Others
- 11.1. Market Analysis, Insights and Forecast - by Application
- 12. Competitive Analysis
- 12.1. Company Profiles
- 12.1.1 MURATA
- 12.1.1.1. Company Overview
- 12.1.1.2. Products
- 12.1.1.3. Company Financials
- 12.1.1.4. SWOT Analysis
- 12.1.2 TDK
- 12.1.2.1. Company Overview
- 12.1.2.2. Products
- 12.1.2.3. Company Financials
- 12.1.2.4. SWOT Analysis
- 12.1.3 MORGAN
- 12.1.3.1. Company Overview
- 12.1.3.2. Products
- 12.1.3.3. Company Financials
- 12.1.3.4. SWOT Analysis
- 12.1.4 Konghong
- 12.1.4.1. Company Overview
- 12.1.4.2. Products
- 12.1.4.3. Company Financials
- 12.1.4.4. SWOT Analysis
- 12.1.5 TAIYO YUDEN
- 12.1.5.1. Company Overview
- 12.1.5.2. Products
- 12.1.5.3. Company Financials
- 12.1.5.4. SWOT Analysis
- 12.1.6 KYOCERA
- 12.1.6.1. Company Overview
- 12.1.6.2. Products
- 12.1.6.3. Company Financials
- 12.1.6.4. SWOT Analysis
- 12.1.7 CeramTec
- 12.1.7.1. Company Overview
- 12.1.7.2. Products
- 12.1.7.3. Company Financials
- 12.1.7.4. SWOT Analysis
- 12.1.8 PI Ceramic
- 12.1.8.1. Company Overview
- 12.1.8.2. Products
- 12.1.8.3. Company Financials
- 12.1.8.4. SWOT Analysis
- 12.1.9 Noliac
- 12.1.9.1. Company Overview
- 12.1.9.2. Products
- 12.1.9.3. Company Financials
- 12.1.9.4. SWOT Analysis
- 12.1.10 TRS
- 12.1.10.1. Company Overview
- 12.1.10.2. Products
- 12.1.10.3. Company Financials
- 12.1.10.4. SWOT Analysis
- 12.1.11 KEPO Electronics
- 12.1.11.1. Company Overview
- 12.1.11.2. Products
- 12.1.11.3. Company Financials
- 12.1.11.4. SWOT Analysis
- 12.1.12 APC International
- 12.1.12.1. Company Overview
- 12.1.12.2. Products
- 12.1.12.3. Company Financials
- 12.1.12.4. SWOT Analysis
- 12.1.13 Smart Material
- 12.1.13.1. Company Overview
- 12.1.13.2. Products
- 12.1.13.3. Company Financials
- 12.1.13.4. SWOT Analysis
- 12.1.14 Jiakang Electronics
- 12.1.14.1. Company Overview
- 12.1.14.2. Products
- 12.1.14.3. Company Financials
- 12.1.14.4. SWOT Analysis
- 12.1.15 Audiowell Electronics
- 12.1.15.1. Company Overview
- 12.1.15.2. Products
- 12.1.15.3. Company Financials
- 12.1.15.4. SWOT Analysis
- 12.1.1 MURATA
- 12.2. Market Entropy
- 12.2.1 Company's Key Areas Served
- 12.2.2 Recent Developments
- 12.3. Company Market Share Analysis 2025
- 12.3.1 Top 5 Companies Market Share Analysis
- 12.3.2 Top 3 Companies Market Share Analysis
- 12.4. List of Potential Customers
- 13. Research Methodology
List of Figures
- Figure 1: Global Hard Piezoelectric Materials Revenue Breakdown (million, %) by Region 2025 & 2033
- Figure 2: North America Hard Piezoelectric Materials Revenue (million), by Application 2025 & 2033
- Figure 3: North America Hard Piezoelectric Materials Revenue Share (%), by Application 2025 & 2033
- Figure 4: North America Hard Piezoelectric Materials Revenue (million), by Type 2025 & 2033
- Figure 5: North America Hard Piezoelectric Materials Revenue Share (%), by Type 2025 & 2033
- Figure 6: North America Hard Piezoelectric Materials Revenue (million), by Country 2025 & 2033
- Figure 7: North America Hard Piezoelectric Materials Revenue Share (%), by Country 2025 & 2033
- Figure 8: South America Hard Piezoelectric Materials Revenue (million), by Application 2025 & 2033
- Figure 9: South America Hard Piezoelectric Materials Revenue Share (%), by Application 2025 & 2033
- Figure 10: South America Hard Piezoelectric Materials Revenue (million), by Type 2025 & 2033
- Figure 11: South America Hard Piezoelectric Materials Revenue Share (%), by Type 2025 & 2033
- Figure 12: South America Hard Piezoelectric Materials Revenue (million), by Country 2025 & 2033
- Figure 13: South America Hard Piezoelectric Materials Revenue Share (%), by Country 2025 & 2033
- Figure 14: Europe Hard Piezoelectric Materials Revenue (million), by Application 2025 & 2033
- Figure 15: Europe Hard Piezoelectric Materials Revenue Share (%), by Application 2025 & 2033
- Figure 16: Europe Hard Piezoelectric Materials Revenue (million), by Type 2025 & 2033
- Figure 17: Europe Hard Piezoelectric Materials Revenue Share (%), by Type 2025 & 2033
- Figure 18: Europe Hard Piezoelectric Materials Revenue (million), by Country 2025 & 2033
- Figure 19: Europe Hard Piezoelectric Materials Revenue Share (%), by Country 2025 & 2033
- Figure 20: Middle East & Africa Hard Piezoelectric Materials Revenue (million), by Application 2025 & 2033
- Figure 21: Middle East & Africa Hard Piezoelectric Materials Revenue Share (%), by Application 2025 & 2033
- Figure 22: Middle East & Africa Hard Piezoelectric Materials Revenue (million), by Type 2025 & 2033
- Figure 23: Middle East & Africa Hard Piezoelectric Materials Revenue Share (%), by Type 2025 & 2033
- Figure 24: Middle East & Africa Hard Piezoelectric Materials Revenue (million), by Country 2025 & 2033
- Figure 25: Middle East & Africa Hard Piezoelectric Materials Revenue Share (%), by Country 2025 & 2033
- Figure 26: Asia Pacific Hard Piezoelectric Materials Revenue (million), by Application 2025 & 2033
- Figure 27: Asia Pacific Hard Piezoelectric Materials Revenue Share (%), by Application 2025 & 2033
- Figure 28: Asia Pacific Hard Piezoelectric Materials Revenue (million), by Type 2025 & 2033
- Figure 29: Asia Pacific Hard Piezoelectric Materials Revenue Share (%), by Type 2025 & 2033
- Figure 30: Asia Pacific Hard Piezoelectric Materials Revenue (million), by Country 2025 & 2033
- Figure 31: Asia Pacific Hard Piezoelectric Materials Revenue Share (%), by Country 2025 & 2033
List of Tables
- Table 1: Global Hard Piezoelectric Materials Revenue million Forecast, by Application 2020 & 2033
- Table 2: Global Hard Piezoelectric Materials Revenue million Forecast, by Type 2020 & 2033
- Table 3: Global Hard Piezoelectric Materials Revenue million Forecast, by Region 2020 & 2033
- Table 4: Global Hard Piezoelectric Materials Revenue million Forecast, by Application 2020 & 2033
- Table 5: Global Hard Piezoelectric Materials Revenue million Forecast, by Type 2020 & 2033
- Table 6: Global Hard Piezoelectric Materials Revenue million Forecast, by Country 2020 & 2033
- Table 7: United States Hard Piezoelectric Materials Revenue (million) Forecast, by Application 2020 & 2033
- Table 8: Canada Hard Piezoelectric Materials Revenue (million) Forecast, by Application 2020 & 2033
- Table 9: Mexico Hard Piezoelectric Materials Revenue (million) Forecast, by Application 2020 & 2033
- Table 10: Global Hard Piezoelectric Materials Revenue million Forecast, by Application 2020 & 2033
- Table 11: Global Hard Piezoelectric Materials Revenue million Forecast, by Type 2020 & 2033
- Table 12: Global Hard Piezoelectric Materials Revenue million Forecast, by Country 2020 & 2033
- Table 13: Brazil Hard Piezoelectric Materials Revenue (million) Forecast, by Application 2020 & 2033
- Table 14: Argentina Hard Piezoelectric Materials Revenue (million) Forecast, by Application 2020 & 2033
- Table 15: Rest of South America Hard Piezoelectric Materials Revenue (million) Forecast, by Application 2020 & 2033
- Table 16: Global Hard Piezoelectric Materials Revenue million Forecast, by Application 2020 & 2033
- Table 17: Global Hard Piezoelectric Materials Revenue million Forecast, by Type 2020 & 2033
- Table 18: Global Hard Piezoelectric Materials Revenue million Forecast, by Country 2020 & 2033
- Table 19: United Kingdom Hard Piezoelectric Materials Revenue (million) Forecast, by Application 2020 & 2033
- Table 20: Germany Hard Piezoelectric Materials Revenue (million) Forecast, by Application 2020 & 2033
- Table 21: France Hard Piezoelectric Materials Revenue (million) Forecast, by Application 2020 & 2033
- Table 22: Italy Hard Piezoelectric Materials Revenue (million) Forecast, by Application 2020 & 2033
- Table 23: Spain Hard Piezoelectric Materials Revenue (million) Forecast, by Application 2020 & 2033
- Table 24: Russia Hard Piezoelectric Materials Revenue (million) Forecast, by Application 2020 & 2033
- Table 25: Benelux Hard Piezoelectric Materials Revenue (million) Forecast, by Application 2020 & 2033
- Table 26: Nordics Hard Piezoelectric Materials Revenue (million) Forecast, by Application 2020 & 2033
- Table 27: Rest of Europe Hard Piezoelectric Materials Revenue (million) Forecast, by Application 2020 & 2033
- Table 28: Global Hard Piezoelectric Materials Revenue million Forecast, by Application 2020 & 2033
- Table 29: Global Hard Piezoelectric Materials Revenue million Forecast, by Type 2020 & 2033
- Table 30: Global Hard Piezoelectric Materials Revenue million Forecast, by Country 2020 & 2033
- Table 31: Turkey Hard Piezoelectric Materials Revenue (million) Forecast, by Application 2020 & 2033
- Table 32: Israel Hard Piezoelectric Materials Revenue (million) Forecast, by Application 2020 & 2033
- Table 33: GCC Hard Piezoelectric Materials Revenue (million) Forecast, by Application 2020 & 2033
- Table 34: North Africa Hard Piezoelectric Materials Revenue (million) Forecast, by Application 2020 & 2033
- Table 35: South Africa Hard Piezoelectric Materials Revenue (million) Forecast, by Application 2020 & 2033
- Table 36: Rest of Middle East & Africa Hard Piezoelectric Materials Revenue (million) Forecast, by Application 2020 & 2033
- Table 37: Global Hard Piezoelectric Materials Revenue million Forecast, by Application 2020 & 2033
- Table 38: Global Hard Piezoelectric Materials Revenue million Forecast, by Type 2020 & 2033
- Table 39: Global Hard Piezoelectric Materials Revenue million Forecast, by Country 2020 & 2033
- Table 40: China Hard Piezoelectric Materials Revenue (million) Forecast, by Application 2020 & 2033
- Table 41: India Hard Piezoelectric Materials Revenue (million) Forecast, by Application 2020 & 2033
- Table 42: Japan Hard Piezoelectric Materials Revenue (million) Forecast, by Application 2020 & 2033
- Table 43: South Korea Hard Piezoelectric Materials Revenue (million) Forecast, by Application 2020 & 2033
- Table 44: ASEAN Hard Piezoelectric Materials Revenue (million) Forecast, by Application 2020 & 2033
- Table 45: Oceania Hard Piezoelectric Materials Revenue (million) Forecast, by Application 2020 & 2033
- Table 46: Rest of Asia Pacific Hard Piezoelectric Materials Revenue (million) Forecast, by Application 2020 & 2033
Frequently Asked Questions
1. What is the projected Compound Annual Growth Rate (CAGR) of the Hard Piezoelectric Materials?
The projected CAGR is approximately 3.5%.
2. Which companies are prominent players in the Hard Piezoelectric Materials?
Key companies in the market include MURATA, TDK, MORGAN, Konghong, TAIYO YUDEN, KYOCERA, CeramTec, PI Ceramic, Noliac, TRS, KEPO Electronics, APC International, Smart Material, Jiakang Electronics, Audiowell Electronics.
3. What are the main segments of the Hard Piezoelectric Materials?
The market segments include Application, Type.
4. Can you provide details about the market size?
The market size is estimated to be USD 10090 million as of 2022.
5. What are some drivers contributing to market growth?
N/A
6. What are the notable trends driving market growth?
N/A
7. Are there any restraints impacting market growth?
N/A
8. Can you provide examples of recent developments in the market?
N/A
9. What pricing options are available for accessing the report?
Pricing options include single-user, multi-user, and enterprise licenses priced at USD 4900.00, USD 7350.00, and USD 9800.00 respectively.
10. Is the market size provided in terms of value or volume?
The market size is provided in terms of value, measured in million.
11. Are there any specific market keywords associated with the report?
Yes, the market keyword associated with the report is "Hard Piezoelectric Materials," which aids in identifying and referencing the specific market segment covered.
12. How do I determine which pricing option suits my needs best?
The pricing options vary based on user requirements and access needs. Individual users may opt for single-user licenses, while businesses requiring broader access may choose multi-user or enterprise licenses for cost-effective access to the report.
13. Are there any additional resources or data provided in the Hard Piezoelectric Materials report?
While the report offers comprehensive insights, it's advisable to review the specific contents or supplementary materials provided to ascertain if additional resources or data are available.
14. How can I stay updated on further developments or reports in the Hard Piezoelectric Materials?
To stay informed about further developments, trends, and reports in the Hard Piezoelectric Materials, consider subscribing to industry newsletters, following relevant companies and organizations, or regularly checking reputable industry news sources and publications.
Methodology
Step 1 - Identification of Relevant Samples Size from Population Database


Step 2 - Approaches for Defining Global Market Size (Value, Volume* & Price*)

Note*: In applicable scenarios
Step 3 - Data Sources
Primary Research
- Web Analytics
- Survey Reports
- Research Institute
- Latest Research Reports
- Opinion Leaders
Secondary Research
- Annual Reports
- White Paper
- Latest Press Release
- Industry Association
- Paid Database
- Investor Presentations

Step 4 - Data Triangulation
Involves using different sources of information in order to increase the validity of a study
These sources are likely to be stakeholders in a program - participants, other researchers, program staff, other community members, and so on.
Then we put all data in single framework & apply various statistical tools to find out the dynamic on the market.
During the analysis stage, feedback from the stakeholder groups would be compared to determine areas of agreement as well as areas of divergence