

Key Insights
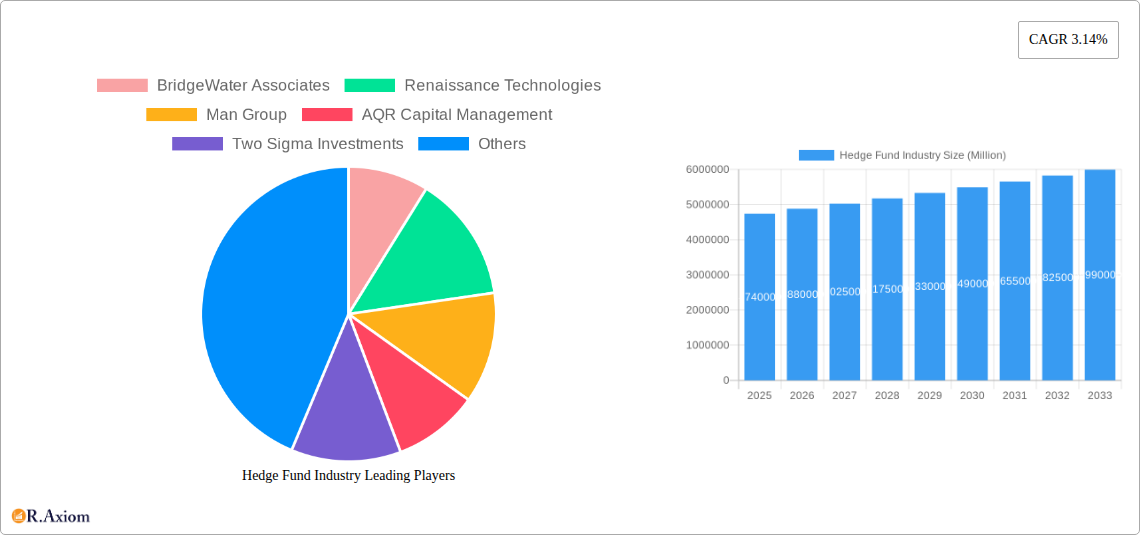
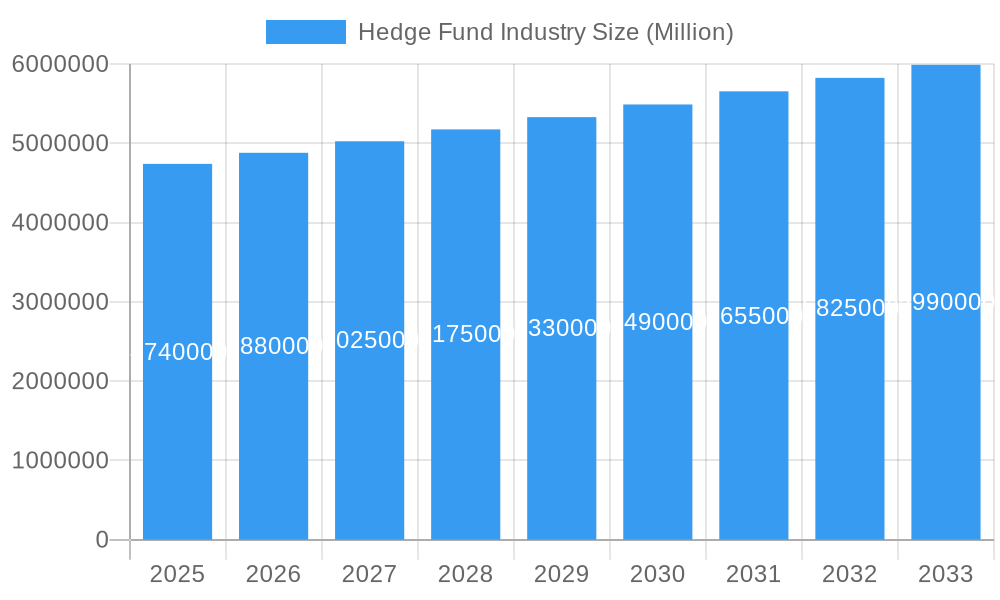
The global hedge fund industry, currently valued at $4.74 trillion (2025 estimate), is projected to experience steady growth, with a Compound Annual Growth Rate (CAGR) of 3.14% from 2025 to 2033. This growth is driven by several factors. Increasing global wealth and the ongoing search for alternative investment strategies are key contributors. Sophisticated investors continue to seek higher returns than traditional asset classes can offer, fueling demand for hedge funds' diverse investment approaches. Technological advancements, particularly in areas like artificial intelligence and machine learning, are also impacting the industry, allowing for more efficient portfolio management and risk assessment. However, regulatory scrutiny, particularly concerning transparency and fees, represents a persistent challenge. Furthermore, the cyclical nature of market performance and potential macroeconomic headwinds, like inflation and geopolitical instability, could influence future growth trajectories. Competition remains fierce among established players like Bridgewater Associates, Renaissance Technologies, and BlackRock, alongside a growing number of smaller, specialized funds.
Hedge Fund Industry Market Size (In Million)
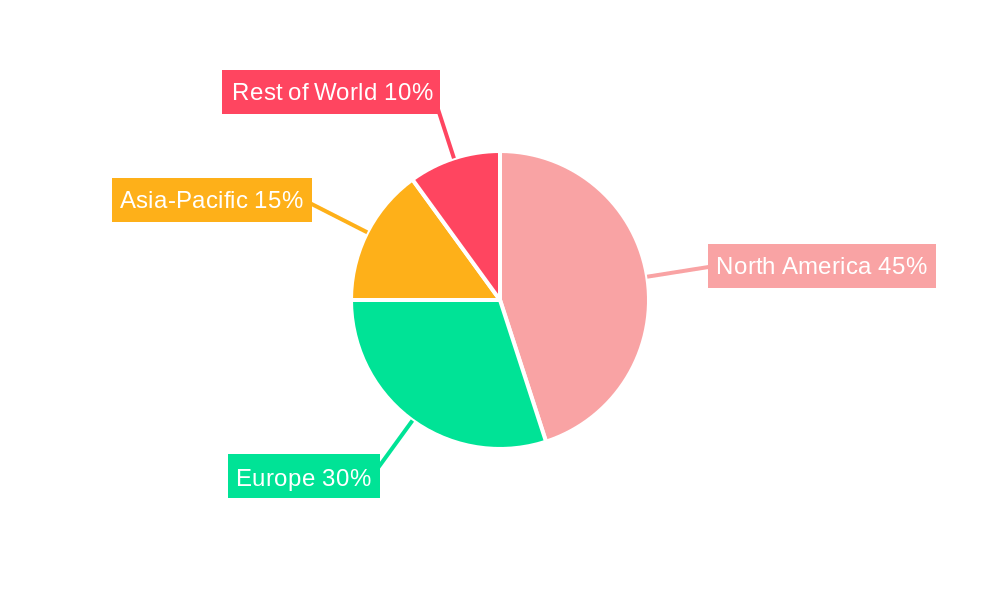
The industry's segmentation is diverse, encompassing long-short equity, global macro, event-driven, and quantitative strategies, each with its unique risk-reward profile and investor base. Regional distribution likely mirrors existing global financial center concentrations, with North America and Europe holding significant market share. The forecast period (2025-2033) anticipates continued, albeit moderated, growth, driven by the factors mentioned above. While the inherent volatility of hedge fund returns presents inherent risk, the industry’s long-term outlook remains positive, supported by the persistent need for sophisticated investment vehicles in a dynamic global financial landscape. The continued evolution of investment strategies and the adoption of new technologies are expected to shape the industry's future development.
Hedge Fund Industry Company Market Share
Hedge Fund Industry: Market Analysis & Forecast Report (2019-2033)
This comprehensive report provides a detailed analysis of the global hedge fund industry, offering invaluable insights for investors, industry professionals, and strategic decision-makers. Covering the period from 2019 to 2033, with a focus on 2025, this report offers a meticulous examination of market dynamics, competitive landscapes, and future growth potential. The report incorporates extensive data and analysis, offering actionable insights for navigating the complexities of this dynamic sector.
Hedge Fund Industry Market Concentration & Innovation
The global hedge fund industry is characterized by significant concentration, with a few dominant players controlling a substantial market share. While precise market share figures fluctuate, top firms like Bridgewater Associates, Renaissance Technologies, and Man Group consistently hold leading positions, managing assets exceeding $100 Billion each. Innovation within the industry is driven by advancements in quantitative strategies, algorithmic trading, and the adoption of artificial intelligence and machine learning. This technological disruption is reshaping the investment landscape, driving higher returns but also increasing regulatory scrutiny. Mergers and acquisitions (M&A) activity remains a key feature, with deal values reaching into the billions. For example, the recent acquisition of Hivemind Software by Two Sigma illustrates a trend towards integrating advanced data analytics capabilities. Regulatory frameworks, including stricter compliance standards, continue to evolve, impacting operational costs and strategies. The increasing popularity of alternative investment strategies, both within and outside the hedge fund realm, presents a potent force shaping industry dynamics. Finally, the growing demand for ESG (Environmental, Social, and Governance) compliant investment strategies is also influencing how hedge fund firms structure their products and portfolios.
- Top 3 Players (Estimated 2025 Market Share): Bridgewater Associates (xx%), Renaissance Technologies (xx%), Man Group (xx%). These figures are estimates due to the private nature of many firms.
- M&A Activity (2019-2024): Total deal value exceeding $xx Billion.
- Average Deal Size (2019-2024): $xx Million.
Hedge Fund Industry Industry Trends & Insights
The global hedge fund industry is witnessing robust growth, driven by several key factors. The industry is experiencing a Compound Annual Growth Rate (CAGR) of xx% during the forecast period (2025-2033). Increased investor interest in alternative investments and a rising demand for sophisticated risk management strategies are contributing significantly to market expansion. Market penetration is expected to reach xx% by 2033, driven by continued globalization and technological advancements. The adoption of artificial intelligence (AI) and machine learning (ML) is transforming investment strategies, enhancing efficiency, and enabling the analysis of vast datasets. However, competitive dynamics remain intense, with firms continuously innovating to retain market share. Changing consumer preferences toward ESG-focused investments are forcing adaptation, and the industry is facing regulatory pressure to enhance transparency and accountability.
Dominant Markets & Segments in Hedge Fund Industry
The United States remains the dominant market for hedge funds, accounting for the largest share of global assets under management (AUM). This dominance is attributed to several factors:
- Robust Financial Infrastructure: Well-developed capital markets, sophisticated regulatory frameworks (despite ongoing evolution), and a large pool of high-net-worth individuals and institutional investors.
- Supportive Economic Policies: Policies that generally favor business development and investment have historically fostered a thriving hedge fund environment.
- Talent Pool: The US possesses a large pool of skilled financial professionals, attracting top talent to the industry.
Other key regions, such as Europe and Asia, also exhibit significant growth, though their overall market share remains lower than that of the US. Specific countries like the UK and Hong Kong continue to be key players within their respective regions.
Hedge Fund Industry Product Developments
Recent product innovations include sophisticated quantitative strategies, AI-driven algorithms, and ESG-focused investment products. These developments are designed to enhance risk-adjusted returns, optimize portfolio diversification, and appeal to the growing demand for sustainable investment options. The competitive advantage lies in the proprietary algorithms and data analytics capabilities that underpin many of these innovative offerings. The market fit is excellent for institutional and high-net-worth investors seeking alpha generation and superior risk management.
Report Scope & Segmentation Analysis
This report segments the hedge fund industry based on strategy (e.g., long/short equity, quantitative, macro, distressed debt), asset class (e.g., equity, fixed income, derivatives), investor type (e.g., institutional, high-net-worth individuals), and geographic region. Each segment's growth projections, market size estimates, and competitive dynamics are analyzed in detail.
Key Drivers of Hedge Fund Industry Growth
Several factors are driving the growth of the hedge fund industry:
- Technological advancements: AI, ML, and big data analytics improve investment strategies and portfolio management.
- Favorable regulatory environment (in certain jurisdictions): While regulatory scrutiny is increasing, many jurisdictions maintain relatively favorable conditions for hedge fund operations.
- Increased demand for alternative investments: Institutional and high-net-worth investors are diversifying portfolios to include hedge funds.
Challenges in the Hedge Fund Industry Sector
The hedge fund industry faces several challenges:
- Increased regulatory scrutiny: Compliance costs are rising due to heightened regulatory requirements.
- Competitive pressures: Intense rivalry among firms drives down fees and profitability.
- Economic downturns: Market volatility can significantly impact investment performance.
Emerging Opportunities in Hedge Fund Industry
The hedge fund industry is presented with several emerging opportunities:
- ESG investing: Growing demand for sustainable and responsible investments.
- Private markets: Expansion into alternative asset classes like private equity and real estate.
- Technological advancements: Leveraging AI and other technologies to enhance efficiency.
Leading Players in the Hedge Fund Industry Market
Key Developments in Hedge Fund Industry Industry
- November 2022: BlackRock Alternatives acquired Jupiter Power LLC, expanding its presence in the renewable energy storage sector. This signals a growing interest from major financial players in sustainable infrastructure investments.
- August 2022: Two Sigma's acquisition of Hivemind Software demonstrates the ongoing trend of integrating advanced data analytics and AI capabilities to enhance investment strategies. This acquisition underscores the importance of data-driven decision-making in the competitive hedge fund landscape.
Strategic Outlook for Hedge Fund Industry Market
The future of the hedge fund industry is characterized by continued growth, albeit at a potentially moderated pace compared to previous years. Technological innovation will remain a critical driver, with AI and machine learning playing an increasingly important role in investment strategies and risk management. The demand for ESG-compliant investments will continue to rise, presenting both challenges and opportunities for firms to adapt their investment approaches and product offerings. The overall outlook suggests a resilient, yet evolving industry, characterized by increased competition and ongoing adaptation to meet evolving investor preferences and technological disruptions.
Hedge Fund Industry Segmentation
-
1. Core Strategy
- 1.1. Equity Strategies
- 1.2. Macro Strategies
- 1.3. Event Driven Strategies
- 1.4. Credit Strategies
- 1.5. Relative Value Strategies
- 1.6. Niche Strategies
- 1.7. Multi-Strategy
- 1.8. Managed Futures/CTA Strategies
-
2. Manager Location
-
2.1. North America
- 2.1.1. United states
- 2.1.2. Canada
- 2.1.3. Mexico
-
2.2. Europe
- 2.2.1. United Kingdom
- 2.2.2. Sweden
- 2.2.3. France
- 2.2.4. Switzerland
- 2.2.5. Rest of Europe
-
2.3. Asia-Pacific
- 2.3.1. Hong Kong
- 2.3.2. Australia
- 2.3.3. Rest of Asia-Pacific
-
2.4. Latin America
- 2.4.1. Brazil
- 2.4.2. Rest of Latin America
-
2.5. Middle East and Africa
- 2.5.1. United Arab Emirates
- 2.5.2. Saudi Arabia
- 2.5.3. Rest of Middle East and Africa
-
2.1. North America
Hedge Fund Industry Segmentation By Geography
-
1. North America
- 1.1. United States
- 1.2. Canada
- 1.3. Mexico
-
2. South America
- 2.1. Brazil
- 2.2. Argentina
- 2.3. Rest of South America
-
3. Europe
- 3.1. United Kingdom
- 3.2. Germany
- 3.3. France
- 3.4. Italy
- 3.5. Spain
- 3.6. Russia
- 3.7. Benelux
- 3.8. Nordics
- 3.9. Rest of Europe
-
4. Middle East & Africa
- 4.1. Turkey
- 4.2. Israel
- 4.3. GCC
- 4.4. North Africa
- 4.5. South Africa
- 4.6. Rest of Middle East & Africa
-
5. Asia Pacific
- 5.1. China
- 5.2. India
- 5.3. Japan
- 5.4. South Korea
- 5.5. ASEAN
- 5.6. Oceania
- 5.7. Rest of Asia Pacific
Hedge Fund Industry Regional Market Share
Geographic Coverage of Hedge Fund Industry
Hedge Fund Industry REPORT HIGHLIGHTS
| Aspects | Details |
|---|---|
| Study Period | 2020-2034 |
| Base Year | 2025 |
| Estimated Year | 2026 |
| Forecast Period | 2026-2034 |
| Historical Period | 2020-2025 |
| Growth Rate | CAGR of 3.14% from 2020-2034 |
| Segmentation |
|
Table of Contents
- 1. Introduction
- 1.1. Research Scope
- 1.2. Market Segmentation
- 1.3. Research Objective
- 1.4. Definitions and Assumptions
- 2. Executive Summary
- 2.1. Market Snapshot
- 3. Market Dynamics
- 3.1. Market Drivers
- 3.2. Market Restrains
- 3.3. Market Trends
- 3.4. Market Opportunities
- 4. Market Factor Analysis
- 4.1. Porters Five Forces
- 4.1.1. Bargaining Power of Suppliers
- 4.1.2. Bargaining Power of Buyers
- 4.1.3. Threat of New Entrants
- 4.1.4. Threat of Substitutes
- 4.1.5. Competitive Rivalry
- 4.2. PESTEL analysis
- 4.3. BCG Analysis
- 4.3.1. Stars (High Growth, High Market Share)
- 4.3.2. Cash Cows (Low Growth, High Market Share)
- 4.3.3. Question Mark (High Growth, Low Market Share)
- 4.3.4. Dogs (Low Growth, Low Market Share)
- 4.4. Ansoff Matrix Analysis
- 4.5. Supply Chain Analysis
- 4.6. Regulatory Landscape
- 4.7. Current Market Potential and Opportunity Assessment (TAM–SAM–SOM Framework)
- 4.8. RAX Analyst Note
- 4.1. Porters Five Forces
- 5. Market Analysis, Insights and Forecast 2021-2033
- 5.1. Market Analysis, Insights and Forecast - by Core Strategy
- 5.1.1. Equity Strategies
- 5.1.2. Macro Strategies
- 5.1.3. Event Driven Strategies
- 5.1.4. Credit Strategies
- 5.1.5. Relative Value Strategies
- 5.1.6. Niche Strategies
- 5.1.7. Multi-Strategy
- 5.1.8. Managed Futures/CTA Strategies
- 5.2. Market Analysis, Insights and Forecast - by Manager Location
- 5.2.1. North America
- 5.2.1.1. United states
- 5.2.1.2. Canada
- 5.2.1.3. Mexico
- 5.2.2. Europe
- 5.2.2.1. United Kingdom
- 5.2.2.2. Sweden
- 5.2.2.3. France
- 5.2.2.4. Switzerland
- 5.2.2.5. Rest of Europe
- 5.2.3. Asia-Pacific
- 5.2.3.1. Hong Kong
- 5.2.3.2. Australia
- 5.2.3.3. Rest of Asia-Pacific
- 5.2.4. Latin America
- 5.2.4.1. Brazil
- 5.2.4.2. Rest of Latin America
- 5.2.5. Middle East and Africa
- 5.2.5.1. United Arab Emirates
- 5.2.5.2. Saudi Arabia
- 5.2.5.3. Rest of Middle East and Africa
- 5.2.1. North America
- 5.3. Market Analysis, Insights and Forecast - by Region
- 5.3.1. North America
- 5.3.2. South America
- 5.3.3. Europe
- 5.3.4. Middle East & Africa
- 5.3.5. Asia Pacific
- 5.1. Market Analysis, Insights and Forecast - by Core Strategy
- 6. Global Hedge Fund Industry Analysis, Insights and Forecast, 2021-2033
- 6.1. Market Analysis, Insights and Forecast - by Core Strategy
- 6.1.1. Equity Strategies
- 6.1.2. Macro Strategies
- 6.1.3. Event Driven Strategies
- 6.1.4. Credit Strategies
- 6.1.5. Relative Value Strategies
- 6.1.6. Niche Strategies
- 6.1.7. Multi-Strategy
- 6.1.8. Managed Futures/CTA Strategies
- 6.2. Market Analysis, Insights and Forecast - by Manager Location
- 6.2.1. North America
- 6.2.1.1. United states
- 6.2.1.2. Canada
- 6.2.1.3. Mexico
- 6.2.2. Europe
- 6.2.2.1. United Kingdom
- 6.2.2.2. Sweden
- 6.2.2.3. France
- 6.2.2.4. Switzerland
- 6.2.2.5. Rest of Europe
- 6.2.3. Asia-Pacific
- 6.2.3.1. Hong Kong
- 6.2.3.2. Australia
- 6.2.3.3. Rest of Asia-Pacific
- 6.2.4. Latin America
- 6.2.4.1. Brazil
- 6.2.4.2. Rest of Latin America
- 6.2.5. Middle East and Africa
- 6.2.5.1. United Arab Emirates
- 6.2.5.2. Saudi Arabia
- 6.2.5.3. Rest of Middle East and Africa
- 6.2.1. North America
- 6.1. Market Analysis, Insights and Forecast - by Core Strategy
- 7. North America Hedge Fund Industry Analysis, Insights and Forecast, 2020-2032
- 7.1. Market Analysis, Insights and Forecast - by Core Strategy
- 7.1.1. Equity Strategies
- 7.1.2. Macro Strategies
- 7.1.3. Event Driven Strategies
- 7.1.4. Credit Strategies
- 7.1.5. Relative Value Strategies
- 7.1.6. Niche Strategies
- 7.1.7. Multi-Strategy
- 7.1.8. Managed Futures/CTA Strategies
- 7.2. Market Analysis, Insights and Forecast - by Manager Location
- 7.2.1. North America
- 7.2.1.1. United states
- 7.2.1.2. Canada
- 7.2.1.3. Mexico
- 7.2.2. Europe
- 7.2.2.1. United Kingdom
- 7.2.2.2. Sweden
- 7.2.2.3. France
- 7.2.2.4. Switzerland
- 7.2.2.5. Rest of Europe
- 7.2.3. Asia-Pacific
- 7.2.3.1. Hong Kong
- 7.2.3.2. Australia
- 7.2.3.3. Rest of Asia-Pacific
- 7.2.4. Latin America
- 7.2.4.1. Brazil
- 7.2.4.2. Rest of Latin America
- 7.2.5. Middle East and Africa
- 7.2.5.1. United Arab Emirates
- 7.2.5.2. Saudi Arabia
- 7.2.5.3. Rest of Middle East and Africa
- 7.2.1. North America
- 7.1. Market Analysis, Insights and Forecast - by Core Strategy
- 8. South America Hedge Fund Industry Analysis, Insights and Forecast, 2020-2032
- 8.1. Market Analysis, Insights and Forecast - by Core Strategy
- 8.1.1. Equity Strategies
- 8.1.2. Macro Strategies
- 8.1.3. Event Driven Strategies
- 8.1.4. Credit Strategies
- 8.1.5. Relative Value Strategies
- 8.1.6. Niche Strategies
- 8.1.7. Multi-Strategy
- 8.1.8. Managed Futures/CTA Strategies
- 8.2. Market Analysis, Insights and Forecast - by Manager Location
- 8.2.1. North America
- 8.2.1.1. United states
- 8.2.1.2. Canada
- 8.2.1.3. Mexico
- 8.2.2. Europe
- 8.2.2.1. United Kingdom
- 8.2.2.2. Sweden
- 8.2.2.3. France
- 8.2.2.4. Switzerland
- 8.2.2.5. Rest of Europe
- 8.2.3. Asia-Pacific
- 8.2.3.1. Hong Kong
- 8.2.3.2. Australia
- 8.2.3.3. Rest of Asia-Pacific
- 8.2.4. Latin America
- 8.2.4.1. Brazil
- 8.2.4.2. Rest of Latin America
- 8.2.5. Middle East and Africa
- 8.2.5.1. United Arab Emirates
- 8.2.5.2. Saudi Arabia
- 8.2.5.3. Rest of Middle East and Africa
- 8.2.1. North America
- 8.1. Market Analysis, Insights and Forecast - by Core Strategy
- 9. Europe Hedge Fund Industry Analysis, Insights and Forecast, 2020-2032
- 9.1. Market Analysis, Insights and Forecast - by Core Strategy
- 9.1.1. Equity Strategies
- 9.1.2. Macro Strategies
- 9.1.3. Event Driven Strategies
- 9.1.4. Credit Strategies
- 9.1.5. Relative Value Strategies
- 9.1.6. Niche Strategies
- 9.1.7. Multi-Strategy
- 9.1.8. Managed Futures/CTA Strategies
- 9.2. Market Analysis, Insights and Forecast - by Manager Location
- 9.2.1. North America
- 9.2.1.1. United states
- 9.2.1.2. Canada
- 9.2.1.3. Mexico
- 9.2.2. Europe
- 9.2.2.1. United Kingdom
- 9.2.2.2. Sweden
- 9.2.2.3. France
- 9.2.2.4. Switzerland
- 9.2.2.5. Rest of Europe
- 9.2.3. Asia-Pacific
- 9.2.3.1. Hong Kong
- 9.2.3.2. Australia
- 9.2.3.3. Rest of Asia-Pacific
- 9.2.4. Latin America
- 9.2.4.1. Brazil
- 9.2.4.2. Rest of Latin America
- 9.2.5. Middle East and Africa
- 9.2.5.1. United Arab Emirates
- 9.2.5.2. Saudi Arabia
- 9.2.5.3. Rest of Middle East and Africa
- 9.2.1. North America
- 9.1. Market Analysis, Insights and Forecast - by Core Strategy
- 10. Middle East & Africa Hedge Fund Industry Analysis, Insights and Forecast, 2020-2032
- 10.1. Market Analysis, Insights and Forecast - by Core Strategy
- 10.1.1. Equity Strategies
- 10.1.2. Macro Strategies
- 10.1.3. Event Driven Strategies
- 10.1.4. Credit Strategies
- 10.1.5. Relative Value Strategies
- 10.1.6. Niche Strategies
- 10.1.7. Multi-Strategy
- 10.1.8. Managed Futures/CTA Strategies
- 10.2. Market Analysis, Insights and Forecast - by Manager Location
- 10.2.1. North America
- 10.2.1.1. United states
- 10.2.1.2. Canada
- 10.2.1.3. Mexico
- 10.2.2. Europe
- 10.2.2.1. United Kingdom
- 10.2.2.2. Sweden
- 10.2.2.3. France
- 10.2.2.4. Switzerland
- 10.2.2.5. Rest of Europe
- 10.2.3. Asia-Pacific
- 10.2.3.1. Hong Kong
- 10.2.3.2. Australia
- 10.2.3.3. Rest of Asia-Pacific
- 10.2.4. Latin America
- 10.2.4.1. Brazil
- 10.2.4.2. Rest of Latin America
- 10.2.5. Middle East and Africa
- 10.2.5.1. United Arab Emirates
- 10.2.5.2. Saudi Arabia
- 10.2.5.3. Rest of Middle East and Africa
- 10.2.1. North America
- 10.1. Market Analysis, Insights and Forecast - by Core Strategy
- 11. Asia Pacific Hedge Fund Industry Analysis, Insights and Forecast, 2020-2032
- 11.1. Market Analysis, Insights and Forecast - by Core Strategy
- 11.1.1. Equity Strategies
- 11.1.2. Macro Strategies
- 11.1.3. Event Driven Strategies
- 11.1.4. Credit Strategies
- 11.1.5. Relative Value Strategies
- 11.1.6. Niche Strategies
- 11.1.7. Multi-Strategy
- 11.1.8. Managed Futures/CTA Strategies
- 11.2. Market Analysis, Insights and Forecast - by Manager Location
- 11.2.1. North America
- 11.2.1.1. United states
- 11.2.1.2. Canada
- 11.2.1.3. Mexico
- 11.2.2. Europe
- 11.2.2.1. United Kingdom
- 11.2.2.2. Sweden
- 11.2.2.3. France
- 11.2.2.4. Switzerland
- 11.2.2.5. Rest of Europe
- 11.2.3. Asia-Pacific
- 11.2.3.1. Hong Kong
- 11.2.3.2. Australia
- 11.2.3.3. Rest of Asia-Pacific
- 11.2.4. Latin America
- 11.2.4.1. Brazil
- 11.2.4.2. Rest of Latin America
- 11.2.5. Middle East and Africa
- 11.2.5.1. United Arab Emirates
- 11.2.5.2. Saudi Arabia
- 11.2.5.3. Rest of Middle East and Africa
- 11.2.1. North America
- 11.1. Market Analysis, Insights and Forecast - by Core Strategy
- 12. Competitive Analysis
- 12.1. Company Profiles
- 12.1.1 BridgeWater Associates
- 12.1.1.1. Company Overview
- 12.1.1.2. Products
- 12.1.1.3. Company Financials
- 12.1.1.4. SWOT Analysis
- 12.1.2 Renaissance Technologies
- 12.1.2.1. Company Overview
- 12.1.2.2. Products
- 12.1.2.3. Company Financials
- 12.1.2.4. SWOT Analysis
- 12.1.3 Man Group
- 12.1.3.1. Company Overview
- 12.1.3.2. Products
- 12.1.3.3. Company Financials
- 12.1.3.4. SWOT Analysis
- 12.1.4 AQR Capital Management
- 12.1.4.1. Company Overview
- 12.1.4.2. Products
- 12.1.4.3. Company Financials
- 12.1.4.4. SWOT Analysis
- 12.1.5 Two Sigma Investments
- 12.1.5.1. Company Overview
- 12.1.5.2. Products
- 12.1.5.3. Company Financials
- 12.1.5.4. SWOT Analysis
- 12.1.6 Millennium Management
- 12.1.6.1. Company Overview
- 12.1.6.2. Products
- 12.1.6.3. Company Financials
- 12.1.6.4. SWOT Analysis
- 12.1.7 Elliot Management
- 12.1.7.1. Company Overview
- 12.1.7.2. Products
- 12.1.7.3. Company Financials
- 12.1.7.4. SWOT Analysis
- 12.1.8 BlackRock Advisors
- 12.1.8.1. Company Overview
- 12.1.8.2. Products
- 12.1.8.3. Company Financials
- 12.1.8.4. SWOT Analysis
- 12.1.9 Citadel
- 12.1.9.1. Company Overview
- 12.1.9.2. Products
- 12.1.9.3. Company Financials
- 12.1.9.4. SWOT Analysis
- 12.1.10 Davidson Kempner Capital**List Not Exhaustive
- 12.1.10.1. Company Overview
- 12.1.10.2. Products
- 12.1.10.3. Company Financials
- 12.1.10.4. SWOT Analysis
- 12.1.1 BridgeWater Associates
- 12.2. Market Entropy
- 12.2.1 Company's Key Areas Served
- 12.2.2 Recent Developments
- 12.3. Company Market Share Analysis 2025
- 12.3.1 Top 5 Companies Market Share Analysis
- 12.3.2 Top 3 Companies Market Share Analysis
- 12.4. List of Potential Customers
- 13. Research Methodology
List of Figures
- Figure 1: Global Hedge Fund Industry Revenue Breakdown (Million, %) by Region 2025 & 2033
- Figure 2: Global Hedge Fund Industry Volume Breakdown (Trillion, %) by Region 2025 & 2033
- Figure 3: North America Hedge Fund Industry Revenue (Million), by Core Strategy 2025 & 2033
- Figure 4: North America Hedge Fund Industry Volume (Trillion), by Core Strategy 2025 & 2033
- Figure 5: North America Hedge Fund Industry Revenue Share (%), by Core Strategy 2025 & 2033
- Figure 6: North America Hedge Fund Industry Volume Share (%), by Core Strategy 2025 & 2033
- Figure 7: North America Hedge Fund Industry Revenue (Million), by Manager Location 2025 & 2033
- Figure 8: North America Hedge Fund Industry Volume (Trillion), by Manager Location 2025 & 2033
- Figure 9: North America Hedge Fund Industry Revenue Share (%), by Manager Location 2025 & 2033
- Figure 10: North America Hedge Fund Industry Volume Share (%), by Manager Location 2025 & 2033
- Figure 11: North America Hedge Fund Industry Revenue (Million), by Country 2025 & 2033
- Figure 12: North America Hedge Fund Industry Volume (Trillion), by Country 2025 & 2033
- Figure 13: North America Hedge Fund Industry Revenue Share (%), by Country 2025 & 2033
- Figure 14: North America Hedge Fund Industry Volume Share (%), by Country 2025 & 2033
- Figure 15: South America Hedge Fund Industry Revenue (Million), by Core Strategy 2025 & 2033
- Figure 16: South America Hedge Fund Industry Volume (Trillion), by Core Strategy 2025 & 2033
- Figure 17: South America Hedge Fund Industry Revenue Share (%), by Core Strategy 2025 & 2033
- Figure 18: South America Hedge Fund Industry Volume Share (%), by Core Strategy 2025 & 2033
- Figure 19: South America Hedge Fund Industry Revenue (Million), by Manager Location 2025 & 2033
- Figure 20: South America Hedge Fund Industry Volume (Trillion), by Manager Location 2025 & 2033
- Figure 21: South America Hedge Fund Industry Revenue Share (%), by Manager Location 2025 & 2033
- Figure 22: South America Hedge Fund Industry Volume Share (%), by Manager Location 2025 & 2033
- Figure 23: South America Hedge Fund Industry Revenue (Million), by Country 2025 & 2033
- Figure 24: South America Hedge Fund Industry Volume (Trillion), by Country 2025 & 2033
- Figure 25: South America Hedge Fund Industry Revenue Share (%), by Country 2025 & 2033
- Figure 26: South America Hedge Fund Industry Volume Share (%), by Country 2025 & 2033
- Figure 27: Europe Hedge Fund Industry Revenue (Million), by Core Strategy 2025 & 2033
- Figure 28: Europe Hedge Fund Industry Volume (Trillion), by Core Strategy 2025 & 2033
- Figure 29: Europe Hedge Fund Industry Revenue Share (%), by Core Strategy 2025 & 2033
- Figure 30: Europe Hedge Fund Industry Volume Share (%), by Core Strategy 2025 & 2033
- Figure 31: Europe Hedge Fund Industry Revenue (Million), by Manager Location 2025 & 2033
- Figure 32: Europe Hedge Fund Industry Volume (Trillion), by Manager Location 2025 & 2033
- Figure 33: Europe Hedge Fund Industry Revenue Share (%), by Manager Location 2025 & 2033
- Figure 34: Europe Hedge Fund Industry Volume Share (%), by Manager Location 2025 & 2033
- Figure 35: Europe Hedge Fund Industry Revenue (Million), by Country 2025 & 2033
- Figure 36: Europe Hedge Fund Industry Volume (Trillion), by Country 2025 & 2033
- Figure 37: Europe Hedge Fund Industry Revenue Share (%), by Country 2025 & 2033
- Figure 38: Europe Hedge Fund Industry Volume Share (%), by Country 2025 & 2033
- Figure 39: Middle East & Africa Hedge Fund Industry Revenue (Million), by Core Strategy 2025 & 2033
- Figure 40: Middle East & Africa Hedge Fund Industry Volume (Trillion), by Core Strategy 2025 & 2033
- Figure 41: Middle East & Africa Hedge Fund Industry Revenue Share (%), by Core Strategy 2025 & 2033
- Figure 42: Middle East & Africa Hedge Fund Industry Volume Share (%), by Core Strategy 2025 & 2033
- Figure 43: Middle East & Africa Hedge Fund Industry Revenue (Million), by Manager Location 2025 & 2033
- Figure 44: Middle East & Africa Hedge Fund Industry Volume (Trillion), by Manager Location 2025 & 2033
- Figure 45: Middle East & Africa Hedge Fund Industry Revenue Share (%), by Manager Location 2025 & 2033
- Figure 46: Middle East & Africa Hedge Fund Industry Volume Share (%), by Manager Location 2025 & 2033
- Figure 47: Middle East & Africa Hedge Fund Industry Revenue (Million), by Country 2025 & 2033
- Figure 48: Middle East & Africa Hedge Fund Industry Volume (Trillion), by Country 2025 & 2033
- Figure 49: Middle East & Africa Hedge Fund Industry Revenue Share (%), by Country 2025 & 2033
- Figure 50: Middle East & Africa Hedge Fund Industry Volume Share (%), by Country 2025 & 2033
- Figure 51: Asia Pacific Hedge Fund Industry Revenue (Million), by Core Strategy 2025 & 2033
- Figure 52: Asia Pacific Hedge Fund Industry Volume (Trillion), by Core Strategy 2025 & 2033
- Figure 53: Asia Pacific Hedge Fund Industry Revenue Share (%), by Core Strategy 2025 & 2033
- Figure 54: Asia Pacific Hedge Fund Industry Volume Share (%), by Core Strategy 2025 & 2033
- Figure 55: Asia Pacific Hedge Fund Industry Revenue (Million), by Manager Location 2025 & 2033
- Figure 56: Asia Pacific Hedge Fund Industry Volume (Trillion), by Manager Location 2025 & 2033
- Figure 57: Asia Pacific Hedge Fund Industry Revenue Share (%), by Manager Location 2025 & 2033
- Figure 58: Asia Pacific Hedge Fund Industry Volume Share (%), by Manager Location 2025 & 2033
- Figure 59: Asia Pacific Hedge Fund Industry Revenue (Million), by Country 2025 & 2033
- Figure 60: Asia Pacific Hedge Fund Industry Volume (Trillion), by Country 2025 & 2033
- Figure 61: Asia Pacific Hedge Fund Industry Revenue Share (%), by Country 2025 & 2033
- Figure 62: Asia Pacific Hedge Fund Industry Volume Share (%), by Country 2025 & 2033
List of Tables
- Table 1: Global Hedge Fund Industry Revenue Million Forecast, by Core Strategy 2020 & 2033
- Table 2: Global Hedge Fund Industry Volume Trillion Forecast, by Core Strategy 2020 & 2033
- Table 3: Global Hedge Fund Industry Revenue Million Forecast, by Manager Location 2020 & 2033
- Table 4: Global Hedge Fund Industry Volume Trillion Forecast, by Manager Location 2020 & 2033
- Table 5: Global Hedge Fund Industry Revenue Million Forecast, by Region 2020 & 2033
- Table 6: Global Hedge Fund Industry Volume Trillion Forecast, by Region 2020 & 2033
- Table 7: Global Hedge Fund Industry Revenue Million Forecast, by Core Strategy 2020 & 2033
- Table 8: Global Hedge Fund Industry Volume Trillion Forecast, by Core Strategy 2020 & 2033
- Table 9: Global Hedge Fund Industry Revenue Million Forecast, by Manager Location 2020 & 2033
- Table 10: Global Hedge Fund Industry Volume Trillion Forecast, by Manager Location 2020 & 2033
- Table 11: Global Hedge Fund Industry Revenue Million Forecast, by Country 2020 & 2033
- Table 12: Global Hedge Fund Industry Volume Trillion Forecast, by Country 2020 & 2033
- Table 13: United States Hedge Fund Industry Revenue (Million) Forecast, by Application 2020 & 2033
- Table 14: United States Hedge Fund Industry Volume (Trillion) Forecast, by Application 2020 & 2033
- Table 15: Canada Hedge Fund Industry Revenue (Million) Forecast, by Application 2020 & 2033
- Table 16: Canada Hedge Fund Industry Volume (Trillion) Forecast, by Application 2020 & 2033
- Table 17: Mexico Hedge Fund Industry Revenue (Million) Forecast, by Application 2020 & 2033
- Table 18: Mexico Hedge Fund Industry Volume (Trillion) Forecast, by Application 2020 & 2033
- Table 19: Global Hedge Fund Industry Revenue Million Forecast, by Core Strategy 2020 & 2033
- Table 20: Global Hedge Fund Industry Volume Trillion Forecast, by Core Strategy 2020 & 2033
- Table 21: Global Hedge Fund Industry Revenue Million Forecast, by Manager Location 2020 & 2033
- Table 22: Global Hedge Fund Industry Volume Trillion Forecast, by Manager Location 2020 & 2033
- Table 23: Global Hedge Fund Industry Revenue Million Forecast, by Country 2020 & 2033
- Table 24: Global Hedge Fund Industry Volume Trillion Forecast, by Country 2020 & 2033
- Table 25: Brazil Hedge Fund Industry Revenue (Million) Forecast, by Application 2020 & 2033
- Table 26: Brazil Hedge Fund Industry Volume (Trillion) Forecast, by Application 2020 & 2033
- Table 27: Argentina Hedge Fund Industry Revenue (Million) Forecast, by Application 2020 & 2033
- Table 28: Argentina Hedge Fund Industry Volume (Trillion) Forecast, by Application 2020 & 2033
- Table 29: Rest of South America Hedge Fund Industry Revenue (Million) Forecast, by Application 2020 & 2033
- Table 30: Rest of South America Hedge Fund Industry Volume (Trillion) Forecast, by Application 2020 & 2033
- Table 31: Global Hedge Fund Industry Revenue Million Forecast, by Core Strategy 2020 & 2033
- Table 32: Global Hedge Fund Industry Volume Trillion Forecast, by Core Strategy 2020 & 2033
- Table 33: Global Hedge Fund Industry Revenue Million Forecast, by Manager Location 2020 & 2033
- Table 34: Global Hedge Fund Industry Volume Trillion Forecast, by Manager Location 2020 & 2033
- Table 35: Global Hedge Fund Industry Revenue Million Forecast, by Country 2020 & 2033
- Table 36: Global Hedge Fund Industry Volume Trillion Forecast, by Country 2020 & 2033
- Table 37: United Kingdom Hedge Fund Industry Revenue (Million) Forecast, by Application 2020 & 2033
- Table 38: United Kingdom Hedge Fund Industry Volume (Trillion) Forecast, by Application 2020 & 2033
- Table 39: Germany Hedge Fund Industry Revenue (Million) Forecast, by Application 2020 & 2033
- Table 40: Germany Hedge Fund Industry Volume (Trillion) Forecast, by Application 2020 & 2033
- Table 41: France Hedge Fund Industry Revenue (Million) Forecast, by Application 2020 & 2033
- Table 42: France Hedge Fund Industry Volume (Trillion) Forecast, by Application 2020 & 2033
- Table 43: Italy Hedge Fund Industry Revenue (Million) Forecast, by Application 2020 & 2033
- Table 44: Italy Hedge Fund Industry Volume (Trillion) Forecast, by Application 2020 & 2033
- Table 45: Spain Hedge Fund Industry Revenue (Million) Forecast, by Application 2020 & 2033
- Table 46: Spain Hedge Fund Industry Volume (Trillion) Forecast, by Application 2020 & 2033
- Table 47: Russia Hedge Fund Industry Revenue (Million) Forecast, by Application 2020 & 2033
- Table 48: Russia Hedge Fund Industry Volume (Trillion) Forecast, by Application 2020 & 2033
- Table 49: Benelux Hedge Fund Industry Revenue (Million) Forecast, by Application 2020 & 2033
- Table 50: Benelux Hedge Fund Industry Volume (Trillion) Forecast, by Application 2020 & 2033
- Table 51: Nordics Hedge Fund Industry Revenue (Million) Forecast, by Application 2020 & 2033
- Table 52: Nordics Hedge Fund Industry Volume (Trillion) Forecast, by Application 2020 & 2033
- Table 53: Rest of Europe Hedge Fund Industry Revenue (Million) Forecast, by Application 2020 & 2033
- Table 54: Rest of Europe Hedge Fund Industry Volume (Trillion) Forecast, by Application 2020 & 2033
- Table 55: Global Hedge Fund Industry Revenue Million Forecast, by Core Strategy 2020 & 2033
- Table 56: Global Hedge Fund Industry Volume Trillion Forecast, by Core Strategy 2020 & 2033
- Table 57: Global Hedge Fund Industry Revenue Million Forecast, by Manager Location 2020 & 2033
- Table 58: Global Hedge Fund Industry Volume Trillion Forecast, by Manager Location 2020 & 2033
- Table 59: Global Hedge Fund Industry Revenue Million Forecast, by Country 2020 & 2033
- Table 60: Global Hedge Fund Industry Volume Trillion Forecast, by Country 2020 & 2033
- Table 61: Turkey Hedge Fund Industry Revenue (Million) Forecast, by Application 2020 & 2033
- Table 62: Turkey Hedge Fund Industry Volume (Trillion) Forecast, by Application 2020 & 2033
- Table 63: Israel Hedge Fund Industry Revenue (Million) Forecast, by Application 2020 & 2033
- Table 64: Israel Hedge Fund Industry Volume (Trillion) Forecast, by Application 2020 & 2033
- Table 65: GCC Hedge Fund Industry Revenue (Million) Forecast, by Application 2020 & 2033
- Table 66: GCC Hedge Fund Industry Volume (Trillion) Forecast, by Application 2020 & 2033
- Table 67: North Africa Hedge Fund Industry Revenue (Million) Forecast, by Application 2020 & 2033
- Table 68: North Africa Hedge Fund Industry Volume (Trillion) Forecast, by Application 2020 & 2033
- Table 69: South Africa Hedge Fund Industry Revenue (Million) Forecast, by Application 2020 & 2033
- Table 70: South Africa Hedge Fund Industry Volume (Trillion) Forecast, by Application 2020 & 2033
- Table 71: Rest of Middle East & Africa Hedge Fund Industry Revenue (Million) Forecast, by Application 2020 & 2033
- Table 72: Rest of Middle East & Africa Hedge Fund Industry Volume (Trillion) Forecast, by Application 2020 & 2033
- Table 73: Global Hedge Fund Industry Revenue Million Forecast, by Core Strategy 2020 & 2033
- Table 74: Global Hedge Fund Industry Volume Trillion Forecast, by Core Strategy 2020 & 2033
- Table 75: Global Hedge Fund Industry Revenue Million Forecast, by Manager Location 2020 & 2033
- Table 76: Global Hedge Fund Industry Volume Trillion Forecast, by Manager Location 2020 & 2033
- Table 77: Global Hedge Fund Industry Revenue Million Forecast, by Country 2020 & 2033
- Table 78: Global Hedge Fund Industry Volume Trillion Forecast, by Country 2020 & 2033
- Table 79: China Hedge Fund Industry Revenue (Million) Forecast, by Application 2020 & 2033
- Table 80: China Hedge Fund Industry Volume (Trillion) Forecast, by Application 2020 & 2033
- Table 81: India Hedge Fund Industry Revenue (Million) Forecast, by Application 2020 & 2033
- Table 82: India Hedge Fund Industry Volume (Trillion) Forecast, by Application 2020 & 2033
- Table 83: Japan Hedge Fund Industry Revenue (Million) Forecast, by Application 2020 & 2033
- Table 84: Japan Hedge Fund Industry Volume (Trillion) Forecast, by Application 2020 & 2033
- Table 85: South Korea Hedge Fund Industry Revenue (Million) Forecast, by Application 2020 & 2033
- Table 86: South Korea Hedge Fund Industry Volume (Trillion) Forecast, by Application 2020 & 2033
- Table 87: ASEAN Hedge Fund Industry Revenue (Million) Forecast, by Application 2020 & 2033
- Table 88: ASEAN Hedge Fund Industry Volume (Trillion) Forecast, by Application 2020 & 2033
- Table 89: Oceania Hedge Fund Industry Revenue (Million) Forecast, by Application 2020 & 2033
- Table 90: Oceania Hedge Fund Industry Volume (Trillion) Forecast, by Application 2020 & 2033
- Table 91: Rest of Asia Pacific Hedge Fund Industry Revenue (Million) Forecast, by Application 2020 & 2033
- Table 92: Rest of Asia Pacific Hedge Fund Industry Volume (Trillion) Forecast, by Application 2020 & 2033
Frequently Asked Questions
1. What is the projected Compound Annual Growth Rate (CAGR) of the Hedge Fund Industry?
The projected CAGR is approximately 3.14%.
2. Which companies are prominent players in the Hedge Fund Industry?
Key companies in the market include BridgeWater Associates, Renaissance Technologies, Man Group, AQR Capital Management, Two Sigma Investments, Millennium Management, Elliot Management, BlackRock Advisors, Citadel, Davidson Kempner Capital**List Not Exhaustive.
3. What are the main segments of the Hedge Fund Industry?
The market segments include Core Strategy, Manager Location.
4. Can you provide details about the market size?
The market size is estimated to be USD 4.74 Million as of 2022.
5. What are some drivers contributing to market growth?
Emerging Demand for Smaller or Newer Fund Managers; Recovering Performance of Existing Hedge Funds.
6. What are the notable trends driving market growth?
Investments in Digital Assets is Driving the Market.
7. Are there any restraints impacting market growth?
Emerging Demand for Smaller or Newer Fund Managers; Recovering Performance of Existing Hedge Funds.
8. Can you provide examples of recent developments in the market?
November 2022: BlackRock Alternatives (BlackRock), through a fund managed by its diversified infrastructure business, agreed to acquire Jupiter Power LLC (Jupiter). Jupiter Power is a leading United States operator and developer of stand-alone, utility-scale battery energy storage systems.
9. What pricing options are available for accessing the report?
Pricing options include single-user, multi-user, and enterprise licenses priced at USD 3800, USD 4500, and USD 5800 respectively.
10. Is the market size provided in terms of value or volume?
The market size is provided in terms of value, measured in Million and volume, measured in Trillion.
11. Are there any specific market keywords associated with the report?
Yes, the market keyword associated with the report is "Hedge Fund Industry," which aids in identifying and referencing the specific market segment covered.
12. How do I determine which pricing option suits my needs best?
The pricing options vary based on user requirements and access needs. Individual users may opt for single-user licenses, while businesses requiring broader access may choose multi-user or enterprise licenses for cost-effective access to the report.
13. Are there any additional resources or data provided in the Hedge Fund Industry report?
While the report offers comprehensive insights, it's advisable to review the specific contents or supplementary materials provided to ascertain if additional resources or data are available.
14. How can I stay updated on further developments or reports in the Hedge Fund Industry?
To stay informed about further developments, trends, and reports in the Hedge Fund Industry, consider subscribing to industry newsletters, following relevant companies and organizations, or regularly checking reputable industry news sources and publications.
Methodology
Step 1 - Identification of Relevant Samples Size from Population Database


Step 2 - Approaches for Defining Global Market Size (Value, Volume* & Price*)

Note*: In applicable scenarios
Step 3 - Data Sources
Primary Research
- Web Analytics
- Survey Reports
- Research Institute
- Latest Research Reports
- Opinion Leaders
Secondary Research
- Annual Reports
- White Paper
- Latest Press Release
- Industry Association
- Paid Database
- Investor Presentations

Step 4 - Data Triangulation
Involves using different sources of information in order to increase the validity of a study
These sources are likely to be stakeholders in a program - participants, other researchers, program staff, other community members, and so on.
Then we put all data in single framework & apply various statistical tools to find out the dynamic on the market.
During the analysis stage, feedback from the stakeholder groups would be compared to determine areas of agreement as well as areas of divergence