Key Insights
The high conductivity copper bar market is experiencing robust growth, driven by the expanding electrical and electronics industry, particularly in renewable energy, electric vehicles, and power infrastructure development. The market's value is estimated at $5 billion in 2025, exhibiting a Compound Annual Growth Rate (CAGR) of 6% from 2025 to 2033. This growth is fueled by the increasing demand for efficient power transmission and distribution systems, as well as the rising adoption of electric vehicles, which significantly rely on high-conductivity copper for their motor windings and other critical components. Furthermore, advancements in manufacturing techniques leading to improved purity and enhanced conductivity contribute to the market's expansion. Key players such as ABB, Furukawa Electric, and Raychem RPG are actively investing in R&D and strategic partnerships to solidify their market positions and cater to the growing demand for high-quality copper bars.
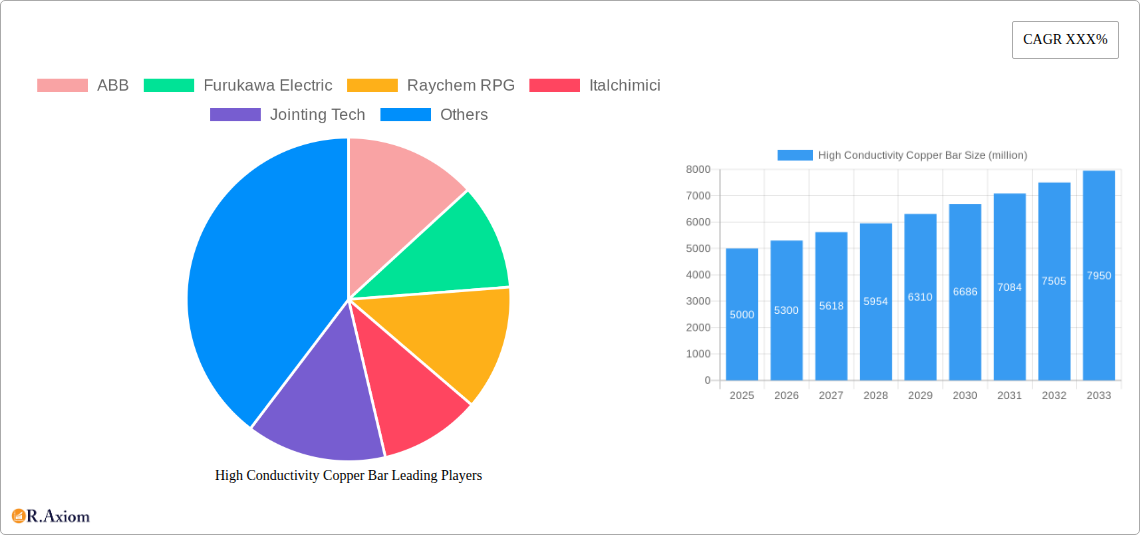
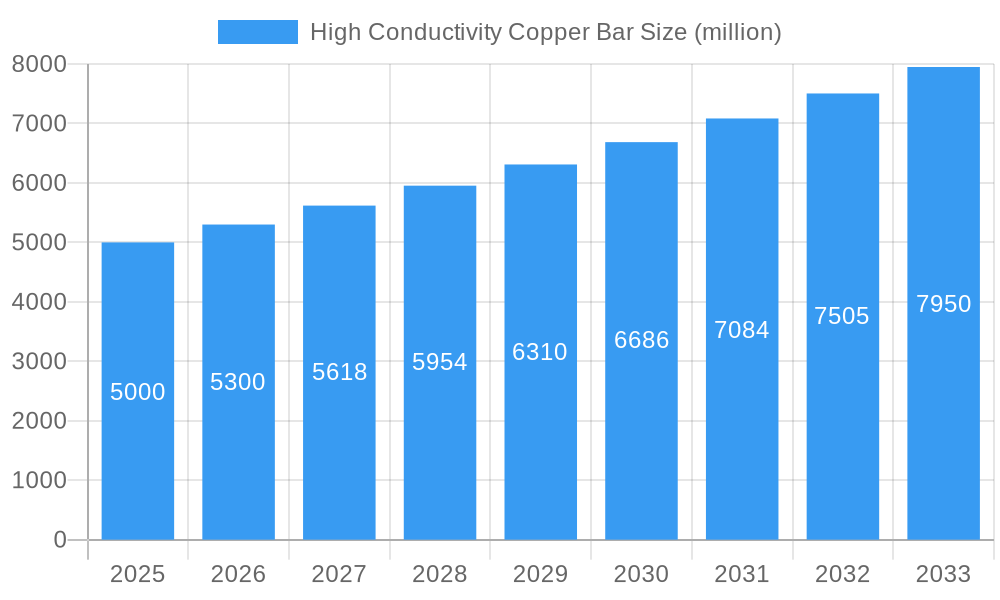
High Conductivity Copper Bar Market Size (In Billion)
However, the market faces some restraints, primarily fluctuating copper prices and the increasing availability of alternative conductive materials such as aluminum. The competitive landscape is characterized by both large multinational corporations and specialized regional players, leading to price competitiveness and the need for continuous innovation. Market segmentation focuses on various bar shapes, sizes, and purity levels, catering to diverse industrial applications. Geographical variations in demand exist, with regions experiencing rapid industrialization and infrastructure development showing higher growth rates. Overall, the long-term outlook for the high conductivity copper bar market remains positive, with projected continuous expansion fueled by technological advancements and the ongoing global demand for reliable and efficient electrical systems.
High Conductivity Copper Bar Company Market Share
High Conductivity Copper Bar Market Report: 2019-2033
This comprehensive report provides a detailed analysis of the global high conductivity copper bar market, offering invaluable insights for industry stakeholders, investors, and businesses seeking to navigate this dynamic sector. The report covers the period 2019-2033, with a base year of 2025 and a forecast period of 2025-2033. It leverages extensive market research, incorporating data from the historical period (2019-2024) to provide accurate and actionable predictions. The market size is estimated at xx million USD in 2025, projected to reach xx million USD by 2033.
High Conductivity Copper Bar Market Concentration & Innovation
This section analyzes the competitive landscape, innovation trends, and regulatory influences shaping the high conductivity copper bar market. The market is moderately concentrated, with key players holding significant shares. ABB, Furukawa Electric, and Raychem RPG are among the leading companies, commanding a combined market share of approximately xx%. Smaller players, like Italchimici, Jointing Tech, Oriental Copper, and Wetown Electric, contribute to the remaining market share.
Market Concentration Metrics:
- Top 3 Players Market Share: xx%
- Top 5 Players Market Share: xx%
- Average Market Share of Top 10 Players: xx%
Innovation Drivers:
- Demand for higher purity copper to improve conductivity.
- Development of advanced alloys for enhanced performance in specific applications.
- Increased focus on sustainable manufacturing processes.
Regulatory Frameworks & Product Substitutes:
- Stringent environmental regulations influencing production methods.
- Aluminum and other conductive materials posing a competitive threat as substitutes.
M&A Activities:
Over the past five years, the market witnessed approximately xx M&A deals, with a total value exceeding xx million USD. These deals primarily focused on expanding geographical reach and securing raw material supplies.
High Conductivity Copper Bar Industry Trends & Insights
The global high conductivity copper bar market is experiencing robust growth, driven by the increasing demand from various end-use sectors. The market registered a CAGR of xx% during the historical period (2019-2024) and is projected to maintain a CAGR of xx% during the forecast period (2025-2033). This growth is fueled by several factors, including the expansion of the electrical and electronics industry, the rise of renewable energy infrastructure projects, and the increasing adoption of electric vehicles. Technological advancements in copper refining and alloying techniques are further enhancing the performance and applications of high conductivity copper bars. Consumer preferences towards energy-efficient and technologically advanced products are also driving the market’s expansion. Competitive dynamics are intense, with leading companies focusing on product differentiation, strategic partnerships, and technological innovation to maintain their market positions. Market penetration in developing economies is gradually increasing, driven by rising infrastructure development and industrialization.
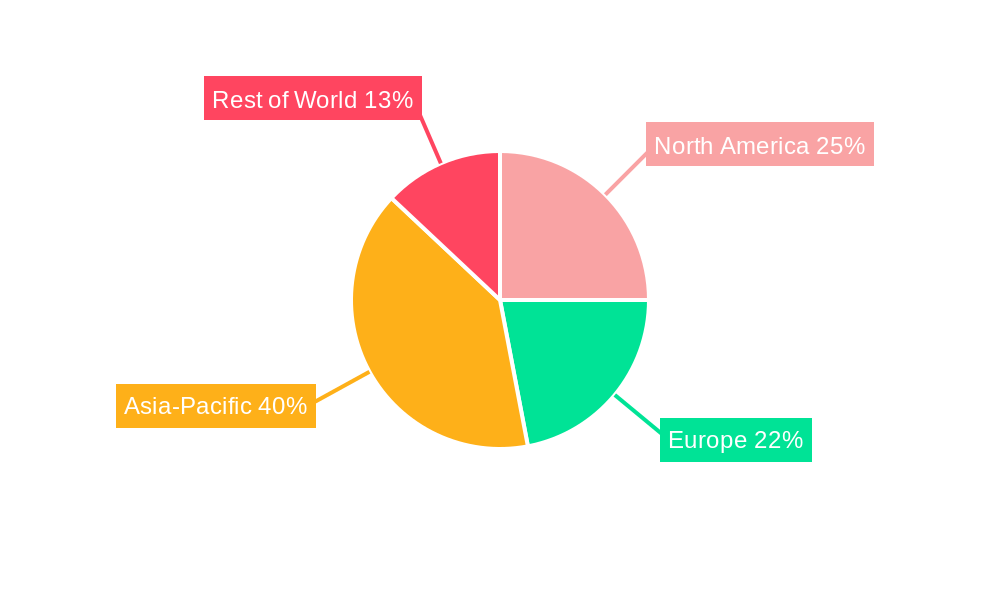
Dominant Markets & Segments in High Conductivity Copper Bar
The Asia-Pacific region dominates the global high conductivity copper bar market, accounting for approximately xx% of the total market share in 2025. This dominance is primarily attributed to:
- Rapid industrialization and urbanization driving substantial demand.
- Significant investments in infrastructure projects, including power grids and transportation networks.
- Growing adoption of renewable energy technologies.
- Favorable government policies supporting the development of the electrical and electronics sector.
Country-Specific Analysis:
China, India, and Japan are among the key contributors to the regional market growth. The European and North American markets also hold significant shares, primarily driven by the robust performance of the automotive and renewable energy sectors.
High Conductivity Copper Bar Product Developments
Recent advancements in high conductivity copper bar technology focus on improving purity, enhancing mechanical properties, and expanding applications. New alloy formulations are being developed to meet the specific needs of diverse industries, including electric vehicles, renewable energy, and high-speed rail. Companies are also emphasizing sustainable manufacturing practices and focusing on reducing the environmental impact of their operations. This focus on sustainability and performance enhancement positions high conductivity copper bars as a vital material in various emerging technologies.
Report Scope & Segmentation Analysis
This report segments the high conductivity copper bar market based on several key parameters:
By Grade: High purity copper bars, oxygen-free high conductivity (OFHC) copper bars, and others. Each segment exhibits distinct growth trajectories, driven by factors such as application requirements and manufacturing processes.
By Application: Electrical and electronics, construction, transportation, renewable energy, and others. The electrical and electronics segment is expected to maintain its dominance, driven by advancements in semiconductor technology.
By Region: North America, Europe, Asia-Pacific, Middle East & Africa, and South America. The Asia-Pacific region is projected to demonstrate the highest growth rate due to robust economic growth and infrastructural expansion.
Key Drivers of High Conductivity Copper Bar Growth
The growth of the high conductivity copper bar market is driven by several factors:
- Technological Advancements: Continuous improvements in copper refining techniques are leading to higher purity and enhanced conductivity.
- Economic Growth: Expanding global economies are fueling demand for infrastructure projects and industrialization, leading to increased copper consumption.
- Government Regulations: Policies promoting renewable energy and sustainable technologies are bolstering the demand for copper in various applications. Specifically, the push towards electrification in transportation is increasing the demand for copper in electric vehicles.
Challenges in the High Conductivity Copper Bar Sector
The high conductivity copper bar sector faces several challenges, including:
- Fluctuating Copper Prices: Copper prices are subject to volatility, affecting production costs and profitability.
- Supply Chain Disruptions: Global supply chain uncertainties can hamper the availability of raw materials and impact production.
- Intense Competition: The market is highly competitive, requiring companies to innovate and optimize their operations to maintain a competitive edge. This competition impacts pricing and profit margins.
Emerging Opportunities in High Conductivity Copper Bar
The market presents several emerging opportunities:
- Growth in Renewable Energy: The increasing adoption of solar and wind power is driving demand for high conductivity copper bars in electrical systems.
- Expansion of Electric Vehicles: The rapid growth of the electric vehicle market is creating significant demand for high-conductivity copper in electric motors and batteries.
- Advancements in Electronics: Developments in microelectronics and advanced computing technologies are generating new applications for high-purity copper bars.
Leading Players in the High Conductivity Copper Bar Market
- ABB
- Furukawa Electric
- Raychem RPG
- Italchimici
- Jointing Tech
- Oriental Copper
- Wetown Electric
Key Developments in High Conductivity Copper Bar Industry
- 2022-Q3: ABB launched a new range of high-conductivity copper bars designed for electric vehicle applications.
- 2021-Q4: Furukawa Electric announced a strategic partnership to expand its manufacturing capacity for high-purity copper bars.
- 2023-Q1: Raychem RPG invested in advanced alloying technologies to enhance the performance of its copper bar products. (Further developments to be added based on available information)
Strategic Outlook for High Conductivity Copper Bar Market
The global high conductivity copper bar market is poised for continued growth, driven by the expanding applications in various sectors, including renewable energy, electric vehicles, and advanced electronics. Technological advancements, coupled with favorable government policies, are expected to further fuel market expansion. The focus on sustainability and the development of innovative alloys are set to enhance the competitiveness and market penetration of high conductivity copper bars in the coming years. The market is expected to witness further consolidation through M&A activities, with larger players seeking to expand their market share and geographical reach.
High Conductivity Copper Bar Segmentation
-
1. Application
- 1.1. Industrial Motor
- 1.2. Household Appliances
- 1.3. Consumer Electronics
- 1.4. Other
-
2. Type
- 2.1. Solid Conductive Copper
- 2.2. Stranded Conductive Copper
High Conductivity Copper Bar Segmentation By Geography
-
1. North America
- 1.1. United States
- 1.2. Canada
- 1.3. Mexico
-
2. South America
- 2.1. Brazil
- 2.2. Argentina
- 2.3. Rest of South America
-
3. Europe
- 3.1. United Kingdom
- 3.2. Germany
- 3.3. France
- 3.4. Italy
- 3.5. Spain
- 3.6. Russia
- 3.7. Benelux
- 3.8. Nordics
- 3.9. Rest of Europe
-
4. Middle East & Africa
- 4.1. Turkey
- 4.2. Israel
- 4.3. GCC
- 4.4. North Africa
- 4.5. South Africa
- 4.6. Rest of Middle East & Africa
-
5. Asia Pacific
- 5.1. China
- 5.2. India
- 5.3. Japan
- 5.4. South Korea
- 5.5. ASEAN
- 5.6. Oceania
- 5.7. Rest of Asia Pacific
High Conductivity Copper Bar Regional Market Share
Geographic Coverage of High Conductivity Copper Bar
High Conductivity Copper Bar REPORT HIGHLIGHTS
| Aspects | Details |
|---|---|
| Study Period | 2020-2034 |
| Base Year | 2025 |
| Estimated Year | 2026 |
| Forecast Period | 2026-2034 |
| Historical Period | 2020-2025 |
| Growth Rate | CAGR of 2.2% from 2020-2034 |
| Segmentation |
|
Table of Contents
- 1. Introduction
- 1.1. Research Scope
- 1.2. Market Segmentation
- 1.3. Research Objective
- 1.4. Definitions and Assumptions
- 2. Executive Summary
- 2.1. Market Snapshot
- 3. Market Dynamics
- 3.1. Market Drivers
- 3.2. Market Restrains
- 3.3. Market Trends
- 3.4. Market Opportunities
- 4. Market Factor Analysis
- 4.1. Porters Five Forces
- 4.1.1. Bargaining Power of Suppliers
- 4.1.2. Bargaining Power of Buyers
- 4.1.3. Threat of New Entrants
- 4.1.4. Threat of Substitutes
- 4.1.5. Competitive Rivalry
- 4.2. PESTEL analysis
- 4.3. BCG Analysis
- 4.3.1. Stars (High Growth, High Market Share)
- 4.3.2. Cash Cows (Low Growth, High Market Share)
- 4.3.3. Question Mark (High Growth, Low Market Share)
- 4.3.4. Dogs (Low Growth, Low Market Share)
- 4.4. Ansoff Matrix Analysis
- 4.5. Supply Chain Analysis
- 4.6. Regulatory Landscape
- 4.7. Current Market Potential and Opportunity Assessment (TAM–SAM–SOM Framework)
- 4.8. RAX Analyst Note
- 4.1. Porters Five Forces
- 5. Market Analysis, Insights and Forecast 2021-2033
- 5.1. Market Analysis, Insights and Forecast - by Application
- 5.1.1. Industrial Motor
- 5.1.2. Household Appliances
- 5.1.3. Consumer Electronics
- 5.1.4. Other
- 5.2. Market Analysis, Insights and Forecast - by Type
- 5.2.1. Solid Conductive Copper
- 5.2.2. Stranded Conductive Copper
- 5.3. Market Analysis, Insights and Forecast - by Region
- 5.3.1. North America
- 5.3.2. South America
- 5.3.3. Europe
- 5.3.4. Middle East & Africa
- 5.3.5. Asia Pacific
- 5.1. Market Analysis, Insights and Forecast - by Application
- 6. Global High Conductivity Copper Bar Analysis, Insights and Forecast, 2021-2033
- 6.1. Market Analysis, Insights and Forecast - by Application
- 6.1.1. Industrial Motor
- 6.1.2. Household Appliances
- 6.1.3. Consumer Electronics
- 6.1.4. Other
- 6.2. Market Analysis, Insights and Forecast - by Type
- 6.2.1. Solid Conductive Copper
- 6.2.2. Stranded Conductive Copper
- 6.1. Market Analysis, Insights and Forecast - by Application
- 7. North America High Conductivity Copper Bar Analysis, Insights and Forecast, 2020-2032
- 7.1. Market Analysis, Insights and Forecast - by Application
- 7.1.1. Industrial Motor
- 7.1.2. Household Appliances
- 7.1.3. Consumer Electronics
- 7.1.4. Other
- 7.2. Market Analysis, Insights and Forecast - by Type
- 7.2.1. Solid Conductive Copper
- 7.2.2. Stranded Conductive Copper
- 7.1. Market Analysis, Insights and Forecast - by Application
- 8. South America High Conductivity Copper Bar Analysis, Insights and Forecast, 2020-2032
- 8.1. Market Analysis, Insights and Forecast - by Application
- 8.1.1. Industrial Motor
- 8.1.2. Household Appliances
- 8.1.3. Consumer Electronics
- 8.1.4. Other
- 8.2. Market Analysis, Insights and Forecast - by Type
- 8.2.1. Solid Conductive Copper
- 8.2.2. Stranded Conductive Copper
- 8.1. Market Analysis, Insights and Forecast - by Application
- 9. Europe High Conductivity Copper Bar Analysis, Insights and Forecast, 2020-2032
- 9.1. Market Analysis, Insights and Forecast - by Application
- 9.1.1. Industrial Motor
- 9.1.2. Household Appliances
- 9.1.3. Consumer Electronics
- 9.1.4. Other
- 9.2. Market Analysis, Insights and Forecast - by Type
- 9.2.1. Solid Conductive Copper
- 9.2.2. Stranded Conductive Copper
- 9.1. Market Analysis, Insights and Forecast - by Application
- 10. Middle East & Africa High Conductivity Copper Bar Analysis, Insights and Forecast, 2020-2032
- 10.1. Market Analysis, Insights and Forecast - by Application
- 10.1.1. Industrial Motor
- 10.1.2. Household Appliances
- 10.1.3. Consumer Electronics
- 10.1.4. Other
- 10.2. Market Analysis, Insights and Forecast - by Type
- 10.2.1. Solid Conductive Copper
- 10.2.2. Stranded Conductive Copper
- 10.1. Market Analysis, Insights and Forecast - by Application
- 11. Asia Pacific High Conductivity Copper Bar Analysis, Insights and Forecast, 2020-2032
- 11.1. Market Analysis, Insights and Forecast - by Application
- 11.1.1. Industrial Motor
- 11.1.2. Household Appliances
- 11.1.3. Consumer Electronics
- 11.1.4. Other
- 11.2. Market Analysis, Insights and Forecast - by Type
- 11.2.1. Solid Conductive Copper
- 11.2.2. Stranded Conductive Copper
- 11.1. Market Analysis, Insights and Forecast - by Application
- 12. Competitive Analysis
- 12.1. Company Profiles
- 12.1.1 ABB
- 12.1.1.1. Company Overview
- 12.1.1.2. Products
- 12.1.1.3. Company Financials
- 12.1.1.4. SWOT Analysis
- 12.1.2 Furukawa Electric
- 12.1.2.1. Company Overview
- 12.1.2.2. Products
- 12.1.2.3. Company Financials
- 12.1.2.4. SWOT Analysis
- 12.1.3 Raychem RPG
- 12.1.3.1. Company Overview
- 12.1.3.2. Products
- 12.1.3.3. Company Financials
- 12.1.3.4. SWOT Analysis
- 12.1.4 Italchimici
- 12.1.4.1. Company Overview
- 12.1.4.2. Products
- 12.1.4.3. Company Financials
- 12.1.4.4. SWOT Analysis
- 12.1.5 Jointing Tech
- 12.1.5.1. Company Overview
- 12.1.5.2. Products
- 12.1.5.3. Company Financials
- 12.1.5.4. SWOT Analysis
- 12.1.6 Oriental Copper
- 12.1.6.1. Company Overview
- 12.1.6.2. Products
- 12.1.6.3. Company Financials
- 12.1.6.4. SWOT Analysis
- 12.1.7 Wetown Electric
- 12.1.7.1. Company Overview
- 12.1.7.2. Products
- 12.1.7.3. Company Financials
- 12.1.7.4. SWOT Analysis
- 12.1.1 ABB
- 12.2. Market Entropy
- 12.2.1 Company's Key Areas Served
- 12.2.2 Recent Developments
- 12.3. Company Market Share Analysis 2025
- 12.3.1 Top 5 Companies Market Share Analysis
- 12.3.2 Top 3 Companies Market Share Analysis
- 12.4. List of Potential Customers
- 13. Research Methodology
List of Figures
- Figure 1: Global High Conductivity Copper Bar Revenue Breakdown (undefined, %) by Region 2025 & 2033
- Figure 2: North America High Conductivity Copper Bar Revenue (undefined), by Application 2025 & 2033
- Figure 3: North America High Conductivity Copper Bar Revenue Share (%), by Application 2025 & 2033
- Figure 4: North America High Conductivity Copper Bar Revenue (undefined), by Type 2025 & 2033
- Figure 5: North America High Conductivity Copper Bar Revenue Share (%), by Type 2025 & 2033
- Figure 6: North America High Conductivity Copper Bar Revenue (undefined), by Country 2025 & 2033
- Figure 7: North America High Conductivity Copper Bar Revenue Share (%), by Country 2025 & 2033
- Figure 8: South America High Conductivity Copper Bar Revenue (undefined), by Application 2025 & 2033
- Figure 9: South America High Conductivity Copper Bar Revenue Share (%), by Application 2025 & 2033
- Figure 10: South America High Conductivity Copper Bar Revenue (undefined), by Type 2025 & 2033
- Figure 11: South America High Conductivity Copper Bar Revenue Share (%), by Type 2025 & 2033
- Figure 12: South America High Conductivity Copper Bar Revenue (undefined), by Country 2025 & 2033
- Figure 13: South America High Conductivity Copper Bar Revenue Share (%), by Country 2025 & 2033
- Figure 14: Europe High Conductivity Copper Bar Revenue (undefined), by Application 2025 & 2033
- Figure 15: Europe High Conductivity Copper Bar Revenue Share (%), by Application 2025 & 2033
- Figure 16: Europe High Conductivity Copper Bar Revenue (undefined), by Type 2025 & 2033
- Figure 17: Europe High Conductivity Copper Bar Revenue Share (%), by Type 2025 & 2033
- Figure 18: Europe High Conductivity Copper Bar Revenue (undefined), by Country 2025 & 2033
- Figure 19: Europe High Conductivity Copper Bar Revenue Share (%), by Country 2025 & 2033
- Figure 20: Middle East & Africa High Conductivity Copper Bar Revenue (undefined), by Application 2025 & 2033
- Figure 21: Middle East & Africa High Conductivity Copper Bar Revenue Share (%), by Application 2025 & 2033
- Figure 22: Middle East & Africa High Conductivity Copper Bar Revenue (undefined), by Type 2025 & 2033
- Figure 23: Middle East & Africa High Conductivity Copper Bar Revenue Share (%), by Type 2025 & 2033
- Figure 24: Middle East & Africa High Conductivity Copper Bar Revenue (undefined), by Country 2025 & 2033
- Figure 25: Middle East & Africa High Conductivity Copper Bar Revenue Share (%), by Country 2025 & 2033
- Figure 26: Asia Pacific High Conductivity Copper Bar Revenue (undefined), by Application 2025 & 2033
- Figure 27: Asia Pacific High Conductivity Copper Bar Revenue Share (%), by Application 2025 & 2033
- Figure 28: Asia Pacific High Conductivity Copper Bar Revenue (undefined), by Type 2025 & 2033
- Figure 29: Asia Pacific High Conductivity Copper Bar Revenue Share (%), by Type 2025 & 2033
- Figure 30: Asia Pacific High Conductivity Copper Bar Revenue (undefined), by Country 2025 & 2033
- Figure 31: Asia Pacific High Conductivity Copper Bar Revenue Share (%), by Country 2025 & 2033
List of Tables
- Table 1: Global High Conductivity Copper Bar Revenue undefined Forecast, by Application 2020 & 2033
- Table 2: Global High Conductivity Copper Bar Revenue undefined Forecast, by Type 2020 & 2033
- Table 3: Global High Conductivity Copper Bar Revenue undefined Forecast, by Region 2020 & 2033
- Table 4: Global High Conductivity Copper Bar Revenue undefined Forecast, by Application 2020 & 2033
- Table 5: Global High Conductivity Copper Bar Revenue undefined Forecast, by Type 2020 & 2033
- Table 6: Global High Conductivity Copper Bar Revenue undefined Forecast, by Country 2020 & 2033
- Table 7: United States High Conductivity Copper Bar Revenue (undefined) Forecast, by Application 2020 & 2033
- Table 8: Canada High Conductivity Copper Bar Revenue (undefined) Forecast, by Application 2020 & 2033
- Table 9: Mexico High Conductivity Copper Bar Revenue (undefined) Forecast, by Application 2020 & 2033
- Table 10: Global High Conductivity Copper Bar Revenue undefined Forecast, by Application 2020 & 2033
- Table 11: Global High Conductivity Copper Bar Revenue undefined Forecast, by Type 2020 & 2033
- Table 12: Global High Conductivity Copper Bar Revenue undefined Forecast, by Country 2020 & 2033
- Table 13: Brazil High Conductivity Copper Bar Revenue (undefined) Forecast, by Application 2020 & 2033
- Table 14: Argentina High Conductivity Copper Bar Revenue (undefined) Forecast, by Application 2020 & 2033
- Table 15: Rest of South America High Conductivity Copper Bar Revenue (undefined) Forecast, by Application 2020 & 2033
- Table 16: Global High Conductivity Copper Bar Revenue undefined Forecast, by Application 2020 & 2033
- Table 17: Global High Conductivity Copper Bar Revenue undefined Forecast, by Type 2020 & 2033
- Table 18: Global High Conductivity Copper Bar Revenue undefined Forecast, by Country 2020 & 2033
- Table 19: United Kingdom High Conductivity Copper Bar Revenue (undefined) Forecast, by Application 2020 & 2033
- Table 20: Germany High Conductivity Copper Bar Revenue (undefined) Forecast, by Application 2020 & 2033
- Table 21: France High Conductivity Copper Bar Revenue (undefined) Forecast, by Application 2020 & 2033
- Table 22: Italy High Conductivity Copper Bar Revenue (undefined) Forecast, by Application 2020 & 2033
- Table 23: Spain High Conductivity Copper Bar Revenue (undefined) Forecast, by Application 2020 & 2033
- Table 24: Russia High Conductivity Copper Bar Revenue (undefined) Forecast, by Application 2020 & 2033
- Table 25: Benelux High Conductivity Copper Bar Revenue (undefined) Forecast, by Application 2020 & 2033
- Table 26: Nordics High Conductivity Copper Bar Revenue (undefined) Forecast, by Application 2020 & 2033
- Table 27: Rest of Europe High Conductivity Copper Bar Revenue (undefined) Forecast, by Application 2020 & 2033
- Table 28: Global High Conductivity Copper Bar Revenue undefined Forecast, by Application 2020 & 2033
- Table 29: Global High Conductivity Copper Bar Revenue undefined Forecast, by Type 2020 & 2033
- Table 30: Global High Conductivity Copper Bar Revenue undefined Forecast, by Country 2020 & 2033
- Table 31: Turkey High Conductivity Copper Bar Revenue (undefined) Forecast, by Application 2020 & 2033
- Table 32: Israel High Conductivity Copper Bar Revenue (undefined) Forecast, by Application 2020 & 2033
- Table 33: GCC High Conductivity Copper Bar Revenue (undefined) Forecast, by Application 2020 & 2033
- Table 34: North Africa High Conductivity Copper Bar Revenue (undefined) Forecast, by Application 2020 & 2033
- Table 35: South Africa High Conductivity Copper Bar Revenue (undefined) Forecast, by Application 2020 & 2033
- Table 36: Rest of Middle East & Africa High Conductivity Copper Bar Revenue (undefined) Forecast, by Application 2020 & 2033
- Table 37: Global High Conductivity Copper Bar Revenue undefined Forecast, by Application 2020 & 2033
- Table 38: Global High Conductivity Copper Bar Revenue undefined Forecast, by Type 2020 & 2033
- Table 39: Global High Conductivity Copper Bar Revenue undefined Forecast, by Country 2020 & 2033
- Table 40: China High Conductivity Copper Bar Revenue (undefined) Forecast, by Application 2020 & 2033
- Table 41: India High Conductivity Copper Bar Revenue (undefined) Forecast, by Application 2020 & 2033
- Table 42: Japan High Conductivity Copper Bar Revenue (undefined) Forecast, by Application 2020 & 2033
- Table 43: South Korea High Conductivity Copper Bar Revenue (undefined) Forecast, by Application 2020 & 2033
- Table 44: ASEAN High Conductivity Copper Bar Revenue (undefined) Forecast, by Application 2020 & 2033
- Table 45: Oceania High Conductivity Copper Bar Revenue (undefined) Forecast, by Application 2020 & 2033
- Table 46: Rest of Asia Pacific High Conductivity Copper Bar Revenue (undefined) Forecast, by Application 2020 & 2033
Frequently Asked Questions
1. What is the projected Compound Annual Growth Rate (CAGR) of the High Conductivity Copper Bar?
The projected CAGR is approximately 2.2%.
2. Which companies are prominent players in the High Conductivity Copper Bar?
Key companies in the market include ABB, Furukawa Electric, Raychem RPG, Italchimici, Jointing Tech, Oriental Copper, Wetown Electric.
3. What are the main segments of the High Conductivity Copper Bar?
The market segments include Application, Type.
4. Can you provide details about the market size?
The market size is estimated to be USD XXX N/A as of 2022.
5. What are some drivers contributing to market growth?
N/A
6. What are the notable trends driving market growth?
N/A
7. Are there any restraints impacting market growth?
N/A
8. Can you provide examples of recent developments in the market?
N/A
9. What pricing options are available for accessing the report?
Pricing options include single-user, multi-user, and enterprise licenses priced at USD 4250.00, USD 6375.00, and USD 8500.00 respectively.
10. Is the market size provided in terms of value or volume?
The market size is provided in terms of value, measured in N/A.
11. Are there any specific market keywords associated with the report?
Yes, the market keyword associated with the report is "High Conductivity Copper Bar," which aids in identifying and referencing the specific market segment covered.
12. How do I determine which pricing option suits my needs best?
The pricing options vary based on user requirements and access needs. Individual users may opt for single-user licenses, while businesses requiring broader access may choose multi-user or enterprise licenses for cost-effective access to the report.
13. Are there any additional resources or data provided in the High Conductivity Copper Bar report?
While the report offers comprehensive insights, it's advisable to review the specific contents or supplementary materials provided to ascertain if additional resources or data are available.
14. How can I stay updated on further developments or reports in the High Conductivity Copper Bar?
To stay informed about further developments, trends, and reports in the High Conductivity Copper Bar, consider subscribing to industry newsletters, following relevant companies and organizations, or regularly checking reputable industry news sources and publications.
Methodology
Step 1 - Identification of Relevant Samples Size from Population Database


Step 2 - Approaches for Defining Global Market Size (Value, Volume* & Price*)

Note*: In applicable scenarios
Step 3 - Data Sources
Primary Research
- Web Analytics
- Survey Reports
- Research Institute
- Latest Research Reports
- Opinion Leaders
Secondary Research
- Annual Reports
- White Paper
- Latest Press Release
- Industry Association
- Paid Database
- Investor Presentations

Step 4 - Data Triangulation
Involves using different sources of information in order to increase the validity of a study
These sources are likely to be stakeholders in a program - participants, other researchers, program staff, other community members, and so on.
Then we put all data in single framework & apply various statistical tools to find out the dynamic on the market.
During the analysis stage, feedback from the stakeholder groups would be compared to determine areas of agreement as well as areas of divergence

