

Key Insights
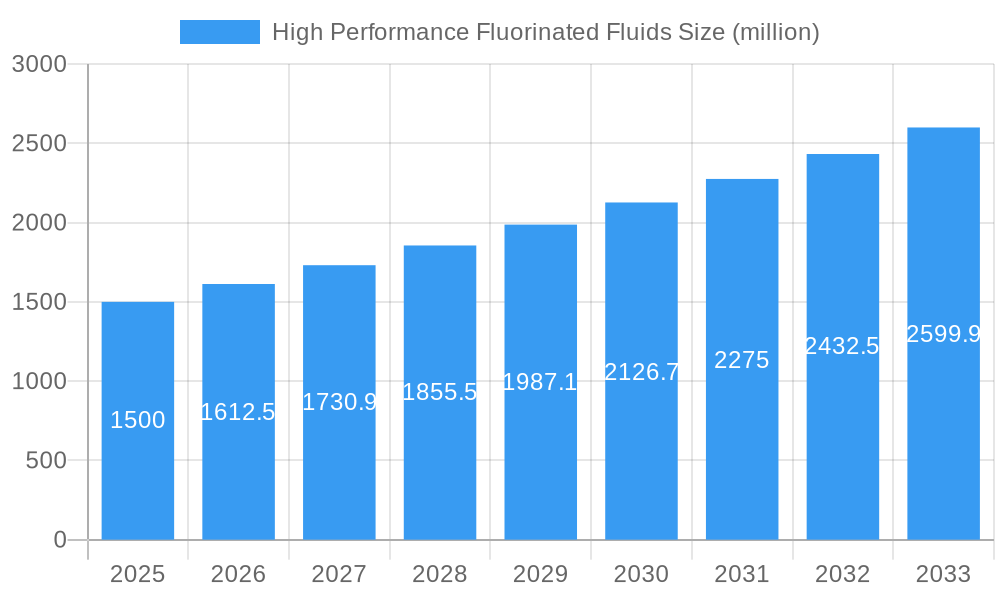
The global High Performance Fluorinated Fluids market is poised for significant expansion, projected to reach approximately \$1.5 billion by 2025 and experience a robust Compound Annual Growth Rate (CAGR) of around 7.5% through 2033. This upward trajectory is largely fueled by the escalating demand for advanced materials in critical sectors, most notably in the burgeoning electric vehicle (EV) battery market and the ever-expanding data center industry. These fluids, prized for their exceptional thermal stability, dielectric properties, and non-flammability, are indispensable for ensuring the safety, efficiency, and longevity of these high-stakes applications. Their role in effective heat management for batteries and cooling of densely packed servers makes them a vital component in the transition towards a more sustainable and digitally driven economy.
High Performance Fluorinated Fluids Market Size (In Billion)
The market's growth is further propelled by ongoing technological advancements and a continuous push for higher performance and miniaturization across various industries. Trends such as the increasing adoption of immersion cooling for data centers, designed to combat the heat generated by powerful computing systems, directly benefit the fluorinated fluids sector. Moreover, the development of next-generation battery technologies in EVs, requiring superior thermal management solutions, presents a substantial opportunity. However, potential restraints such as the high cost of production and stringent environmental regulations, though driving innovation towards more sustainable alternatives, could temper the pace of growth. Key players like 3M, Chemours, and Syensqo are actively investing in research and development to overcome these challenges and capitalize on emerging opportunities, with a particular focus on expanding their presence in the Asia Pacific region, which is emerging as a dominant force in manufacturing and technological adoption.
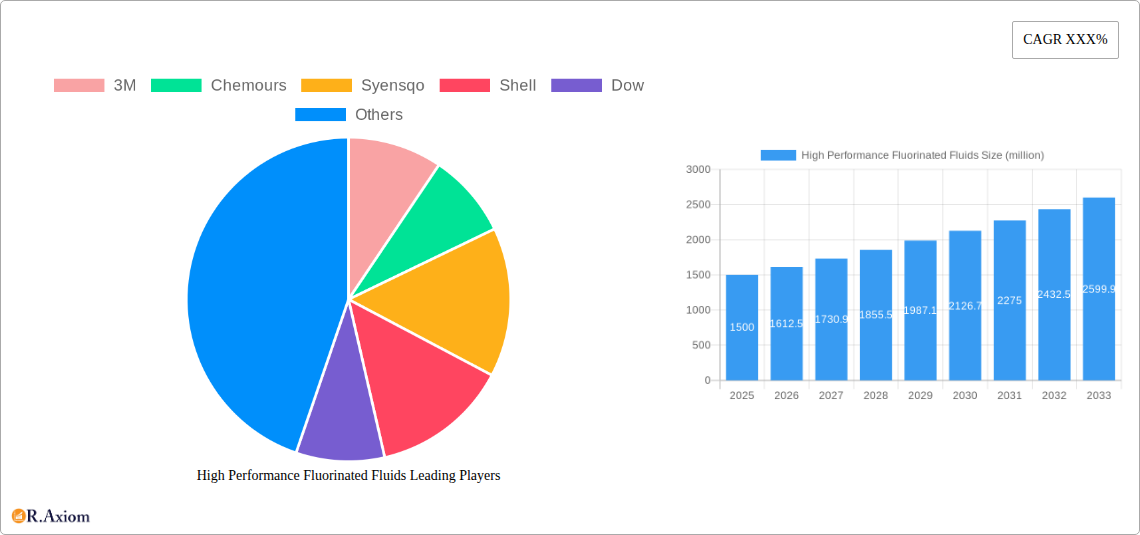
High Performance Fluorinated Fluids Company Market Share
High Performance Fluorinated Fluids Market Concentration & Innovation
The high-performance fluorinated fluids market exhibits a moderate to high concentration, driven by the significant research and development investments, stringent quality control, and specialized manufacturing processes required. Key industry players like 3M, Chemours, Syensqo, Shell, Dow, ExxonMobil, Hexafluo, Zhejiang Noah Fluorochemical, Juhua, TMC Industries, and Shenzhen Capchem Technology are at the forefront of innovation. The study period of 2019–2033, with a base year of 2025, reveals a dynamic landscape where technological advancements are paramount. Innovation drivers include the burgeoning demand for advanced cooling solutions in data centers, the exponential growth of electric vehicle battery thermal management, and the development of specialized lubricants for extreme environments.
- Market Share Analysis: Leading companies command substantial market shares, with 3M and Chemours historically holding significant positions in perfluoropolyether (PFPE) and hydrofluoroether (HFE) segments. Zhejiang Noah Fluorochemical and Juhua are increasingly important players, particularly in emerging economies.
- Innovation Drivers:
- Development of next-generation fluids with enhanced thermal conductivity and dielectric properties for high-density electronics.
- Focus on environmentally sustainable fluorinated fluids with lower global warming potential (GWP) and improved recyclability.
- Tailoring fluid formulations for specific applications like advanced battery chemistries and immersion cooling in supercomputing.
- Regulatory Frameworks: Evolving environmental regulations (e.g., PFAS restrictions) are a critical factor, pushing innovation towards safer and more sustainable alternatives. Compliance with REACH, TSCA, and other regional chemical control laws is essential for market access.
- Product Substitutes: While high-performance fluorinated fluids offer unique properties, research into advanced dielectric coolants and specialized synthetic oils continues, posing potential long-term competition.
- End-User Trends: Increasing adoption of immersion cooling in data centers, a surge in EV battery thermal management systems, and demand for high-performance lubricants in aerospace and industrial applications are key trends.
- M&A Activities: M&A activities, with deal values in the tens to hundreds of millions, are expected to continue as larger players seek to consolidate market share, acquire innovative technologies, or expand their geographical reach. For instance, the acquisition of specialty chemical assets or partnerships for sustainable fluid development are anticipated.
High Performance Fluorinated Fluids Industry Trends & Insights
The high-performance fluorinated fluids market is poised for substantial growth throughout the study period of 2019–2033, driven by a confluence of technological advancements, evolving consumer preferences, and critical industry developments. The base year of 2025 serves as a pivotal point for assessing current market penetration and projecting future trajectories, with a forecast period extending to 2033. A Compound Annual Growth Rate (CAGR) of approximately 7.5% to 9% is anticipated, reflecting the robust demand across various high-value applications.
Technological disruptions are at the core of this market's dynamism. The exponential growth of the data center industry, particularly the rise of hyperscale and edge computing, necessitates highly efficient and reliable cooling solutions. High-performance fluorinated fluids, especially perfluoropolyethers (PFPEs) and hydrofluoroethers (HFEs), are ideally suited for immersion cooling applications due to their excellent thermal conductivity, dielectric strength, and chemical inertness. This allows for direct contact cooling of high-density server racks, significantly improving energy efficiency and enabling denser computing architectures. The market penetration of immersion cooling technologies, currently estimated at around 15% in cutting-edge data centers, is projected to reach over 40% by 2033, directly fueling demand for these specialized fluids.
Simultaneously, the electric vehicle (EV) revolution is a major growth catalyst. As battery energy density increases and charging speeds accelerate, effective thermal management of EV batteries becomes paramount for performance, longevity, and safety. High-performance fluorinated fluids are increasingly being adopted for direct or indirect battery cooling systems, preventing thermal runaway and ensuring optimal operating temperatures across a wide range of environmental conditions. The projected surge in global EV sales, from an estimated 15 million units in 2025 to over 50 million units by 2033, translates into a substantial increase in the demand for these advanced cooling fluids.
Consumer preferences are indirectly influencing market trends. The growing emphasis on sustainability and energy efficiency across all industries is driving demand for solutions that reduce energy consumption and environmental impact. While fluorinated fluids face scrutiny regarding their environmental profile, continuous innovation in developing fluids with lower Global Warming Potential (GWP) and improved recyclability is addressing these concerns. Manufacturers are investing heavily in research to create next-generation fluorinated fluids that meet stringent environmental regulations while maintaining superior performance.
Competitive dynamics are intensifying among established players like 3M, Chemours, and Syensqo, alongside emerging manufacturers from Asia, such as Zhejiang Noah Fluorochemical and Juhua. These companies are engaged in a race to develop proprietary formulations, secure supply chains, and establish strong distribution networks. Strategic partnerships and acquisitions are also shaping the competitive landscape, as companies seek to expand their product portfolios and market reach. For instance, collaborations between fluid manufacturers and EV battery producers or data center hardware suppliers are becoming more prevalent. The market is also witnessing a gradual shift towards more specialized, application-specific fluid formulations, moving beyond generic offerings. The historical period (2019–2024) laid the groundwork for these trends, with initial investments in R&D and early adoption in niche applications paving the way for the accelerated growth observed from the base year of 2025 onwards.
Dominant Markets & Segments in High Performance Fluorinated Fluids
The high-performance fluorinated fluids market is experiencing significant expansion, with distinct regional and sectoral dominance shaping its trajectory. The forecast period of 2025–2033 is expected to witness continued growth across all segments, driven by technological advancements and increasing adoption rates.
Dominant Region: North America and Asia Pacific
North America, particularly the United States, currently leads the market, driven by its advanced technological infrastructure, substantial investments in data centers, and a mature automotive industry undergoing rapid electrification. The presence of major chemical manufacturers like 3M and Dow further bolsters its dominance. However, the Asia Pacific region, encompassing China, Japan, and South Korea, is rapidly emerging as a dominant force. China, with its colossal manufacturing base, burgeoning EV market, and significant investments in data center expansion, is projected to become the largest market for high-performance fluorinated fluids by the end of the forecast period. Government initiatives supporting high-tech industries and a strong focus on domestic production of advanced materials are key drivers in this region. Economic policies promoting green energy and technological self-sufficiency in countries like South Korea and Japan also contribute to the region’s robust growth.
- Key Drivers for North America:
- Extensive hyperscale data center development and adoption of advanced cooling technologies.
- Strong presence of leading global chemical manufacturers and R&D centers.
- High EV adoption rates and advanced automotive battery technology development.
- Supportive regulatory environment for specialized chemicals in specific applications.
- Key Drivers for Asia Pacific:
- Rapid expansion of the electric vehicle market, leading to massive demand for battery thermal management fluids.
- Explosive growth in data center infrastructure to support the digital economy.
- Government support for advanced manufacturing and high-technology sectors, including fluorochemicals.
- Increasing adoption of high-performance industrial lubricants and specialty fluids.
- Competitive pricing and growing local production capabilities.
Dominant Segments:
Application: Battery Segment The Battery application segment is emerging as the fastest-growing and a dominant force within the high-performance fluorinated fluids market. The exponential growth of the electric vehicle industry, coupled with the increasing demand for advanced battery technologies in consumer electronics and energy storage systems, is a primary driver. As battery energy density and charging speeds increase, efficient and reliable thermal management becomes critical to ensure performance, longevity, and safety. High-performance fluorinated fluids, such as those from the Hydrofluoroether (HFE) and Perfluoropolyether (PFPE) families, are indispensable for direct immersion cooling and other advanced thermal management solutions. The need to prevent thermal runaway, optimize operating temperatures across diverse climatic conditions, and extend battery lifespan directly fuels this segment's dominance. Projections indicate that the Battery segment alone will account for over 40% of the total market share by 2033, driven by continued innovation in battery chemistry and thermal management systems.
Type: Perfluoropolyether (PFPE) Within the "Type" segmentation, Perfluoropolyether (PFPE) fluids are currently the dominant category and are expected to maintain their leadership. PFPEs offer unparalleled thermal stability, chemical inertness, low volatility, and excellent lubricity, making them ideal for the most demanding applications. Their superior performance characteristics are critical in high-temperature environments, vacuum applications, and where resistance to aggressive chemicals is required. The growth in data center immersion cooling and advanced aerospace lubricants directly benefits the PFPE segment. While their higher cost can be a factor, the critical performance requirements in these high-value applications justify their adoption. The forecast period will see continued innovation in PFPE formulations to further enhance properties like dielectric constant and thermal conductivity, solidifying their dominant position.
Application: Data Center Segment The Data Center segment is another significant driver of the high-performance fluorinated fluids market. The relentless growth of cloud computing, artificial intelligence, and big data analytics is necessitating the development of more powerful and densely packed server infrastructure. Traditional air cooling methods are becoming increasingly inadequate, leading to the widespread adoption of liquid cooling technologies, particularly immersion cooling. High-performance fluorinated fluids are essential for these systems due to their excellent dielectric properties, preventing short circuits, and their high thermal conductivity, enabling efficient heat dissipation. As hyperscale and edge data centers continue to expand globally, the demand for these specialized fluids for both single-phase and two-phase immersion cooling will continue to grow robustly. The segment is projected to hold a substantial market share, estimated at over 30% by 2033.
High Performance Fluorinated Fluids Product Developments
Recent product developments in high-performance fluorinated fluids are intensely focused on enhancing sustainability, improving performance metrics, and catering to specialized niche applications. Manufacturers are actively developing next-generation perfluoropolyether (PFPE) and hydrofluoroether (HFE) formulations with lower Global Warming Potential (GWP) and improved biodegradability, responding to increasing environmental regulations and market demand for greener solutions. Innovations include fluids with superior thermal conductivity and dielectric strength for advanced battery thermal management in electric vehicles and for efficient immersion cooling in high-density data centers. Competitive advantages are being secured through customized fluid formulations that precisely match application requirements, offering enhanced thermal stability, reduced viscosity, and improved material compatibility, thereby extending equipment lifespan and operational efficiency.
Report Scope & Segmentation Analysis
This report provides a comprehensive analysis of the global high-performance fluorinated fluids market from 2019 to 2033. The study is segmented across key dimensions to offer detailed insights into market dynamics and growth projections.
Application Segments: The market is analyzed by application, with a granular breakdown of:
- Battery: This segment encompasses fluids used for thermal management in electric vehicle batteries, consumer electronics, and energy storage systems. Growth is projected at a substantial CAGR, driven by EV adoption.
- Data Center: This segment covers fluids for immersion cooling and advanced cooling solutions in servers and IT infrastructure. Expected to exhibit robust growth due to increasing data demands.
- Others: This includes a broad range of applications such as aerospace, industrial lubrication, medical equipment, and semiconductor manufacturing. This segment is expected to show steady, consistent growth.
Type Segments: The market is further segmented by fluid type:
- Perfluoropolyether (PFPE): Known for its exceptional thermal and chemical stability, PFPEs are dominant in high-performance applications. This segment is anticipated to maintain strong market share and consistent growth.
- Hydrofluoroether (HFE): Offering a balance of performance and environmental considerations, HFEs are gaining traction, particularly in emerging applications. This segment is projected for significant growth.
- Other: This category includes other specialized fluorinated fluids and evolving chemistries. Expected to grow as new formulations emerge and find niche applications.
Key Drivers of High Performance Fluorinated Fluids Growth
The growth of the high-performance fluorinated fluids market is propelled by several interconnected drivers:
- Technological Advancement in EVs: The surging demand for electric vehicles necessitates advanced thermal management solutions for batteries to ensure safety, performance, and longevity. High-performance fluorinated fluids are crucial for efficient battery cooling.
- Data Center Expansion and Immersion Cooling Adoption: The exponential growth of data centers, coupled with the increasing adoption of energy-efficient immersion cooling technologies, directly fuels the demand for specialized dielectric fluids.
- Stringent Performance Requirements in Industrial Applications: Sectors like aerospace, semiconductor manufacturing, and specialized machinery require fluids with extreme temperature resistance, chemical inertness, and superior lubricity, where fluorinated fluids excel.
- Innovation in Fluid Formulations: Continuous R&D efforts are yielding next-generation fluorinated fluids with improved environmental profiles (lower GWP), enhanced thermal conductivity, and better material compatibility, broadening their application scope.
- Government Initiatives and Regulations: While regulations can pose challenges, they also drive innovation towards safer and more sustainable fluorinated fluids, creating new market opportunities for compliant products.
Challenges in the High Performance Fluorinated Fluids Sector
Despite robust growth, the high-performance fluorinated fluids sector faces several significant challenges:
- Environmental Regulations and PFAS Scrutiny: Increasing global regulations around per- and polyfluoroalkyl substances (PFAS) due to their persistence in the environment pose a significant hurdle. Manufacturers must invest heavily in developing alternatives with lower environmental impact or alternative chemistries.
- High Production Costs and Raw Material Volatility: The specialized manufacturing processes and the cost of raw materials for fluorinated fluids contribute to high selling prices, which can limit adoption in cost-sensitive applications. Fluctuations in raw material availability and pricing can impact profitability.
- Competition from Alternative Technologies: While fluorinated fluids offer unique advantages, ongoing research into other dielectric coolants and advanced lubrication technologies presents potential long-term competition.
- Supply Chain Complexities: The global supply chain for fluorinated chemicals can be complex and susceptible to disruptions, impacting availability and lead times.
- Need for Specialized Handling and Disposal: The specialized nature of these fluids requires careful handling, application, and disposal procedures, adding to operational costs and complexity for end-users.
Emerging Opportunities in High Performance Fluorinated Fluids
The high-performance fluorinated fluids market is ripe with emerging opportunities driven by innovation and evolving industry demands:
- Development of Ultra-Low GWP Fluids: The most significant opportunity lies in developing and commercializing fluorinated fluids with ultra-low Global Warming Potential (GWP), meeting stringent environmental regulations and capturing market share from less sustainable options.
- Expansion in Next-Generation Battery Technologies: As solid-state batteries and advanced lithium-ion chemistries mature, there will be a growing need for specialized fluorinated fluids to manage their unique thermal characteristics and ensure safety.
- Growth in Advanced Semiconductor Manufacturing: The increasing complexity of semiconductor fabrication processes, requiring ultra-pure chemicals and precise temperature control, presents opportunities for highly specialized fluorinated fluids.
- Smart Grid and Renewable Energy Storage: The expansion of smart grids and large-scale renewable energy storage systems will create demand for reliable and high-performance fluids for associated power electronics and battery systems.
- Circular Economy Initiatives: Opportunities exist in developing and implementing robust recycling and reclamation processes for used fluorinated fluids, aligning with circular economy principles and reducing overall environmental impact.
Leading Players in the High Performance Fluorinated Fluids Market
- 3M
- Chemours
- Syensqo
- Shell
- Dow
- ExxonMobil
- Hexafluo
- Zhejiang Noah Fluorochemical
- Juhua
- TMC Industries
- Shenzhen Capchem Technology
Key Developments in High Performance Fluorinated Fluids Industry
- 2023/10: Syensqo unveils new generation of sustainable fluorinated fluids with reduced GWP for advanced cooling applications.
- 2023/07: Chemours announces significant investment in expanding production capacity for specialty fluorochemicals supporting EV battery market.
- 2023/03: Zhejiang Noah Fluorochemical launches a new series of high-performance PFPEs tailored for demanding industrial lubrication needs.
- 2022/11: 3M introduces a novel HFE fluid designed for enhanced thermal management in AI-driven data center infrastructure.
- 2022/08: Juhua Group announces strategic partnership to develop more environmentally friendly fluorinated fluids.
- 2021/05: Shell expands its portfolio of specialized fluorinated lubricants for aerospace and defense applications.
- 2020/09: Dow Chemical announces advancements in its fluorinated fluids offering, focusing on dielectric properties for electronics.
- 2019/04: TMC Industries develops innovative fluorinated dielectric coolants to meet the growing demands of high-density server cooling.
Strategic Outlook for High Performance Fluorinated Fluids Market
The strategic outlook for the high-performance fluorinated fluids market remains exceptionally positive, driven by continuous innovation and expanding applications in critical high-growth sectors. The primary growth catalysts will be the accelerating adoption of electric vehicles, demanding more sophisticated battery thermal management, and the relentless expansion of data center infrastructure, necessitating advanced immersion cooling solutions. Companies that can successfully navigate the evolving regulatory landscape by developing and commercializing environmentally sustainable fluids with low GWP will gain a significant competitive advantage. Strategic investments in research and development, focusing on enhanced thermal conductivity, dielectric properties, and material compatibility, will be crucial for market leadership. Furthermore, forging strong partnerships with key end-users in the automotive, electronics, and IT industries will be vital for co-developing tailored solutions and securing long-term market access. The market's future is characterized by a sustained demand for high-performance, reliable, and increasingly sustainable fluorinated fluid solutions.
High Performance Fluorinated Fluids Segmentation
-
1. Application
- 1.1. Battery
- 1.2. Data Center
- 1.3. Others
-
2. Type
- 2.1. Perfluoropolyether
- 2.2. Hydrofluoroether
- 2.3. Other
High Performance Fluorinated Fluids Segmentation By Geography
-
1. North America
- 1.1. United States
- 1.2. Canada
- 1.3. Mexico
-
2. South America
- 2.1. Brazil
- 2.2. Argentina
- 2.3. Rest of South America
-
3. Europe
- 3.1. United Kingdom
- 3.2. Germany
- 3.3. France
- 3.4. Italy
- 3.5. Spain
- 3.6. Russia
- 3.7. Benelux
- 3.8. Nordics
- 3.9. Rest of Europe
-
4. Middle East & Africa
- 4.1. Turkey
- 4.2. Israel
- 4.3. GCC
- 4.4. North Africa
- 4.5. South Africa
- 4.6. Rest of Middle East & Africa
-
5. Asia Pacific
- 5.1. China
- 5.2. India
- 5.3. Japan
- 5.4. South Korea
- 5.5. ASEAN
- 5.6. Oceania
- 5.7. Rest of Asia Pacific
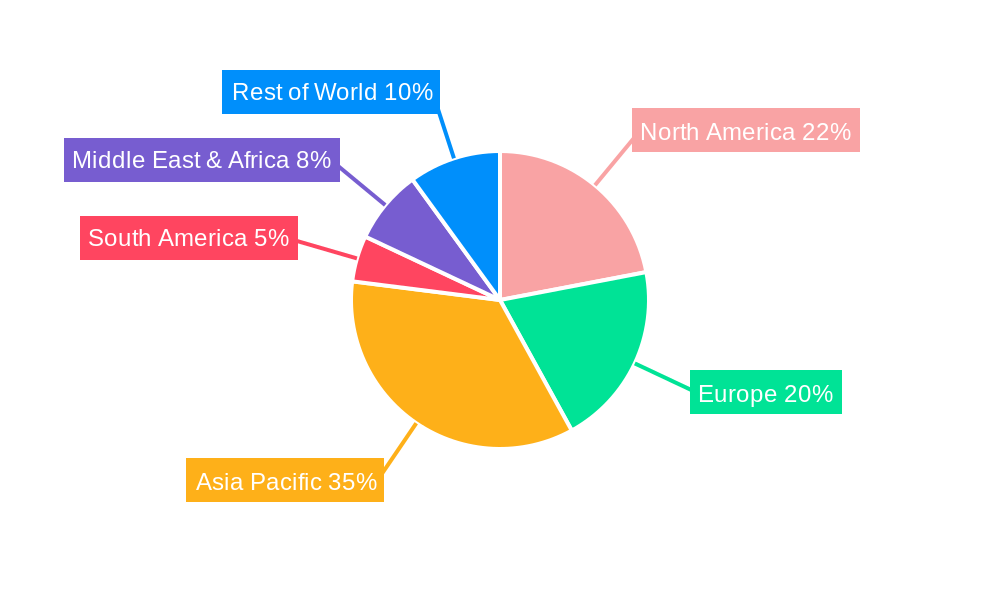
High Performance Fluorinated Fluids Regional Market Share
Geographic Coverage of High Performance Fluorinated Fluids
High Performance Fluorinated Fluids REPORT HIGHLIGHTS
| Aspects | Details |
|---|---|
| Study Period | 2020-2034 |
| Base Year | 2025 |
| Estimated Year | 2026 |
| Forecast Period | 2026-2034 |
| Historical Period | 2020-2025 |
| Growth Rate | CAGR of 13.98% from 2020-2034 |
| Segmentation |
|
Table of Contents
- 1. Introduction
- 1.1. Research Scope
- 1.2. Market Segmentation
- 1.3. Research Objective
- 1.4. Definitions and Assumptions
- 2. Executive Summary
- 2.1. Market Snapshot
- 3. Market Dynamics
- 3.1. Market Drivers
- 3.2. Market Restrains
- 3.3. Market Trends
- 3.4. Market Opportunities
- 4. Market Factor Analysis
- 4.1. Porters Five Forces
- 4.1.1. Bargaining Power of Suppliers
- 4.1.2. Bargaining Power of Buyers
- 4.1.3. Threat of New Entrants
- 4.1.4. Threat of Substitutes
- 4.1.5. Competitive Rivalry
- 4.2. PESTEL analysis
- 4.3. BCG Analysis
- 4.3.1. Stars (High Growth, High Market Share)
- 4.3.2. Cash Cows (Low Growth, High Market Share)
- 4.3.3. Question Mark (High Growth, Low Market Share)
- 4.3.4. Dogs (Low Growth, Low Market Share)
- 4.4. Ansoff Matrix Analysis
- 4.5. Supply Chain Analysis
- 4.6. Regulatory Landscape
- 4.7. Current Market Potential and Opportunity Assessment (TAM–SAM–SOM Framework)
- 4.8. RAX Analyst Note
- 4.1. Porters Five Forces
- 5. Market Analysis, Insights and Forecast 2021-2033
- 5.1. Market Analysis, Insights and Forecast - by Application
- 5.1.1. Battery
- 5.1.2. Data Center
- 5.1.3. Others
- 5.2. Market Analysis, Insights and Forecast - by Type
- 5.2.1. Perfluoropolyether
- 5.2.2. Hydrofluoroether
- 5.2.3. Other
- 5.3. Market Analysis, Insights and Forecast - by Region
- 5.3.1. North America
- 5.3.2. South America
- 5.3.3. Europe
- 5.3.4. Middle East & Africa
- 5.3.5. Asia Pacific
- 5.1. Market Analysis, Insights and Forecast - by Application
- 6. Global High Performance Fluorinated Fluids Analysis, Insights and Forecast, 2021-2033
- 6.1. Market Analysis, Insights and Forecast - by Application
- 6.1.1. Battery
- 6.1.2. Data Center
- 6.1.3. Others
- 6.2. Market Analysis, Insights and Forecast - by Type
- 6.2.1. Perfluoropolyether
- 6.2.2. Hydrofluoroether
- 6.2.3. Other
- 6.1. Market Analysis, Insights and Forecast - by Application
- 7. North America High Performance Fluorinated Fluids Analysis, Insights and Forecast, 2020-2032
- 7.1. Market Analysis, Insights and Forecast - by Application
- 7.1.1. Battery
- 7.1.2. Data Center
- 7.1.3. Others
- 7.2. Market Analysis, Insights and Forecast - by Type
- 7.2.1. Perfluoropolyether
- 7.2.2. Hydrofluoroether
- 7.2.3. Other
- 7.1. Market Analysis, Insights and Forecast - by Application
- 8. South America High Performance Fluorinated Fluids Analysis, Insights and Forecast, 2020-2032
- 8.1. Market Analysis, Insights and Forecast - by Application
- 8.1.1. Battery
- 8.1.2. Data Center
- 8.1.3. Others
- 8.2. Market Analysis, Insights and Forecast - by Type
- 8.2.1. Perfluoropolyether
- 8.2.2. Hydrofluoroether
- 8.2.3. Other
- 8.1. Market Analysis, Insights and Forecast - by Application
- 9. Europe High Performance Fluorinated Fluids Analysis, Insights and Forecast, 2020-2032
- 9.1. Market Analysis, Insights and Forecast - by Application
- 9.1.1. Battery
- 9.1.2. Data Center
- 9.1.3. Others
- 9.2. Market Analysis, Insights and Forecast - by Type
- 9.2.1. Perfluoropolyether
- 9.2.2. Hydrofluoroether
- 9.2.3. Other
- 9.1. Market Analysis, Insights and Forecast - by Application
- 10. Middle East & Africa High Performance Fluorinated Fluids Analysis, Insights and Forecast, 2020-2032
- 10.1. Market Analysis, Insights and Forecast - by Application
- 10.1.1. Battery
- 10.1.2. Data Center
- 10.1.3. Others
- 10.2. Market Analysis, Insights and Forecast - by Type
- 10.2.1. Perfluoropolyether
- 10.2.2. Hydrofluoroether
- 10.2.3. Other
- 10.1. Market Analysis, Insights and Forecast - by Application
- 11. Asia Pacific High Performance Fluorinated Fluids Analysis, Insights and Forecast, 2020-2032
- 11.1. Market Analysis, Insights and Forecast - by Application
- 11.1.1. Battery
- 11.1.2. Data Center
- 11.1.3. Others
- 11.2. Market Analysis, Insights and Forecast - by Type
- 11.2.1. Perfluoropolyether
- 11.2.2. Hydrofluoroether
- 11.2.3. Other
- 11.1. Market Analysis, Insights and Forecast - by Application
- 12. Competitive Analysis
- 12.1. Company Profiles
- 12.1.1 3M
- 12.1.1.1. Company Overview
- 12.1.1.2. Products
- 12.1.1.3. Company Financials
- 12.1.1.4. SWOT Analysis
- 12.1.2 Chemours
- 12.1.2.1. Company Overview
- 12.1.2.2. Products
- 12.1.2.3. Company Financials
- 12.1.2.4. SWOT Analysis
- 12.1.3 Syensqo
- 12.1.3.1. Company Overview
- 12.1.3.2. Products
- 12.1.3.3. Company Financials
- 12.1.3.4. SWOT Analysis
- 12.1.4 Shell
- 12.1.4.1. Company Overview
- 12.1.4.2. Products
- 12.1.4.3. Company Financials
- 12.1.4.4. SWOT Analysis
- 12.1.5 Dow
- 12.1.5.1. Company Overview
- 12.1.5.2. Products
- 12.1.5.3. Company Financials
- 12.1.5.4. SWOT Analysis
- 12.1.6 ExxonMobil
- 12.1.6.1. Company Overview
- 12.1.6.2. Products
- 12.1.6.3. Company Financials
- 12.1.6.4. SWOT Analysis
- 12.1.7 Hexafluo
- 12.1.7.1. Company Overview
- 12.1.7.2. Products
- 12.1.7.3. Company Financials
- 12.1.7.4. SWOT Analysis
- 12.1.8 Zhejiang Noah Fluorochemical
- 12.1.8.1. Company Overview
- 12.1.8.2. Products
- 12.1.8.3. Company Financials
- 12.1.8.4. SWOT Analysis
- 12.1.9 Juhua
- 12.1.9.1. Company Overview
- 12.1.9.2. Products
- 12.1.9.3. Company Financials
- 12.1.9.4. SWOT Analysis
- 12.1.10 TMC Industries
- 12.1.10.1. Company Overview
- 12.1.10.2. Products
- 12.1.10.3. Company Financials
- 12.1.10.4. SWOT Analysis
- 12.1.11 Shenzhen Capchem Technology
- 12.1.11.1. Company Overview
- 12.1.11.2. Products
- 12.1.11.3. Company Financials
- 12.1.11.4. SWOT Analysis
- 12.1.1 3M
- 12.2. Market Entropy
- 12.2.1 Company's Key Areas Served
- 12.2.2 Recent Developments
- 12.3. Company Market Share Analysis 2025
- 12.3.1 Top 5 Companies Market Share Analysis
- 12.3.2 Top 3 Companies Market Share Analysis
- 12.4. List of Potential Customers
- 13. Research Methodology
List of Figures
- Figure 1: Global High Performance Fluorinated Fluids Revenue Breakdown (undefined, %) by Region 2025 & 2033
- Figure 2: Global High Performance Fluorinated Fluids Volume Breakdown (K, %) by Region 2025 & 2033
- Figure 3: North America High Performance Fluorinated Fluids Revenue (undefined), by Application 2025 & 2033
- Figure 4: North America High Performance Fluorinated Fluids Volume (K), by Application 2025 & 2033
- Figure 5: North America High Performance Fluorinated Fluids Revenue Share (%), by Application 2025 & 2033
- Figure 6: North America High Performance Fluorinated Fluids Volume Share (%), by Application 2025 & 2033
- Figure 7: North America High Performance Fluorinated Fluids Revenue (undefined), by Type 2025 & 2033
- Figure 8: North America High Performance Fluorinated Fluids Volume (K), by Type 2025 & 2033
- Figure 9: North America High Performance Fluorinated Fluids Revenue Share (%), by Type 2025 & 2033
- Figure 10: North America High Performance Fluorinated Fluids Volume Share (%), by Type 2025 & 2033
- Figure 11: North America High Performance Fluorinated Fluids Revenue (undefined), by Country 2025 & 2033
- Figure 12: North America High Performance Fluorinated Fluids Volume (K), by Country 2025 & 2033
- Figure 13: North America High Performance Fluorinated Fluids Revenue Share (%), by Country 2025 & 2033
- Figure 14: North America High Performance Fluorinated Fluids Volume Share (%), by Country 2025 & 2033
- Figure 15: South America High Performance Fluorinated Fluids Revenue (undefined), by Application 2025 & 2033
- Figure 16: South America High Performance Fluorinated Fluids Volume (K), by Application 2025 & 2033
- Figure 17: South America High Performance Fluorinated Fluids Revenue Share (%), by Application 2025 & 2033
- Figure 18: South America High Performance Fluorinated Fluids Volume Share (%), by Application 2025 & 2033
- Figure 19: South America High Performance Fluorinated Fluids Revenue (undefined), by Type 2025 & 2033
- Figure 20: South America High Performance Fluorinated Fluids Volume (K), by Type 2025 & 2033
- Figure 21: South America High Performance Fluorinated Fluids Revenue Share (%), by Type 2025 & 2033
- Figure 22: South America High Performance Fluorinated Fluids Volume Share (%), by Type 2025 & 2033
- Figure 23: South America High Performance Fluorinated Fluids Revenue (undefined), by Country 2025 & 2033
- Figure 24: South America High Performance Fluorinated Fluids Volume (K), by Country 2025 & 2033
- Figure 25: South America High Performance Fluorinated Fluids Revenue Share (%), by Country 2025 & 2033
- Figure 26: South America High Performance Fluorinated Fluids Volume Share (%), by Country 2025 & 2033
- Figure 27: Europe High Performance Fluorinated Fluids Revenue (undefined), by Application 2025 & 2033
- Figure 28: Europe High Performance Fluorinated Fluids Volume (K), by Application 2025 & 2033
- Figure 29: Europe High Performance Fluorinated Fluids Revenue Share (%), by Application 2025 & 2033
- Figure 30: Europe High Performance Fluorinated Fluids Volume Share (%), by Application 2025 & 2033
- Figure 31: Europe High Performance Fluorinated Fluids Revenue (undefined), by Type 2025 & 2033
- Figure 32: Europe High Performance Fluorinated Fluids Volume (K), by Type 2025 & 2033
- Figure 33: Europe High Performance Fluorinated Fluids Revenue Share (%), by Type 2025 & 2033
- Figure 34: Europe High Performance Fluorinated Fluids Volume Share (%), by Type 2025 & 2033
- Figure 35: Europe High Performance Fluorinated Fluids Revenue (undefined), by Country 2025 & 2033
- Figure 36: Europe High Performance Fluorinated Fluids Volume (K), by Country 2025 & 2033
- Figure 37: Europe High Performance Fluorinated Fluids Revenue Share (%), by Country 2025 & 2033
- Figure 38: Europe High Performance Fluorinated Fluids Volume Share (%), by Country 2025 & 2033
- Figure 39: Middle East & Africa High Performance Fluorinated Fluids Revenue (undefined), by Application 2025 & 2033
- Figure 40: Middle East & Africa High Performance Fluorinated Fluids Volume (K), by Application 2025 & 2033
- Figure 41: Middle East & Africa High Performance Fluorinated Fluids Revenue Share (%), by Application 2025 & 2033
- Figure 42: Middle East & Africa High Performance Fluorinated Fluids Volume Share (%), by Application 2025 & 2033
- Figure 43: Middle East & Africa High Performance Fluorinated Fluids Revenue (undefined), by Type 2025 & 2033
- Figure 44: Middle East & Africa High Performance Fluorinated Fluids Volume (K), by Type 2025 & 2033
- Figure 45: Middle East & Africa High Performance Fluorinated Fluids Revenue Share (%), by Type 2025 & 2033
- Figure 46: Middle East & Africa High Performance Fluorinated Fluids Volume Share (%), by Type 2025 & 2033
- Figure 47: Middle East & Africa High Performance Fluorinated Fluids Revenue (undefined), by Country 2025 & 2033
- Figure 48: Middle East & Africa High Performance Fluorinated Fluids Volume (K), by Country 2025 & 2033
- Figure 49: Middle East & Africa High Performance Fluorinated Fluids Revenue Share (%), by Country 2025 & 2033
- Figure 50: Middle East & Africa High Performance Fluorinated Fluids Volume Share (%), by Country 2025 & 2033
- Figure 51: Asia Pacific High Performance Fluorinated Fluids Revenue (undefined), by Application 2025 & 2033
- Figure 52: Asia Pacific High Performance Fluorinated Fluids Volume (K), by Application 2025 & 2033
- Figure 53: Asia Pacific High Performance Fluorinated Fluids Revenue Share (%), by Application 2025 & 2033
- Figure 54: Asia Pacific High Performance Fluorinated Fluids Volume Share (%), by Application 2025 & 2033
- Figure 55: Asia Pacific High Performance Fluorinated Fluids Revenue (undefined), by Type 2025 & 2033
- Figure 56: Asia Pacific High Performance Fluorinated Fluids Volume (K), by Type 2025 & 2033
- Figure 57: Asia Pacific High Performance Fluorinated Fluids Revenue Share (%), by Type 2025 & 2033
- Figure 58: Asia Pacific High Performance Fluorinated Fluids Volume Share (%), by Type 2025 & 2033
- Figure 59: Asia Pacific High Performance Fluorinated Fluids Revenue (undefined), by Country 2025 & 2033
- Figure 60: Asia Pacific High Performance Fluorinated Fluids Volume (K), by Country 2025 & 2033
- Figure 61: Asia Pacific High Performance Fluorinated Fluids Revenue Share (%), by Country 2025 & 2033
- Figure 62: Asia Pacific High Performance Fluorinated Fluids Volume Share (%), by Country 2025 & 2033
List of Tables
- Table 1: Global High Performance Fluorinated Fluids Revenue undefined Forecast, by Application 2020 & 2033
- Table 2: Global High Performance Fluorinated Fluids Volume K Forecast, by Application 2020 & 2033
- Table 3: Global High Performance Fluorinated Fluids Revenue undefined Forecast, by Type 2020 & 2033
- Table 4: Global High Performance Fluorinated Fluids Volume K Forecast, by Type 2020 & 2033
- Table 5: Global High Performance Fluorinated Fluids Revenue undefined Forecast, by Region 2020 & 2033
- Table 6: Global High Performance Fluorinated Fluids Volume K Forecast, by Region 2020 & 2033
- Table 7: Global High Performance Fluorinated Fluids Revenue undefined Forecast, by Application 2020 & 2033
- Table 8: Global High Performance Fluorinated Fluids Volume K Forecast, by Application 2020 & 2033
- Table 9: Global High Performance Fluorinated Fluids Revenue undefined Forecast, by Type 2020 & 2033
- Table 10: Global High Performance Fluorinated Fluids Volume K Forecast, by Type 2020 & 2033
- Table 11: Global High Performance Fluorinated Fluids Revenue undefined Forecast, by Country 2020 & 2033
- Table 12: Global High Performance Fluorinated Fluids Volume K Forecast, by Country 2020 & 2033
- Table 13: United States High Performance Fluorinated Fluids Revenue (undefined) Forecast, by Application 2020 & 2033
- Table 14: United States High Performance Fluorinated Fluids Volume (K) Forecast, by Application 2020 & 2033
- Table 15: Canada High Performance Fluorinated Fluids Revenue (undefined) Forecast, by Application 2020 & 2033
- Table 16: Canada High Performance Fluorinated Fluids Volume (K) Forecast, by Application 2020 & 2033
- Table 17: Mexico High Performance Fluorinated Fluids Revenue (undefined) Forecast, by Application 2020 & 2033
- Table 18: Mexico High Performance Fluorinated Fluids Volume (K) Forecast, by Application 2020 & 2033
- Table 19: Global High Performance Fluorinated Fluids Revenue undefined Forecast, by Application 2020 & 2033
- Table 20: Global High Performance Fluorinated Fluids Volume K Forecast, by Application 2020 & 2033
- Table 21: Global High Performance Fluorinated Fluids Revenue undefined Forecast, by Type 2020 & 2033
- Table 22: Global High Performance Fluorinated Fluids Volume K Forecast, by Type 2020 & 2033
- Table 23: Global High Performance Fluorinated Fluids Revenue undefined Forecast, by Country 2020 & 2033
- Table 24: Global High Performance Fluorinated Fluids Volume K Forecast, by Country 2020 & 2033
- Table 25: Brazil High Performance Fluorinated Fluids Revenue (undefined) Forecast, by Application 2020 & 2033
- Table 26: Brazil High Performance Fluorinated Fluids Volume (K) Forecast, by Application 2020 & 2033
- Table 27: Argentina High Performance Fluorinated Fluids Revenue (undefined) Forecast, by Application 2020 & 2033
- Table 28: Argentina High Performance Fluorinated Fluids Volume (K) Forecast, by Application 2020 & 2033
- Table 29: Rest of South America High Performance Fluorinated Fluids Revenue (undefined) Forecast, by Application 2020 & 2033
- Table 30: Rest of South America High Performance Fluorinated Fluids Volume (K) Forecast, by Application 2020 & 2033
- Table 31: Global High Performance Fluorinated Fluids Revenue undefined Forecast, by Application 2020 & 2033
- Table 32: Global High Performance Fluorinated Fluids Volume K Forecast, by Application 2020 & 2033
- Table 33: Global High Performance Fluorinated Fluids Revenue undefined Forecast, by Type 2020 & 2033
- Table 34: Global High Performance Fluorinated Fluids Volume K Forecast, by Type 2020 & 2033
- Table 35: Global High Performance Fluorinated Fluids Revenue undefined Forecast, by Country 2020 & 2033
- Table 36: Global High Performance Fluorinated Fluids Volume K Forecast, by Country 2020 & 2033
- Table 37: United Kingdom High Performance Fluorinated Fluids Revenue (undefined) Forecast, by Application 2020 & 2033
- Table 38: United Kingdom High Performance Fluorinated Fluids Volume (K) Forecast, by Application 2020 & 2033
- Table 39: Germany High Performance Fluorinated Fluids Revenue (undefined) Forecast, by Application 2020 & 2033
- Table 40: Germany High Performance Fluorinated Fluids Volume (K) Forecast, by Application 2020 & 2033
- Table 41: France High Performance Fluorinated Fluids Revenue (undefined) Forecast, by Application 2020 & 2033
- Table 42: France High Performance Fluorinated Fluids Volume (K) Forecast, by Application 2020 & 2033
- Table 43: Italy High Performance Fluorinated Fluids Revenue (undefined) Forecast, by Application 2020 & 2033
- Table 44: Italy High Performance Fluorinated Fluids Volume (K) Forecast, by Application 2020 & 2033
- Table 45: Spain High Performance Fluorinated Fluids Revenue (undefined) Forecast, by Application 2020 & 2033
- Table 46: Spain High Performance Fluorinated Fluids Volume (K) Forecast, by Application 2020 & 2033
- Table 47: Russia High Performance Fluorinated Fluids Revenue (undefined) Forecast, by Application 2020 & 2033
- Table 48: Russia High Performance Fluorinated Fluids Volume (K) Forecast, by Application 2020 & 2033
- Table 49: Benelux High Performance Fluorinated Fluids Revenue (undefined) Forecast, by Application 2020 & 2033
- Table 50: Benelux High Performance Fluorinated Fluids Volume (K) Forecast, by Application 2020 & 2033
- Table 51: Nordics High Performance Fluorinated Fluids Revenue (undefined) Forecast, by Application 2020 & 2033
- Table 52: Nordics High Performance Fluorinated Fluids Volume (K) Forecast, by Application 2020 & 2033
- Table 53: Rest of Europe High Performance Fluorinated Fluids Revenue (undefined) Forecast, by Application 2020 & 2033
- Table 54: Rest of Europe High Performance Fluorinated Fluids Volume (K) Forecast, by Application 2020 & 2033
- Table 55: Global High Performance Fluorinated Fluids Revenue undefined Forecast, by Application 2020 & 2033
- Table 56: Global High Performance Fluorinated Fluids Volume K Forecast, by Application 2020 & 2033
- Table 57: Global High Performance Fluorinated Fluids Revenue undefined Forecast, by Type 2020 & 2033
- Table 58: Global High Performance Fluorinated Fluids Volume K Forecast, by Type 2020 & 2033
- Table 59: Global High Performance Fluorinated Fluids Revenue undefined Forecast, by Country 2020 & 2033
- Table 60: Global High Performance Fluorinated Fluids Volume K Forecast, by Country 2020 & 2033
- Table 61: Turkey High Performance Fluorinated Fluids Revenue (undefined) Forecast, by Application 2020 & 2033
- Table 62: Turkey High Performance Fluorinated Fluids Volume (K) Forecast, by Application 2020 & 2033
- Table 63: Israel High Performance Fluorinated Fluids Revenue (undefined) Forecast, by Application 2020 & 2033
- Table 64: Israel High Performance Fluorinated Fluids Volume (K) Forecast, by Application 2020 & 2033
- Table 65: GCC High Performance Fluorinated Fluids Revenue (undefined) Forecast, by Application 2020 & 2033
- Table 66: GCC High Performance Fluorinated Fluids Volume (K) Forecast, by Application 2020 & 2033
- Table 67: North Africa High Performance Fluorinated Fluids Revenue (undefined) Forecast, by Application 2020 & 2033
- Table 68: North Africa High Performance Fluorinated Fluids Volume (K) Forecast, by Application 2020 & 2033
- Table 69: South Africa High Performance Fluorinated Fluids Revenue (undefined) Forecast, by Application 2020 & 2033
- Table 70: South Africa High Performance Fluorinated Fluids Volume (K) Forecast, by Application 2020 & 2033
- Table 71: Rest of Middle East & Africa High Performance Fluorinated Fluids Revenue (undefined) Forecast, by Application 2020 & 2033
- Table 72: Rest of Middle East & Africa High Performance Fluorinated Fluids Volume (K) Forecast, by Application 2020 & 2033
- Table 73: Global High Performance Fluorinated Fluids Revenue undefined Forecast, by Application 2020 & 2033
- Table 74: Global High Performance Fluorinated Fluids Volume K Forecast, by Application 2020 & 2033
- Table 75: Global High Performance Fluorinated Fluids Revenue undefined Forecast, by Type 2020 & 2033
- Table 76: Global High Performance Fluorinated Fluids Volume K Forecast, by Type 2020 & 2033
- Table 77: Global High Performance Fluorinated Fluids Revenue undefined Forecast, by Country 2020 & 2033
- Table 78: Global High Performance Fluorinated Fluids Volume K Forecast, by Country 2020 & 2033
- Table 79: China High Performance Fluorinated Fluids Revenue (undefined) Forecast, by Application 2020 & 2033
- Table 80: China High Performance Fluorinated Fluids Volume (K) Forecast, by Application 2020 & 2033
- Table 81: India High Performance Fluorinated Fluids Revenue (undefined) Forecast, by Application 2020 & 2033
- Table 82: India High Performance Fluorinated Fluids Volume (K) Forecast, by Application 2020 & 2033
- Table 83: Japan High Performance Fluorinated Fluids Revenue (undefined) Forecast, by Application 2020 & 2033
- Table 84: Japan High Performance Fluorinated Fluids Volume (K) Forecast, by Application 2020 & 2033
- Table 85: South Korea High Performance Fluorinated Fluids Revenue (undefined) Forecast, by Application 2020 & 2033
- Table 86: South Korea High Performance Fluorinated Fluids Volume (K) Forecast, by Application 2020 & 2033
- Table 87: ASEAN High Performance Fluorinated Fluids Revenue (undefined) Forecast, by Application 2020 & 2033
- Table 88: ASEAN High Performance Fluorinated Fluids Volume (K) Forecast, by Application 2020 & 2033
- Table 89: Oceania High Performance Fluorinated Fluids Revenue (undefined) Forecast, by Application 2020 & 2033
- Table 90: Oceania High Performance Fluorinated Fluids Volume (K) Forecast, by Application 2020 & 2033
- Table 91: Rest of Asia Pacific High Performance Fluorinated Fluids Revenue (undefined) Forecast, by Application 2020 & 2033
- Table 92: Rest of Asia Pacific High Performance Fluorinated Fluids Volume (K) Forecast, by Application 2020 & 2033
Frequently Asked Questions
1. What is the projected Compound Annual Growth Rate (CAGR) of the High Performance Fluorinated Fluids?
The projected CAGR is approximately 13.98%.
2. Which companies are prominent players in the High Performance Fluorinated Fluids?
Key companies in the market include 3M, Chemours, Syensqo, Shell, Dow, ExxonMobil, Hexafluo, Zhejiang Noah Fluorochemical, Juhua, TMC Industries, Shenzhen Capchem Technology.
3. What are the main segments of the High Performance Fluorinated Fluids?
The market segments include Application, Type.
4. Can you provide details about the market size?
The market size is estimated to be USD XXX N/A as of 2022.
5. What are some drivers contributing to market growth?
N/A
6. What are the notable trends driving market growth?
N/A
7. Are there any restraints impacting market growth?
N/A
8. Can you provide examples of recent developments in the market?
N/A
9. What pricing options are available for accessing the report?
Pricing options include single-user, multi-user, and enterprise licenses priced at USD 3950.00, USD 5925.00, and USD 7900.00 respectively.
10. Is the market size provided in terms of value or volume?
The market size is provided in terms of value, measured in N/A and volume, measured in K.
11. Are there any specific market keywords associated with the report?
Yes, the market keyword associated with the report is "High Performance Fluorinated Fluids," which aids in identifying and referencing the specific market segment covered.
12. How do I determine which pricing option suits my needs best?
The pricing options vary based on user requirements and access needs. Individual users may opt for single-user licenses, while businesses requiring broader access may choose multi-user or enterprise licenses for cost-effective access to the report.
13. Are there any additional resources or data provided in the High Performance Fluorinated Fluids report?
While the report offers comprehensive insights, it's advisable to review the specific contents or supplementary materials provided to ascertain if additional resources or data are available.
14. How can I stay updated on further developments or reports in the High Performance Fluorinated Fluids?
To stay informed about further developments, trends, and reports in the High Performance Fluorinated Fluids, consider subscribing to industry newsletters, following relevant companies and organizations, or regularly checking reputable industry news sources and publications.
Methodology
Step 1 - Identification of Relevant Samples Size from Population Database


Step 2 - Approaches for Defining Global Market Size (Value, Volume* & Price*)

Note*: In applicable scenarios
Step 3 - Data Sources
Primary Research
- Web Analytics
- Survey Reports
- Research Institute
- Latest Research Reports
- Opinion Leaders
Secondary Research
- Annual Reports
- White Paper
- Latest Press Release
- Industry Association
- Paid Database
- Investor Presentations

Step 4 - Data Triangulation
Involves using different sources of information in order to increase the validity of a study
These sources are likely to be stakeholders in a program - participants, other researchers, program staff, other community members, and so on.
Then we put all data in single framework & apply various statistical tools to find out the dynamic on the market.
During the analysis stage, feedback from the stakeholder groups would be compared to determine areas of agreement as well as areas of divergence