Insights into High Power Laser Systems Industry Industry Dynamics

High Power Laser Systems Industry by Cutting, by Welding, by Others (, by China, by Japan, by Europe, by North America, by Rest of the World, by North America (United States, Canada, Mexico), by South America (Brazil, Argentina, Rest of South America), by Europe (United Kingdom, Germany, France, Italy, Spain, Russia, Benelux, Nordics, Rest of Europe), by Middle East & Africa (Turkey, Israel, GCC, North Africa, South Africa, Rest of Middle East & Africa), by Asia Pacific (China, India, Japan, South Korea, ASEAN, Oceania, Rest of Asia Pacific) Forecast 2025-2033

Jun 27 2025
Base Year: 2024

234 Pages
Main Logo

Insights into High Power Laser Systems Industry Industry Dynamics


Home
Industries
Technology, Media and Telecom
sponsor image
sponsor image
sponsor image
sponsor image
sponsor image
sponsor image
sponsor image
sponsor image
sponsor image
sponsor image
sponsor image
sponsor image
sponsor image
sponsor image
sponsor image
sponsor image
sponsor image
sponsor image
sponsor image
sponsor image

Tailored for you

  • In-depth Analysis Tailored to Specified Regions or Segments
  • Company Profiles Customized to User Preferences
  • Comprehensive Insights Focused on Specific Segments or Regions
  • Customized Evaluation of Competitive Landscape to Meet Your Needs
  • Tailored Customization to Address Other Specific Requirements
Ask for customization


Key Insights

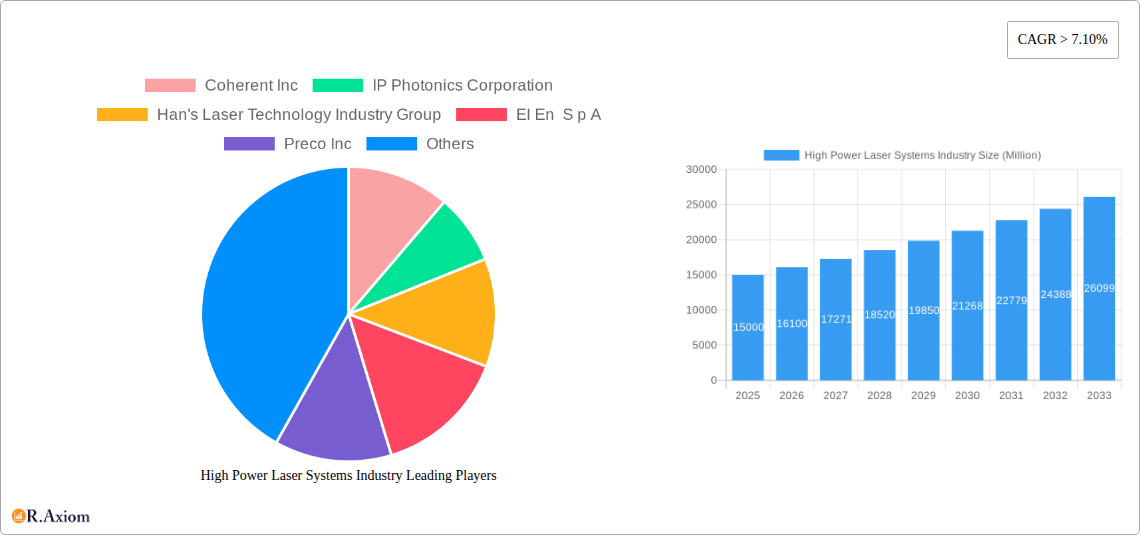
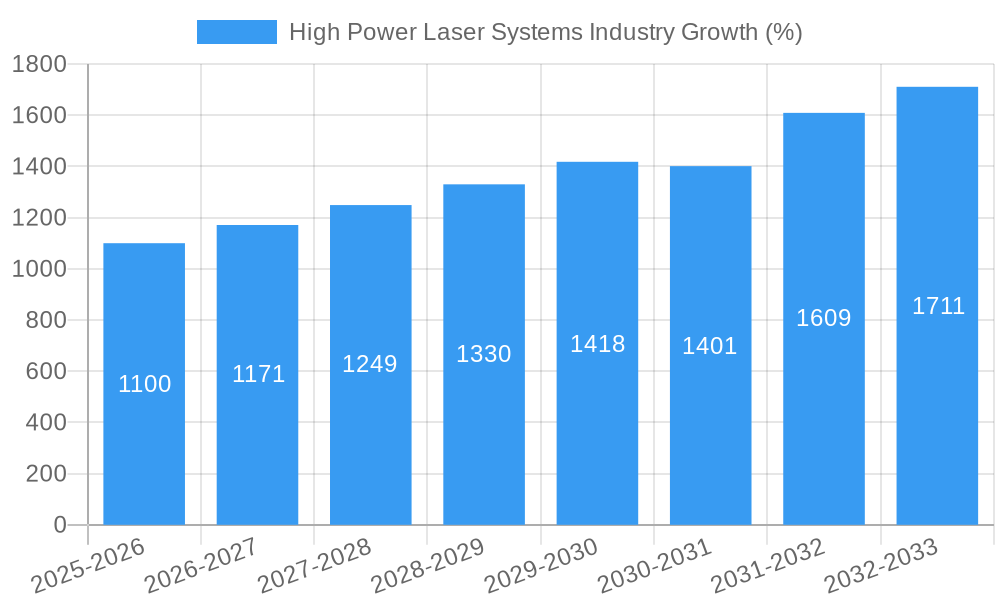
The high-power laser systems market is experiencing robust growth, projected to maintain a Compound Annual Growth Rate (CAGR) exceeding 7.10% from 2025 to 2033. This expansion is fueled by several key factors. Firstly, increasing automation across manufacturing sectors, particularly in automotive and electronics, drives demand for precise and efficient laser cutting, welding, and drilling solutions. The healthcare industry's adoption of laser-assisted surgeries and treatments further contributes to market growth, as laser technology offers minimally invasive procedures and improved patient outcomes. Additionally, advancements in laser technology, leading to higher power outputs, improved beam quality, and reduced operational costs, are making high-power lasers increasingly attractive to various applications. The defense and research sectors also represent significant growth areas, with laser systems finding applications in ranging, targeting, and material processing research. The market is segmented by power output (low-power systems up to 10,000W and higher power systems), laser type (fiber, CO2, excimer, and diode lasers), industry (manufacturing, healthcare, defense, and research), and application (cutting, welding, drilling, medical procedures, and defense systems). Competition is relatively concentrated with key players including Coherent Inc, IP Photonics Corporation, Han's Laser Technology Industry Group, and others actively innovating and expanding their product portfolios to meet the evolving market needs.

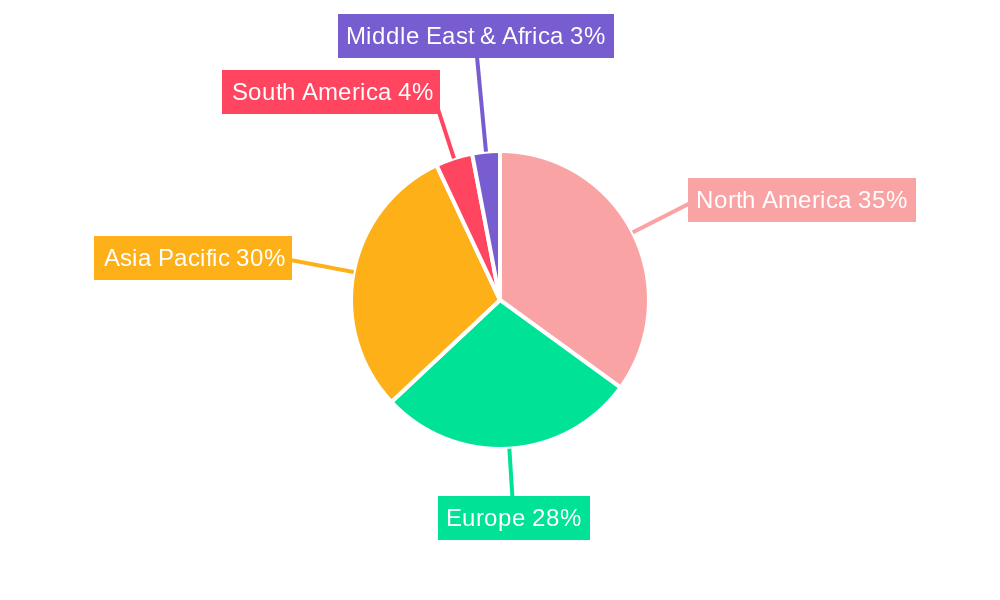
Geographic distribution reveals a strong presence in North America and Asia Pacific, driven by robust industrial activity and technological advancements in these regions. Europe also holds a substantial market share, while South America and the Middle East & Africa are projected to witness accelerated growth in the coming years. However, challenges such as high initial investment costs for high-power laser systems and potential safety concerns might slightly impede market growth. The market is, however, expected to overcome these hurdles driven by the continuous improvements in efficiency, safety measures, and the emergence of cost-effective solutions. The long-term outlook remains positive, indicating sustained growth driven by technological advancements and increasing adoption across diverse industries. We estimate the 2025 market size to be around $15 billion based on the provided CAGR and considering the relatively mature stage of some segments.

High Power Laser Systems Industry Market Report: 2019-2033

This comprehensive report provides an in-depth analysis of the High Power Laser Systems industry, covering market size, growth projections, key players, technological advancements, and emerging trends from 2019 to 2033. The study period is 2019-2033, with 2025 as the base and estimated year. The forecast period is 2025-2033, and the historical period is 2019-2024. This report is crucial for industry stakeholders, investors, and researchers seeking actionable insights into this dynamic market.

High Power Laser Systems Industry Research Report - Market Size, Growth & Forecast

High Power Laser Systems Industry Market Concentration & Innovation

The High Power Laser Systems market is characterized by a moderately concentrated landscape with several key players vying for market share. While exact market share figures are proprietary data, major players like Coherent Inc, TRUMPF SE + Co KG, and Han's Laser Technology Industry Group hold significant positions, estimated at a combined xx Million USD in revenue in 2025. This concentration stems from high barriers to entry, including substantial R&D investments and specialized manufacturing capabilities. Innovation is a primary driver, with ongoing development in laser types (fiber, CO2, excimer, diode), power output (currently up to 20kW commercially available), and applications across diverse sectors.

  • Market Concentration: High, with a few dominant players.
  • Innovation Drivers: Advancements in laser technology, expanding applications in diverse industries, and government funding for R&D.
  • Regulatory Frameworks: Vary by region, impacting safety standards and market access. (Specific regulations are detailed within the full report).
  • Product Substitutes: Limited substitutes exist for high-power laser systems in many applications, though alternative technologies are constantly evolving.
  • End-User Trends: Increasing demand driven by automation in manufacturing, precision requirements in healthcare, and advanced defense systems.
  • M&A Activities: The industry has witnessed several mergers and acquisitions (M&A) in recent years, with deal values ranging from xx Million to xx Million USD. (Specific M&A details are included in the full report).

High Power Laser Systems Industry Industry Trends & Insights

The High Power Laser Systems market is projected to experience significant growth over the forecast period, driven by several key trends. The Compound Annual Growth Rate (CAGR) is estimated to be xx% between 2025 and 2033, reaching a market size of xx Million USD by 2033. Technological advancements, particularly in fiber lasers, are significantly enhancing efficiency, precision, and cost-effectiveness. The increasing adoption of automation across various industries, coupled with rising demand for high-precision applications in healthcare and defense, is fueling market expansion. Market penetration is highest in the manufacturing sector, followed by healthcare and defense. Competitive dynamics are primarily shaped by technological leadership, innovation speed, and global reach.

High Power Laser Systems Industry Growth

Dominant Markets & Segments in High Power Laser Systems Industry

The manufacturing sector is currently the dominant market segment for high-power laser systems, accounting for approximately xx% of the market value in 2025, followed by defense and research. Among geographic regions, North America and Europe are leading markets, with Asia-Pacific showing significant growth potential.

  • Leading Region: North America (currently)
  • Key Drivers (North America): Strong industrial base, high technological adoption, significant defense spending.
  • Key Drivers (Europe): Advanced manufacturing industries, focus on automation and precision engineering, government support for R&D.
  • Key Drivers (Asia-Pacific): Rapid industrialization, rising disposable income, increasing government investments in infrastructure and technology.
  • Dominant Segment (by Power Output): Fiber lasers currently dominate the market for high-power applications due to their efficiency and versatility.
  • Dominant Segment (by Laser Type): Fiber lasers are experiencing the highest demand and growth.
  • Dominant Segment (by Application): Cutting and welding are the major applications driving market growth, followed by drilling and medical procedures.

High Power Laser Systems Industry Product Developments

Recent product developments focus on increased power output, enhanced precision, and improved efficiency. Fiber lasers are at the forefront of innovation, offering superior performance compared to traditional CO2 lasers in many applications. Manufacturers are also developing integrated systems, combining lasers with automation and process control for improved productivity and reduced operational costs. These advancements are enabling new applications and expanding the market reach of high-power laser systems.

Report Scope & Segmentation Analysis

This report segments the high-power laser systems market based on power output (low-power: up to 10,000 W; high-power: above 10,000 W), laser type (fiber, CO2, excimer, diode), industry (manufacturing, healthcare, defense, research), and application (cutting, welding, drilling, medical procedures, defense systems). Each segment's growth projections, market size, and competitive dynamics are analyzed in detail within the full report. For example, the fiber laser segment is expected to maintain significant growth due to its superior performance and cost-effectiveness.

Key Drivers of High Power Laser Systems Industry Growth

Several factors drive growth in this industry, including technological advancements leading to higher power, efficiency, and precision; increasing automation across various industries; rising demand for high-precision applications in healthcare and defense; and favorable government policies and regulations supporting technological innovation.

Challenges in the High Power Laser Systems Industry Sector

The industry faces challenges including high initial investment costs, the need for skilled labor, stringent safety regulations, potential supply chain disruptions, and intense competition from established and emerging players. These factors can impact market growth and profitability.

Emerging Opportunities in High Power Laser Systems Industry

Emerging opportunities lie in new applications, such as additive manufacturing (3D printing), micromachining, and advanced materials processing. The development of more compact, energy-efficient lasers, and the integration of AI and machine learning for process optimization, present further avenues for growth.

Leading Players in the High Power Laser Systems Industry Market

  • Coherent Inc
  • IP Photonics Corporation
  • Han's Laser Technology Industry Group
  • El En S p A
  • Preco Inc
  • TRUMPF SE + Co KG
  • Prima Industrie S p A
  • Bystronic Laser AG
  • HSG Laser

Key Developments in High Power Laser Systems Industry Industry

  • June 2021: Han's Laser Smart Equipment Group launched a new plant in Tianjin, China, planned to produce over 1000 laser equipment sets annually.
  • April 2022: Bystronic Group launched flagship laser cutting systems with 20 kW laser power, enhancing productivity and efficiency in sheet metal processing.

Strategic Outlook for High Power Laser Systems Industry Market

The future of the High Power Laser Systems market is bright, driven by sustained technological innovation, rising industrial automation, and the expanding applications across various sectors. Companies with strong R&D capabilities, a focus on process optimization, and a diversified product portfolio are well-positioned to capitalize on the growth opportunities in this market.

High Power Laser Systems Industry Segmentation

  • 1. Cutting
  • 2. Welding
  • 3. Others (
  • 4. China
  • 5. Japan
  • 6. Europe
  • 7. North America
  • 8. Rest of the World

High Power Laser Systems Industry Segmentation By Geography

  • 1. North America
    • 1.1. United States
    • 1.2. Canada
    • 1.3. Mexico
  • 2. South America
    • 2.1. Brazil
    • 2.2. Argentina
    • 2.3. Rest of South America
  • 3. Europe
    • 3.1. United Kingdom
    • 3.2. Germany
    • 3.3. France
    • 3.4. Italy
    • 3.5. Spain
    • 3.6. Russia
    • 3.7. Benelux
    • 3.8. Nordics
    • 3.9. Rest of Europe
  • 4. Middle East & Africa
    • 4.1. Turkey
    • 4.2. Israel
    • 4.3. GCC
    • 4.4. North Africa
    • 4.5. South Africa
    • 4.6. Rest of Middle East & Africa
  • 5. Asia Pacific
    • 5.1. China
    • 5.2. India
    • 5.3. Japan
    • 5.4. South Korea
    • 5.5. ASEAN
    • 5.6. Oceania
    • 5.7. Rest of Asia Pacific
High Power Laser Systems Industry Regional Share


High Power Laser Systems Industry REPORT HIGHLIGHTS

AspectsDetails
Study Period 2019-2033
Base Year 2024
Estimated Year 2025
Forecast Period2025-2033
Historical Period2019-2024
Growth RateCAGR of > 7.10% from 2019-2033
Segmentation
    • By Cutting
    • By Welding
    • By Others (
    • By China
    • By Japan
    • By Europe
    • By North America
    • By Rest of the World
  • By Geography
    • North America
      • United States
      • Canada
      • Mexico
    • South America
      • Brazil
      • Argentina
      • Rest of South America
    • Europe
      • United Kingdom
      • Germany
      • France
      • Italy
      • Spain
      • Russia
      • Benelux
      • Nordics
      • Rest of Europe
    • Middle East & Africa
      • Turkey
      • Israel
      • GCC
      • North Africa
      • South Africa
      • Rest of Middle East & Africa
    • Asia Pacific
      • China
      • India
      • Japan
      • South Korea
      • ASEAN
      • Oceania
      • Rest of Asia Pacific


Table of Contents

  1. 1. Introduction
    • 1.1. Research Scope
    • 1.2. Market Segmentation
    • 1.3. Research Methodology
    • 1.4. Definitions and Assumptions
  2. 2. Executive Summary
    • 2.1. Introduction
  3. 3. Market Dynamics
    • 3.1. Introduction
      • 3.2. Market Drivers
        • 3.2.1. Growing demand for Fixed Broadband Services; Rising demand for 5G; Growth of IoT usage in Telecom
      • 3.3. Market Restrains
        • 3.3.1. Relatively Low Levels of Awareness and Regulatory Challenges
      • 3.4. Market Trends
        • 3.4.1. Welding Segment is Expected to Hold a Major Market Share
  4. 4. Market Factor Analysis
    • 4.1. Porters Five Forces
    • 4.2. Supply/Value Chain
    • 4.3. PESTEL analysis
    • 4.4. Market Entropy
    • 4.5. Patent/Trademark Analysis
  5. 5. Global High Power Laser Systems Industry Analysis, Insights and Forecast, 2019-2031
    • 5.1. Market Analysis, Insights and Forecast - by Cutting
      • 5.2. Market Analysis, Insights and Forecast - by Welding
        • 5.3. Market Analysis, Insights and Forecast - by Others (
          • 5.4. Market Analysis, Insights and Forecast - by China
            • 5.5. Market Analysis, Insights and Forecast - by Japan
              • 5.6. Market Analysis, Insights and Forecast - by Europe
                • 5.7. Market Analysis, Insights and Forecast - by North America
                  • 5.8. Market Analysis, Insights and Forecast - by Rest of the World
                    • 5.9. Market Analysis, Insights and Forecast - by Region
                      • 5.9.1. North America
                      • 5.9.2. South America
                      • 5.9.3. Europe
                      • 5.9.4. Middle East & Africa
                      • 5.9.5. Asia Pacific
                  • 6. North America High Power Laser Systems Industry Analysis, Insights and Forecast, 2019-2031
                    • 6.1. Market Analysis, Insights and Forecast - by Cutting
                      • 6.2. Market Analysis, Insights and Forecast - by Welding
                        • 6.3. Market Analysis, Insights and Forecast - by Others (
                          • 6.4. Market Analysis, Insights and Forecast - by China
                            • 6.5. Market Analysis, Insights and Forecast - by Japan
                              • 6.6. Market Analysis, Insights and Forecast - by Europe
                                • 6.7. Market Analysis, Insights and Forecast - by North America
                                  • 6.8. Market Analysis, Insights and Forecast - by Rest of the World
                                  • 7. South America High Power Laser Systems Industry Analysis, Insights and Forecast, 2019-2031
                                    • 7.1. Market Analysis, Insights and Forecast - by Cutting
                                      • 7.2. Market Analysis, Insights and Forecast - by Welding
                                        • 7.3. Market Analysis, Insights and Forecast - by Others (
                                          • 7.4. Market Analysis, Insights and Forecast - by China
                                            • 7.5. Market Analysis, Insights and Forecast - by Japan
                                              • 7.6. Market Analysis, Insights and Forecast - by Europe
                                                • 7.7. Market Analysis, Insights and Forecast - by North America
                                                  • 7.8. Market Analysis, Insights and Forecast - by Rest of the World
                                                  • 8. Europe High Power Laser Systems Industry Analysis, Insights and Forecast, 2019-2031
                                                    • 8.1. Market Analysis, Insights and Forecast - by Cutting
                                                      • 8.2. Market Analysis, Insights and Forecast - by Welding
                                                        • 8.3. Market Analysis, Insights and Forecast - by Others (
                                                          • 8.4. Market Analysis, Insights and Forecast - by China
                                                            • 8.5. Market Analysis, Insights and Forecast - by Japan
                                                              • 8.6. Market Analysis, Insights and Forecast - by Europe
                                                                • 8.7. Market Analysis, Insights and Forecast - by North America
                                                                  • 8.8. Market Analysis, Insights and Forecast - by Rest of the World
                                                                  • 9. Middle East & Africa High Power Laser Systems Industry Analysis, Insights and Forecast, 2019-2031
                                                                    • 9.1. Market Analysis, Insights and Forecast - by Cutting
                                                                      • 9.2. Market Analysis, Insights and Forecast - by Welding
                                                                        • 9.3. Market Analysis, Insights and Forecast - by Others (
                                                                          • 9.4. Market Analysis, Insights and Forecast - by China
                                                                            • 9.5. Market Analysis, Insights and Forecast - by Japan
                                                                              • 9.6. Market Analysis, Insights and Forecast - by Europe
                                                                                • 9.7. Market Analysis, Insights and Forecast - by North America
                                                                                  • 9.8. Market Analysis, Insights and Forecast - by Rest of the World
                                                                                  • 10. Asia Pacific High Power Laser Systems Industry Analysis, Insights and Forecast, 2019-2031
                                                                                    • 10.1. Market Analysis, Insights and Forecast - by Cutting
                                                                                      • 10.2. Market Analysis, Insights and Forecast - by Welding
                                                                                        • 10.3. Market Analysis, Insights and Forecast - by Others (
                                                                                          • 10.4. Market Analysis, Insights and Forecast - by China
                                                                                            • 10.5. Market Analysis, Insights and Forecast - by Japan
                                                                                              • 10.6. Market Analysis, Insights and Forecast - by Europe
                                                                                                • 10.7. Market Analysis, Insights and Forecast - by North America
                                                                                                  • 10.8. Market Analysis, Insights and Forecast - by Rest of the World
                                                                                                  • 11. North America High Power Laser Systems Industry Analysis, Insights and Forecast, 2019-2031
                                                                                                      • 11.1. Market Analysis, Insights and Forecast - By Country/Sub-region
                                                                                                        • 11.1.1 United States
                                                                                                        • 11.1.2 Canada
                                                                                                        • 11.1.3 Mexico
                                                                                                  • 12. Asia Pacific High Power Laser Systems Industry Analysis, Insights and Forecast, 2019-2031
                                                                                                      • 12.1. Market Analysis, Insights and Forecast - By Country/Sub-region
                                                                                                        • 12.1.1 China
                                                                                                        • 12.1.2 Japan
                                                                                                        • 12.1.3 India
                                                                                                        • 12.1.4 South Korea
                                                                                                        • 12.1.5 Taiwan
                                                                                                        • 12.1.6 Australia
                                                                                                        • 12.1.7 Rest of Asia-Pacific
                                                                                                  • 13. Europe High Power Laser Systems Industry Analysis, Insights and Forecast, 2019-2031
                                                                                                      • 13.1. Market Analysis, Insights and Forecast - By Country/Sub-region
                                                                                                        • 13.1.1 Germany
                                                                                                        • 13.1.2 France
                                                                                                        • 13.1.3 Italy
                                                                                                        • 13.1.4 United Kingdom
                                                                                                        • 13.1.5 Netherlands
                                                                                                        • 13.1.6 Rest of Europe
                                                                                                  • 14. South America High Power Laser Systems Industry Analysis, Insights and Forecast, 2019-2031
                                                                                                      • 14.1. Market Analysis, Insights and Forecast - By Country/Sub-region
                                                                                                        • 14.1.1 Brazil
                                                                                                        • 14.1.2 Argentina
                                                                                                        • 14.1.3 Rest of South America
                                                                                                  • 15. Middle East & Africa High Power Laser Systems Industry Analysis, Insights and Forecast, 2019-2031
                                                                                                      • 15.1. Market Analysis, Insights and Forecast - By Country/Sub-region
                                                                                                        • 15.1.1 UAE
                                                                                                        • 15.1.2 South Africa
                                                                                                        • 15.1.3 Saudi Arabia
                                                                                                        • 15.1.4 Rest of MEA
                                                                                                  • 16. Competitive Analysis
                                                                                                    • 16.1. Global Market Share Analysis 2024
                                                                                                      • 16.2. Company Profiles
                                                                                                        • 16.2.1 Coherent Inc
                                                                                                          • 16.2.1.1. Overview
                                                                                                          • 16.2.1.2. Products
                                                                                                          • 16.2.1.3. SWOT Analysis
                                                                                                          • 16.2.1.4. Recent Developments
                                                                                                          • 16.2.1.5. Financials (Based on Availability)
                                                                                                        • 16.2.2 IP Photonics Corporation
                                                                                                          • 16.2.2.1. Overview
                                                                                                          • 16.2.2.2. Products
                                                                                                          • 16.2.2.3. SWOT Analysis
                                                                                                          • 16.2.2.4. Recent Developments
                                                                                                          • 16.2.2.5. Financials (Based on Availability)
                                                                                                        • 16.2.3 Han's Laser Technology Industry Group
                                                                                                          • 16.2.3.1. Overview
                                                                                                          • 16.2.3.2. Products
                                                                                                          • 16.2.3.3. SWOT Analysis
                                                                                                          • 16.2.3.4. Recent Developments
                                                                                                          • 16.2.3.5. Financials (Based on Availability)
                                                                                                        • 16.2.4 El En S p A
                                                                                                          • 16.2.4.1. Overview
                                                                                                          • 16.2.4.2. Products
                                                                                                          • 16.2.4.3. SWOT Analysis
                                                                                                          • 16.2.4.4. Recent Developments
                                                                                                          • 16.2.4.5. Financials (Based on Availability)
                                                                                                        • 16.2.5 Preco Inc
                                                                                                          • 16.2.5.1. Overview
                                                                                                          • 16.2.5.2. Products
                                                                                                          • 16.2.5.3. SWOT Analysis
                                                                                                          • 16.2.5.4. Recent Developments
                                                                                                          • 16.2.5.5. Financials (Based on Availability)
                                                                                                        • 16.2.6 TRUMPF SE + Co KG
                                                                                                          • 16.2.6.1. Overview
                                                                                                          • 16.2.6.2. Products
                                                                                                          • 16.2.6.3. SWOT Analysis
                                                                                                          • 16.2.6.4. Recent Developments
                                                                                                          • 16.2.6.5. Financials (Based on Availability)
                                                                                                        • 16.2.7 Prima Industrie S p A
                                                                                                          • 16.2.7.1. Overview
                                                                                                          • 16.2.7.2. Products
                                                                                                          • 16.2.7.3. SWOT Analysis
                                                                                                          • 16.2.7.4. Recent Developments
                                                                                                          • 16.2.7.5. Financials (Based on Availability)
                                                                                                        • 16.2.8 Bystronic Laser AG
                                                                                                          • 16.2.8.1. Overview
                                                                                                          • 16.2.8.2. Products
                                                                                                          • 16.2.8.3. SWOT Analysis
                                                                                                          • 16.2.8.4. Recent Developments
                                                                                                          • 16.2.8.5. Financials (Based on Availability)
                                                                                                        • 16.2.9 HSG Laser*List Not Exhaustive
                                                                                                          • 16.2.9.1. Overview
                                                                                                          • 16.2.9.2. Products
                                                                                                          • 16.2.9.3. SWOT Analysis
                                                                                                          • 16.2.9.4. Recent Developments
                                                                                                          • 16.2.9.5. Financials (Based on Availability)

                                                                                                  List of Figures

                                                                                                  1. Figure 1: Global High Power Laser Systems Industry Revenue Breakdown (Million, %) by Region 2024 & 2032
                                                                                                  2. Figure 2: North America High Power Laser Systems Industry Revenue (Million), by Country 2024 & 2032
                                                                                                  3. Figure 3: North America High Power Laser Systems Industry Revenue Share (%), by Country 2024 & 2032
                                                                                                  4. Figure 4: Asia Pacific High Power Laser Systems Industry Revenue (Million), by Country 2024 & 2032
                                                                                                  5. Figure 5: Asia Pacific High Power Laser Systems Industry Revenue Share (%), by Country 2024 & 2032
                                                                                                  6. Figure 6: Europe High Power Laser Systems Industry Revenue (Million), by Country 2024 & 2032
                                                                                                  7. Figure 7: Europe High Power Laser Systems Industry Revenue Share (%), by Country 2024 & 2032
                                                                                                  8. Figure 8: South America High Power Laser Systems Industry Revenue (Million), by Country 2024 & 2032
                                                                                                  9. Figure 9: South America High Power Laser Systems Industry Revenue Share (%), by Country 2024 & 2032
                                                                                                  10. Figure 10: Middle East & Africa High Power Laser Systems Industry Revenue (Million), by Country 2024 & 2032
                                                                                                  11. Figure 11: Middle East & Africa High Power Laser Systems Industry Revenue Share (%), by Country 2024 & 2032
                                                                                                  12. Figure 12: North America High Power Laser Systems Industry Revenue (Million), by Cutting 2024 & 2032
                                                                                                  13. Figure 13: North America High Power Laser Systems Industry Revenue Share (%), by Cutting 2024 & 2032
                                                                                                  14. Figure 14: North America High Power Laser Systems Industry Revenue (Million), by Welding 2024 & 2032
                                                                                                  15. Figure 15: North America High Power Laser Systems Industry Revenue Share (%), by Welding 2024 & 2032
                                                                                                  16. Figure 16: North America High Power Laser Systems Industry Revenue (Million), by Others ( 2024 & 2032
                                                                                                  17. Figure 17: North America High Power Laser Systems Industry Revenue Share (%), by Others ( 2024 & 2032
                                                                                                  18. Figure 18: North America High Power Laser Systems Industry Revenue (Million), by China 2024 & 2032
                                                                                                  19. Figure 19: North America High Power Laser Systems Industry Revenue Share (%), by China 2024 & 2032
                                                                                                  20. Figure 20: North America High Power Laser Systems Industry Revenue (Million), by Japan 2024 & 2032
                                                                                                  21. Figure 21: North America High Power Laser Systems Industry Revenue Share (%), by Japan 2024 & 2032
                                                                                                  22. Figure 22: North America High Power Laser Systems Industry Revenue (Million), by Europe 2024 & 2032
                                                                                                  23. Figure 23: North America High Power Laser Systems Industry Revenue Share (%), by Europe 2024 & 2032
                                                                                                  24. Figure 24: North America High Power Laser Systems Industry Revenue (Million), by North America 2024 & 2032
                                                                                                  25. Figure 25: North America High Power Laser Systems Industry Revenue Share (%), by North America 2024 & 2032
                                                                                                  26. Figure 26: North America High Power Laser Systems Industry Revenue (Million), by Rest of the World 2024 & 2032
                                                                                                  27. Figure 27: North America High Power Laser Systems Industry Revenue Share (%), by Rest of the World 2024 & 2032
                                                                                                  28. Figure 28: North America High Power Laser Systems Industry Revenue (Million), by Country 2024 & 2032
                                                                                                  29. Figure 29: North America High Power Laser Systems Industry Revenue Share (%), by Country 2024 & 2032
                                                                                                  30. Figure 30: South America High Power Laser Systems Industry Revenue (Million), by Cutting 2024 & 2032
                                                                                                  31. Figure 31: South America High Power Laser Systems Industry Revenue Share (%), by Cutting 2024 & 2032
                                                                                                  32. Figure 32: South America High Power Laser Systems Industry Revenue (Million), by Welding 2024 & 2032
                                                                                                  33. Figure 33: South America High Power Laser Systems Industry Revenue Share (%), by Welding 2024 & 2032
                                                                                                  34. Figure 34: South America High Power Laser Systems Industry Revenue (Million), by Others ( 2024 & 2032
                                                                                                  35. Figure 35: South America High Power Laser Systems Industry Revenue Share (%), by Others ( 2024 & 2032
                                                                                                  36. Figure 36: South America High Power Laser Systems Industry Revenue (Million), by China 2024 & 2032
                                                                                                  37. Figure 37: South America High Power Laser Systems Industry Revenue Share (%), by China 2024 & 2032
                                                                                                  38. Figure 38: South America High Power Laser Systems Industry Revenue (Million), by Japan 2024 & 2032
                                                                                                  39. Figure 39: South America High Power Laser Systems Industry Revenue Share (%), by Japan 2024 & 2032
                                                                                                  40. Figure 40: South America High Power Laser Systems Industry Revenue (Million), by Europe 2024 & 2032
                                                                                                  41. Figure 41: South America High Power Laser Systems Industry Revenue Share (%), by Europe 2024 & 2032
                                                                                                  42. Figure 42: South America High Power Laser Systems Industry Revenue (Million), by North America 2024 & 2032
                                                                                                  43. Figure 43: South America High Power Laser Systems Industry Revenue Share (%), by North America 2024 & 2032
                                                                                                  44. Figure 44: South America High Power Laser Systems Industry Revenue (Million), by Rest of the World 2024 & 2032
                                                                                                  45. Figure 45: South America High Power Laser Systems Industry Revenue Share (%), by Rest of the World 2024 & 2032
                                                                                                  46. Figure 46: South America High Power Laser Systems Industry Revenue (Million), by Country 2024 & 2032
                                                                                                  47. Figure 47: South America High Power Laser Systems Industry Revenue Share (%), by Country 2024 & 2032
                                                                                                  48. Figure 48: Europe High Power Laser Systems Industry Revenue (Million), by Cutting 2024 & 2032
                                                                                                  49. Figure 49: Europe High Power Laser Systems Industry Revenue Share (%), by Cutting 2024 & 2032
                                                                                                  50. Figure 50: Europe High Power Laser Systems Industry Revenue (Million), by Welding 2024 & 2032
                                                                                                  51. Figure 51: Europe High Power Laser Systems Industry Revenue Share (%), by Welding 2024 & 2032
                                                                                                  52. Figure 52: Europe High Power Laser Systems Industry Revenue (Million), by Others ( 2024 & 2032
                                                                                                  53. Figure 53: Europe High Power Laser Systems Industry Revenue Share (%), by Others ( 2024 & 2032
                                                                                                  54. Figure 54: Europe High Power Laser Systems Industry Revenue (Million), by China 2024 & 2032
                                                                                                  55. Figure 55: Europe High Power Laser Systems Industry Revenue Share (%), by China 2024 & 2032
                                                                                                  56. Figure 56: Europe High Power Laser Systems Industry Revenue (Million), by Japan 2024 & 2032
                                                                                                  57. Figure 57: Europe High Power Laser Systems Industry Revenue Share (%), by Japan 2024 & 2032
                                                                                                  58. Figure 58: Europe High Power Laser Systems Industry Revenue (Million), by Europe 2024 & 2032
                                                                                                  59. Figure 59: Europe High Power Laser Systems Industry Revenue Share (%), by Europe 2024 & 2032
                                                                                                  60. Figure 60: Europe High Power Laser Systems Industry Revenue (Million), by North America 2024 & 2032
                                                                                                  61. Figure 61: Europe High Power Laser Systems Industry Revenue Share (%), by North America 2024 & 2032
                                                                                                  62. Figure 62: Europe High Power Laser Systems Industry Revenue (Million), by Rest of the World 2024 & 2032
                                                                                                  63. Figure 63: Europe High Power Laser Systems Industry Revenue Share (%), by Rest of the World 2024 & 2032
                                                                                                  64. Figure 64: Europe High Power Laser Systems Industry Revenue (Million), by Country 2024 & 2032
                                                                                                  65. Figure 65: Europe High Power Laser Systems Industry Revenue Share (%), by Country 2024 & 2032
                                                                                                  66. Figure 66: Middle East & Africa High Power Laser Systems Industry Revenue (Million), by Cutting 2024 & 2032
                                                                                                  67. Figure 67: Middle East & Africa High Power Laser Systems Industry Revenue Share (%), by Cutting 2024 & 2032
                                                                                                  68. Figure 68: Middle East & Africa High Power Laser Systems Industry Revenue (Million), by Welding 2024 & 2032
                                                                                                  69. Figure 69: Middle East & Africa High Power Laser Systems Industry Revenue Share (%), by Welding 2024 & 2032
                                                                                                  70. Figure 70: Middle East & Africa High Power Laser Systems Industry Revenue (Million), by Others ( 2024 & 2032
                                                                                                  71. Figure 71: Middle East & Africa High Power Laser Systems Industry Revenue Share (%), by Others ( 2024 & 2032
                                                                                                  72. Figure 72: Middle East & Africa High Power Laser Systems Industry Revenue (Million), by China 2024 & 2032
                                                                                                  73. Figure 73: Middle East & Africa High Power Laser Systems Industry Revenue Share (%), by China 2024 & 2032
                                                                                                  74. Figure 74: Middle East & Africa High Power Laser Systems Industry Revenue (Million), by Japan 2024 & 2032
                                                                                                  75. Figure 75: Middle East & Africa High Power Laser Systems Industry Revenue Share (%), by Japan 2024 & 2032
                                                                                                  76. Figure 76: Middle East & Africa High Power Laser Systems Industry Revenue (Million), by Europe 2024 & 2032
                                                                                                  77. Figure 77: Middle East & Africa High Power Laser Systems Industry Revenue Share (%), by Europe 2024 & 2032
                                                                                                  78. Figure 78: Middle East & Africa High Power Laser Systems Industry Revenue (Million), by North America 2024 & 2032
                                                                                                  79. Figure 79: Middle East & Africa High Power Laser Systems Industry Revenue Share (%), by North America 2024 & 2032
                                                                                                  80. Figure 80: Middle East & Africa High Power Laser Systems Industry Revenue (Million), by Rest of the World 2024 & 2032
                                                                                                  81. Figure 81: Middle East & Africa High Power Laser Systems Industry Revenue Share (%), by Rest of the World 2024 & 2032
                                                                                                  82. Figure 82: Middle East & Africa High Power Laser Systems Industry Revenue (Million), by Country 2024 & 2032
                                                                                                  83. Figure 83: Middle East & Africa High Power Laser Systems Industry Revenue Share (%), by Country 2024 & 2032
                                                                                                  84. Figure 84: Asia Pacific High Power Laser Systems Industry Revenue (Million), by Cutting 2024 & 2032
                                                                                                  85. Figure 85: Asia Pacific High Power Laser Systems Industry Revenue Share (%), by Cutting 2024 & 2032
                                                                                                  86. Figure 86: Asia Pacific High Power Laser Systems Industry Revenue (Million), by Welding 2024 & 2032
                                                                                                  87. Figure 87: Asia Pacific High Power Laser Systems Industry Revenue Share (%), by Welding 2024 & 2032
                                                                                                  88. Figure 88: Asia Pacific High Power Laser Systems Industry Revenue (Million), by Others ( 2024 & 2032
                                                                                                  89. Figure 89: Asia Pacific High Power Laser Systems Industry Revenue Share (%), by Others ( 2024 & 2032
                                                                                                  90. Figure 90: Asia Pacific High Power Laser Systems Industry Revenue (Million), by China 2024 & 2032
                                                                                                  91. Figure 91: Asia Pacific High Power Laser Systems Industry Revenue Share (%), by China 2024 & 2032
                                                                                                  92. Figure 92: Asia Pacific High Power Laser Systems Industry Revenue (Million), by Japan 2024 & 2032
                                                                                                  93. Figure 93: Asia Pacific High Power Laser Systems Industry Revenue Share (%), by Japan 2024 & 2032
                                                                                                  94. Figure 94: Asia Pacific High Power Laser Systems Industry Revenue (Million), by Europe 2024 & 2032
                                                                                                  95. Figure 95: Asia Pacific High Power Laser Systems Industry Revenue Share (%), by Europe 2024 & 2032
                                                                                                  96. Figure 96: Asia Pacific High Power Laser Systems Industry Revenue (Million), by North America 2024 & 2032
                                                                                                  97. Figure 97: Asia Pacific High Power Laser Systems Industry Revenue Share (%), by North America 2024 & 2032
                                                                                                  98. Figure 98: Asia Pacific High Power Laser Systems Industry Revenue (Million), by Rest of the World 2024 & 2032
                                                                                                  99. Figure 99: Asia Pacific High Power Laser Systems Industry Revenue Share (%), by Rest of the World 2024 & 2032
                                                                                                  100. Figure 100: Asia Pacific High Power Laser Systems Industry Revenue (Million), by Country 2024 & 2032
                                                                                                  101. Figure 101: Asia Pacific High Power Laser Systems Industry Revenue Share (%), by Country 2024 & 2032

                                                                                                  List of Tables

                                                                                                  1. Table 1: Global High Power Laser Systems Industry Revenue Million Forecast, by Region 2019 & 2032
                                                                                                  2. Table 2: Global High Power Laser Systems Industry Revenue Million Forecast, by Cutting 2019 & 2032
                                                                                                  3. Table 3: Global High Power Laser Systems Industry Revenue Million Forecast, by Welding 2019 & 2032
                                                                                                  4. Table 4: Global High Power Laser Systems Industry Revenue Million Forecast, by Others ( 2019 & 2032
                                                                                                  5. Table 5: Global High Power Laser Systems Industry Revenue Million Forecast, by China 2019 & 2032
                                                                                                  6. Table 6: Global High Power Laser Systems Industry Revenue Million Forecast, by Japan 2019 & 2032
                                                                                                  7. Table 7: Global High Power Laser Systems Industry Revenue Million Forecast, by Europe 2019 & 2032
                                                                                                  8. Table 8: Global High Power Laser Systems Industry Revenue Million Forecast, by North America 2019 & 2032
                                                                                                  9. Table 9: Global High Power Laser Systems Industry Revenue Million Forecast, by Rest of the World 2019 & 2032
                                                                                                  10. Table 10: Global High Power Laser Systems Industry Revenue Million Forecast, by Region 2019 & 2032
                                                                                                  11. Table 11: Global High Power Laser Systems Industry Revenue Million Forecast, by Country 2019 & 2032
                                                                                                  12. Table 12: United States High Power Laser Systems Industry Revenue (Million) Forecast, by Application 2019 & 2032
                                                                                                  13. Table 13: Canada High Power Laser Systems Industry Revenue (Million) Forecast, by Application 2019 & 2032
                                                                                                  14. Table 14: Mexico High Power Laser Systems Industry Revenue (Million) Forecast, by Application 2019 & 2032
                                                                                                  15. Table 15: Global High Power Laser Systems Industry Revenue Million Forecast, by Country 2019 & 2032
                                                                                                  16. Table 16: China High Power Laser Systems Industry Revenue (Million) Forecast, by Application 2019 & 2032
                                                                                                  17. Table 17: Japan High Power Laser Systems Industry Revenue (Million) Forecast, by Application 2019 & 2032
                                                                                                  18. Table 18: India High Power Laser Systems Industry Revenue (Million) Forecast, by Application 2019 & 2032
                                                                                                  19. Table 19: South Korea High Power Laser Systems Industry Revenue (Million) Forecast, by Application 2019 & 2032
                                                                                                  20. Table 20: Taiwan High Power Laser Systems Industry Revenue (Million) Forecast, by Application 2019 & 2032
                                                                                                  21. Table 21: Australia High Power Laser Systems Industry Revenue (Million) Forecast, by Application 2019 & 2032
                                                                                                  22. Table 22: Rest of Asia-Pacific High Power Laser Systems Industry Revenue (Million) Forecast, by Application 2019 & 2032
                                                                                                  23. Table 23: Global High Power Laser Systems Industry Revenue Million Forecast, by Country 2019 & 2032
                                                                                                  24. Table 24: Germany High Power Laser Systems Industry Revenue (Million) Forecast, by Application 2019 & 2032
                                                                                                  25. Table 25: France High Power Laser Systems Industry Revenue (Million) Forecast, by Application 2019 & 2032
                                                                                                  26. Table 26: Italy High Power Laser Systems Industry Revenue (Million) Forecast, by Application 2019 & 2032
                                                                                                  27. Table 27: United Kingdom High Power Laser Systems Industry Revenue (Million) Forecast, by Application 2019 & 2032
                                                                                                  28. Table 28: Netherlands High Power Laser Systems Industry Revenue (Million) Forecast, by Application 2019 & 2032
                                                                                                  29. Table 29: Rest of Europe High Power Laser Systems Industry Revenue (Million) Forecast, by Application 2019 & 2032
                                                                                                  30. Table 30: Global High Power Laser Systems Industry Revenue Million Forecast, by Country 2019 & 2032
                                                                                                  31. Table 31: Brazil High Power Laser Systems Industry Revenue (Million) Forecast, by Application 2019 & 2032
                                                                                                  32. Table 32: Argentina High Power Laser Systems Industry Revenue (Million) Forecast, by Application 2019 & 2032
                                                                                                  33. Table 33: Rest of South America High Power Laser Systems Industry Revenue (Million) Forecast, by Application 2019 & 2032
                                                                                                  34. Table 34: Global High Power Laser Systems Industry Revenue Million Forecast, by Country 2019 & 2032
                                                                                                  35. Table 35: UAE High Power Laser Systems Industry Revenue (Million) Forecast, by Application 2019 & 2032
                                                                                                  36. Table 36: South Africa High Power Laser Systems Industry Revenue (Million) Forecast, by Application 2019 & 2032
                                                                                                  37. Table 37: Saudi Arabia High Power Laser Systems Industry Revenue (Million) Forecast, by Application 2019 & 2032
                                                                                                  38. Table 38: Rest of MEA High Power Laser Systems Industry Revenue (Million) Forecast, by Application 2019 & 2032
                                                                                                  39. Table 39: Global High Power Laser Systems Industry Revenue Million Forecast, by Cutting 2019 & 2032
                                                                                                  40. Table 40: Global High Power Laser Systems Industry Revenue Million Forecast, by Welding 2019 & 2032
                                                                                                  41. Table 41: Global High Power Laser Systems Industry Revenue Million Forecast, by Others ( 2019 & 2032
                                                                                                  42. Table 42: Global High Power Laser Systems Industry Revenue Million Forecast, by China 2019 & 2032
                                                                                                  43. Table 43: Global High Power Laser Systems Industry Revenue Million Forecast, by Japan 2019 & 2032
                                                                                                  44. Table 44: Global High Power Laser Systems Industry Revenue Million Forecast, by Europe 2019 & 2032
                                                                                                  45. Table 45: Global High Power Laser Systems Industry Revenue Million Forecast, by North America 2019 & 2032
                                                                                                  46. Table 46: Global High Power Laser Systems Industry Revenue Million Forecast, by Rest of the World 2019 & 2032
                                                                                                  47. Table 47: Global High Power Laser Systems Industry Revenue Million Forecast, by Country 2019 & 2032
                                                                                                  48. Table 48: United States High Power Laser Systems Industry Revenue (Million) Forecast, by Application 2019 & 2032
                                                                                                  49. Table 49: Canada High Power Laser Systems Industry Revenue (Million) Forecast, by Application 2019 & 2032
                                                                                                  50. Table 50: Mexico High Power Laser Systems Industry Revenue (Million) Forecast, by Application 2019 & 2032
                                                                                                  51. Table 51: Global High Power Laser Systems Industry Revenue Million Forecast, by Cutting 2019 & 2032
                                                                                                  52. Table 52: Global High Power Laser Systems Industry Revenue Million Forecast, by Welding 2019 & 2032
                                                                                                  53. Table 53: Global High Power Laser Systems Industry Revenue Million Forecast, by Others ( 2019 & 2032
                                                                                                  54. Table 54: Global High Power Laser Systems Industry Revenue Million Forecast, by China 2019 & 2032
                                                                                                  55. Table 55: Global High Power Laser Systems Industry Revenue Million Forecast, by Japan 2019 & 2032
                                                                                                  56. Table 56: Global High Power Laser Systems Industry Revenue Million Forecast, by Europe 2019 & 2032
                                                                                                  57. Table 57: Global High Power Laser Systems Industry Revenue Million Forecast, by North America 2019 & 2032
                                                                                                  58. Table 58: Global High Power Laser Systems Industry Revenue Million Forecast, by Rest of the World 2019 & 2032
                                                                                                  59. Table 59: Global High Power Laser Systems Industry Revenue Million Forecast, by Country 2019 & 2032
                                                                                                  60. Table 60: Brazil High Power Laser Systems Industry Revenue (Million) Forecast, by Application 2019 & 2032
                                                                                                  61. Table 61: Argentina High Power Laser Systems Industry Revenue (Million) Forecast, by Application 2019 & 2032
                                                                                                  62. Table 62: Rest of South America High Power Laser Systems Industry Revenue (Million) Forecast, by Application 2019 & 2032
                                                                                                  63. Table 63: Global High Power Laser Systems Industry Revenue Million Forecast, by Cutting 2019 & 2032
                                                                                                  64. Table 64: Global High Power Laser Systems Industry Revenue Million Forecast, by Welding 2019 & 2032
                                                                                                  65. Table 65: Global High Power Laser Systems Industry Revenue Million Forecast, by Others ( 2019 & 2032
                                                                                                  66. Table 66: Global High Power Laser Systems Industry Revenue Million Forecast, by China 2019 & 2032
                                                                                                  67. Table 67: Global High Power Laser Systems Industry Revenue Million Forecast, by Japan 2019 & 2032
                                                                                                  68. Table 68: Global High Power Laser Systems Industry Revenue Million Forecast, by Europe 2019 & 2032
                                                                                                  69. Table 69: Global High Power Laser Systems Industry Revenue Million Forecast, by North America 2019 & 2032
                                                                                                  70. Table 70: Global High Power Laser Systems Industry Revenue Million Forecast, by Rest of the World 2019 & 2032
                                                                                                  71. Table 71: Global High Power Laser Systems Industry Revenue Million Forecast, by Country 2019 & 2032
                                                                                                  72. Table 72: United Kingdom High Power Laser Systems Industry Revenue (Million) Forecast, by Application 2019 & 2032
                                                                                                  73. Table 73: Germany High Power Laser Systems Industry Revenue (Million) Forecast, by Application 2019 & 2032
                                                                                                  74. Table 74: France High Power Laser Systems Industry Revenue (Million) Forecast, by Application 2019 & 2032
                                                                                                  75. Table 75: Italy High Power Laser Systems Industry Revenue (Million) Forecast, by Application 2019 & 2032
                                                                                                  76. Table 76: Spain High Power Laser Systems Industry Revenue (Million) Forecast, by Application 2019 & 2032
                                                                                                  77. Table 77: Russia High Power Laser Systems Industry Revenue (Million) Forecast, by Application 2019 & 2032
                                                                                                  78. Table 78: Benelux High Power Laser Systems Industry Revenue (Million) Forecast, by Application 2019 & 2032
                                                                                                  79. Table 79: Nordics High Power Laser Systems Industry Revenue (Million) Forecast, by Application 2019 & 2032
                                                                                                  80. Table 80: Rest of Europe High Power Laser Systems Industry Revenue (Million) Forecast, by Application 2019 & 2032
                                                                                                  81. Table 81: Global High Power Laser Systems Industry Revenue Million Forecast, by Cutting 2019 & 2032
                                                                                                  82. Table 82: Global High Power Laser Systems Industry Revenue Million Forecast, by Welding 2019 & 2032
                                                                                                  83. Table 83: Global High Power Laser Systems Industry Revenue Million Forecast, by Others ( 2019 & 2032
                                                                                                  84. Table 84: Global High Power Laser Systems Industry Revenue Million Forecast, by China 2019 & 2032
                                                                                                  85. Table 85: Global High Power Laser Systems Industry Revenue Million Forecast, by Japan 2019 & 2032
                                                                                                  86. Table 86: Global High Power Laser Systems Industry Revenue Million Forecast, by Europe 2019 & 2032
                                                                                                  87. Table 87: Global High Power Laser Systems Industry Revenue Million Forecast, by North America 2019 & 2032
                                                                                                  88. Table 88: Global High Power Laser Systems Industry Revenue Million Forecast, by Rest of the World 2019 & 2032
                                                                                                  89. Table 89: Global High Power Laser Systems Industry Revenue Million Forecast, by Country 2019 & 2032
                                                                                                  90. Table 90: Turkey High Power Laser Systems Industry Revenue (Million) Forecast, by Application 2019 & 2032
                                                                                                  91. Table 91: Israel High Power Laser Systems Industry Revenue (Million) Forecast, by Application 2019 & 2032
                                                                                                  92. Table 92: GCC High Power Laser Systems Industry Revenue (Million) Forecast, by Application 2019 & 2032
                                                                                                  93. Table 93: North Africa High Power Laser Systems Industry Revenue (Million) Forecast, by Application 2019 & 2032
                                                                                                  94. Table 94: South Africa High Power Laser Systems Industry Revenue (Million) Forecast, by Application 2019 & 2032
                                                                                                  95. Table 95: Rest of Middle East & Africa High Power Laser Systems Industry Revenue (Million) Forecast, by Application 2019 & 2032
                                                                                                  96. Table 96: Global High Power Laser Systems Industry Revenue Million Forecast, by Cutting 2019 & 2032
                                                                                                  97. Table 97: Global High Power Laser Systems Industry Revenue Million Forecast, by Welding 2019 & 2032
                                                                                                  98. Table 98: Global High Power Laser Systems Industry Revenue Million Forecast, by Others ( 2019 & 2032
                                                                                                  99. Table 99: Global High Power Laser Systems Industry Revenue Million Forecast, by China 2019 & 2032
                                                                                                  100. Table 100: Global High Power Laser Systems Industry Revenue Million Forecast, by Japan 2019 & 2032
                                                                                                  101. Table 101: Global High Power Laser Systems Industry Revenue Million Forecast, by Europe 2019 & 2032
                                                                                                  102. Table 102: Global High Power Laser Systems Industry Revenue Million Forecast, by North America 2019 & 2032
                                                                                                  103. Table 103: Global High Power Laser Systems Industry Revenue Million Forecast, by Rest of the World 2019 & 2032
                                                                                                  104. Table 104: Global High Power Laser Systems Industry Revenue Million Forecast, by Country 2019 & 2032
                                                                                                  105. Table 105: China High Power Laser Systems Industry Revenue (Million) Forecast, by Application 2019 & 2032
                                                                                                  106. Table 106: India High Power Laser Systems Industry Revenue (Million) Forecast, by Application 2019 & 2032
                                                                                                  107. Table 107: Japan High Power Laser Systems Industry Revenue (Million) Forecast, by Application 2019 & 2032
                                                                                                  108. Table 108: South Korea High Power Laser Systems Industry Revenue (Million) Forecast, by Application 2019 & 2032
                                                                                                  109. Table 109: ASEAN High Power Laser Systems Industry Revenue (Million) Forecast, by Application 2019 & 2032
                                                                                                  110. Table 110: Oceania High Power Laser Systems Industry Revenue (Million) Forecast, by Application 2019 & 2032
                                                                                                  111. Table 111: Rest of Asia Pacific High Power Laser Systems Industry Revenue (Million) Forecast, by Application 2019 & 2032


                                                                                                  Frequently Asked Questions

                                                                                                  1. What is the projected Compound Annual Growth Rate (CAGR) of the High Power Laser Systems Industry?

                                                                                                  The projected CAGR is approximately > 7.10%.

                                                                                                  2. Which companies are prominent players in the High Power Laser Systems Industry?

                                                                                                  Key companies in the market include Coherent Inc, IP Photonics Corporation, Han's Laser Technology Industry Group, El En S p A, Preco Inc, TRUMPF SE + Co KG, Prima Industrie S p A, Bystronic Laser AG, HSG Laser*List Not Exhaustive.

                                                                                                  3. What are the main segments of the High Power Laser Systems Industry?

                                                                                                  The market segments include Cutting, Welding, Others (, China, Japan, Europe, North America, Rest of the World.

                                                                                                  4. Can you provide details about the market size?

                                                                                                  The market size is estimated to be USD XX Million as of 2022.

                                                                                                  5. What are some drivers contributing to market growth?

                                                                                                  Growing demand for Fixed Broadband Services; Rising demand for 5G; Growth of IoT usage in Telecom.

                                                                                                  6. What are the notable trends driving market growth?

                                                                                                  Welding Segment is Expected to Hold a Major Market Share.

                                                                                                  7. Are there any restraints impacting market growth?

                                                                                                  Relatively Low Levels of Awareness and Regulatory Challenges.

                                                                                                  8. Can you provide examples of recent developments in the market?

                                                                                                  April 2022 - Bystronic Group's flagship laser cutting systems were made available with 20 kilowatts of laser power and an optimized cutting process. The high-end fiber laser represents high-precision Bystronic technology, a reliable cutting process with extremely high laser outputs, and a wide range of applications. This enables sheet metal processing companies to take another significant step forward in productivity and efficiency, as claimed by the company.

                                                                                                  9. What pricing options are available for accessing the report?

                                                                                                  Pricing options include single-user, multi-user, and enterprise licenses priced at USD 4750, USD 5250, and USD 8750 respectively.

                                                                                                  10. Is the market size provided in terms of value or volume?

                                                                                                  The market size is provided in terms of value, measured in Million.

                                                                                                  11. Are there any specific market keywords associated with the report?

                                                                                                  Yes, the market keyword associated with the report is "High Power Laser Systems Industry," which aids in identifying and referencing the specific market segment covered.

                                                                                                  12. How do I determine which pricing option suits my needs best?

                                                                                                  The pricing options vary based on user requirements and access needs. Individual users may opt for single-user licenses, while businesses requiring broader access may choose multi-user or enterprise licenses for cost-effective access to the report.

                                                                                                  13. Are there any additional resources or data provided in the High Power Laser Systems Industry report?

                                                                                                  While the report offers comprehensive insights, it's advisable to review the specific contents or supplementary materials provided to ascertain if additional resources or data are available.

                                                                                                  14. How can I stay updated on further developments or reports in the High Power Laser Systems Industry?

                                                                                                  To stay informed about further developments, trends, and reports in the High Power Laser Systems Industry, consider subscribing to industry newsletters, following relevant companies and organizations, or regularly checking reputable industry news sources and publications.


                                                                                                  Methodology

                                                                                                  Step 1 - Identification of Relevant Samples Size from Population Database

                                                                                                  Step Chart
                                                                                                  Bar Chart
                                                                                                  Method Chart

                                                                                                  Step 2 - Approaches for Defining Global Market Size (Value, Volume* & Price*)

                                                                                                  Approach Chart
                                                                                                  Top-down and bottom-up approaches are used to validate the global market size and estimate the market size for manufactures, regional segments, product, and application.

                                                                                                  Note*: In applicable scenarios

                                                                                                  Step 3 - Data Sources

                                                                                                  Primary Research

                                                                                                  • Web Analytics
                                                                                                  • Survey Reports
                                                                                                  • Research Institute
                                                                                                  • Latest Research Reports
                                                                                                  • Opinion Leaders

                                                                                                  Secondary Research

                                                                                                  • Annual Reports
                                                                                                  • White Paper
                                                                                                  • Latest Press Release
                                                                                                  • Industry Association
                                                                                                  • Paid Database
                                                                                                  • Investor Presentations
                                                                                                  Analyst Chart

                                                                                                  Step 4 - Data Triangulation

                                                                                                  Involves using different sources of information in order to increase the validity of a study

                                                                                                  These sources are likely to be stakeholders in a program - participants, other researchers, program staff, other community members, and so on.

                                                                                                  Then we put all data in single framework & apply various statistical tools to find out the dynamic on the market.

                                                                                                  During the analysis stage, feedback from the stakeholder groups would be compared to determine areas of agreement as well as areas of divergence

                                                                                                  Additionally, after gathering mixed and scattered data from a wide range of sources, data is triangulated and correlated to come up with estimated figures which are further validated through primary mediums or industry experts, opinion leaders.

                                                                                                  About Research Axiom

                                                                                                  Research Axiom delivers in-depth market research, industry analysis, and consulting for pharmaceuticals, automotive, IT, and consumer goods. Our reports provide the clarity you need to make informed decisions and drive innovation.

                                                                                                  Our team combines primary research, advanced analytics, and sector expertise to deliver actionable intelligence. We offer syndicated reports, custom research, and consulting services tailored to your business needs.

                                                                                                  At Research Axiom, we are committed to quality, transparency, and client satisfaction. Every report is rigorously validated to ensure accuracy and relevance. Our global perspective and local expertise help you understand both the big picture and the finer details of your market.

                                                                                                  Stay informed with Research Axiom. Subscribe to our newsletter for the latest updates and research highlights, and follow us on social media for real-time insights. Research Axiom – Turning Data into Business Advantage.

                                                                                                  artwork spiralartwork spiralRelated Reports
                                                                                                  artwork underline

                                                                                                  Trade Management Software Market Market Analysis and Forecasts

                                                                                                  The global Trade Management Software market is booming, projected to reach $3 billion by 2033 with a 9.90% CAGR. Learn about key drivers, trends, restraints, and leading companies shaping this dynamic sector. Discover market size, segmentation, and regional analysis.

                                                                                                  July 2025
                                                                                                  Base Year: 2024
                                                                                                  No Of Pages: 234
                                                                                                  Price: $4750

                                                                                                  Decoding Middle East and Africa Soft Facility Management Market Consumer Preferences 2025-2033

                                                                                                  Discover the booming Middle East & Africa Soft Facility Management market! Explore its $XX million valuation, 7.70% CAGR growth, key drivers, trends, and leading companies like EFS Facilities Services Group and Farnek Services LLC. This comprehensive analysis covers key segments and regional breakdowns for 2025-2033.

                                                                                                  July 2025
                                                                                                  Base Year: 2024
                                                                                                  No Of Pages: 210
                                                                                                  Price: $4750

                                                                                                  Strategizing Growth: Industrial AI Software Market Market’s Decade Ahead 2025-2033

                                                                                                  The Industrial AI Software market is booming, projected to reach $114.68 million in 2025 with a 35.97% CAGR. Discover key trends, drivers, and regional insights for this rapidly expanding sector, including leading companies like Nvidia, IBM, and Microsoft. Explore market segmentation by end-user industry and deployment type.

                                                                                                  July 2025
                                                                                                  Base Year: 2024
                                                                                                  No Of Pages: 234
                                                                                                  Price: $4750

                                                                                                  Market Deep Dive: Exploring Simulation Software Industry Trends 2025-2033

                                                                                                  The simulation software market is booming, projected to reach $30 billion by 2033 with a 12.06% CAGR. This in-depth analysis explores key drivers, trends, and regional market shares, highlighting leading companies and the transformative impact of cloud-based solutions and AI on product design and development. Discover market insights and growth projections for automotive, aerospace, and other key sectors.

                                                                                                  July 2025
                                                                                                  Base Year: 2024
                                                                                                  No Of Pages: 234
                                                                                                  Price: $4750

                                                                                                  Consumer Technical Support Services Market Market Strategies: Trends and Outlook 2025-2033

                                                                                                  The global Consumer Technical Support Services market is booming, projected to reach [estimated market size in 2033] by 2033 with a CAGR of 7.30%. Learn about key drivers, trends, restraints, and major players shaping this rapidly growing sector. Explore regional market shares and future growth potential.

                                                                                                  July 2025
                                                                                                  Base Year: 2024
                                                                                                  No Of Pages: 234
                                                                                                  Price: $4750

                                                                                                  Emerging Trends in North America Speech Analytics Market: A Technology Perspective 2025-2033

                                                                                                  The North America Speech Analytics Market is booming, projected to reach [estimated 2033 value] million by 2033, with a CAGR of 13.20%. Discover key drivers, trends, and challenges impacting this rapidly growing sector, along with leading vendors and market segmentation analysis.

                                                                                                  July 2025
                                                                                                  Base Year: 2024
                                                                                                  No Of Pages: 210
                                                                                                  Price: $4750

                                                                                                  Comprehensive Review of Rugged Display Industry Growth Potential

                                                                                                  The rugged display market is booming, projected to reach \$14.85B by 2033 with a 4.43% CAGR. This in-depth analysis explores market drivers, trends, restraints, and key players in industries like oil & gas, defense, and automotive. Discover insights into regional market share and key product segments.

                                                                                                  July 2025
                                                                                                  Base Year: 2024
                                                                                                  No Of Pages: 234
                                                                                                  Price: $4750

                                                                                                  Commercial Lighting Market Future-Proofing Growth: Strategic Insights and Analysis 2025-2033

                                                                                                  The commercial lighting market is booming, projected to reach \$69.21 billion by 2033 with a CAGR of 20.93%! Driven by LED adoption and smart lighting solutions, this in-depth analysis explores market size, key trends, leading companies (Signify, Cree, Acuity Brands), and regional growth across North America, Europe, and Asia Pacific. Discover the future of commercial lighting.

                                                                                                  July 2025
                                                                                                  Base Year: 2024
                                                                                                  No Of Pages: 234
                                                                                                  Price: $4750

                                                                                                  Asia-Pacific Package Testing Industry Comprehensive Market Study: Trends and Predictions 2025-2033

                                                                                                  The Asia-Pacific package testing market is booming, projected to reach $8.17 billion by 2033 with a CAGR of 6.20%. Driven by e-commerce, sustainability concerns, and stringent regulations, this report analyzes market trends, key players (ALS, Intertek, SGS), and segmentations (materials, testing types, industries) across key APAC regions.

                                                                                                  July 2025
                                                                                                  Base Year: 2024
                                                                                                  No Of Pages: 234
                                                                                                  Price: $4750

                                                                                                  Future Trends Shaping Carbon Management System Market Growth

                                                                                                  The Carbon Management System (CMS) market is booming, projected to reach $14.37B by 2025 with a 12.09% CAGR. Discover key drivers, trends, and leading companies shaping this crucial sector for environmental sustainability. Learn more about software, services, and regional market analysis.

                                                                                                  July 2025
                                                                                                  Base Year: 2024
                                                                                                  No Of Pages: 234
                                                                                                  Price: $4750

                                                                                                  Latin America IT Device Market XX CAGR Growth to Drive Market Size to XXX Million by 2033

                                                                                                  Discover the latest insights on the booming Latin American IT device market. Explore growth trends, key players (Samsung, Apple, Xiaomi), regional variations (Brazil, Mexico), and future projections for tablets, phones, and PCs from 2025-2033. Learn how economic factors and technological advancements shape this dynamic market.

                                                                                                  July 2025
                                                                                                  Base Year: 2024
                                                                                                  No Of Pages: 234
                                                                                                  Price: $4750

                                                                                                  Air Quality Monitoring Software Market Market’s Growth Blueprint

                                                                                                  The Air Quality Monitoring Software market is booming, projected to reach $XX million by 2033 with a 6.30% CAGR. Driven by environmental concerns and smart city initiatives, this report analyzes market trends, key players (Horiba, Thermo Fisher, Honeywell), and regional growth (North America, Europe, Asia-Pacific). Discover key insights and future projections for this rapidly expanding sector.

                                                                                                  July 2025
                                                                                                  Base Year: 2024
                                                                                                  No Of Pages: 234
                                                                                                  Price: $4750

                                                                                                  Belgium Data Center Storage Market 2025-2033 Overview: Trends, Dynamics, and Growth Opportunities

                                                                                                  Discover the booming Belgium Data Center Storage Market! Explore 2025-2033 market size, CAGR of 2.29%, key drivers, trends, and top companies like Dell, HPE, and more. Get insights into storage technologies (NAS, SAN, DAS, All-Flash), end-user segments, and regional analysis. Download the report now!

                                                                                                  July 2025
                                                                                                  Base Year: 2024
                                                                                                  No Of Pages: 197
                                                                                                  Price: $3800

                                                                                                  Global Finland OOH And DOOH Market Trends: Region-Specific Insights 2025-2033

                                                                                                  Discover the booming Finland OOH & DOOH advertising market! Explore its €102.24 million (2025) valuation, 19.17% CAGR, key players, and future trends shaping this dynamic sector. Learn about growth drivers, regional insights, and market forecasts until 2033.

                                                                                                  July 2025
                                                                                                  Base Year: 2024
                                                                                                  No Of Pages: 197
                                                                                                  Price: $3800

                                                                                                  Smartphone Industry Charting Growth Trajectories: Analysis and Forecasts 2025-2033

                                                                                                  The global smartphone market is booming, projected to reach \$2.07 trillion by 2033 with a 4.10% CAGR. This in-depth analysis explores market size, key players (Apple, Samsung, Xiaomi), regional trends (Asia, North America), and future growth drivers like 5G and foldable phones. Discover the latest insights on Android vs. iOS and unlock the secrets to success in this dynamic industry.

                                                                                                  July 2025
                                                                                                  Base Year: 2024
                                                                                                  No Of Pages: 197
                                                                                                  Price: $3800

                                                                                                  Exploring Utility Locator Industry’s Market Size Dynamics 2025-2033

                                                                                                  Discover the booming Utility Locator market projected to reach $X Billion by 2033, growing at a CAGR of 6.56%. This comprehensive analysis explores market drivers, trends, restraints, segmentation (by target, technique, application, offering), key players, and regional insights. Learn about the latest technologies like EMF and GPR shaping this crucial infrastructure sector.

                                                                                                  July 2025
                                                                                                  Base Year: 2024
                                                                                                  No Of Pages: 234
                                                                                                  Price: $4750

                                                                                                  Heads Up Display Industry Market Strategies for the Next Decade: 2025-2033

                                                                                                  The Heads-Up Display (HUD) market is booming, projected to reach [estimated market size in 2033] million by 2033, with a CAGR of 21.20%. Discover key trends, driving factors, major players (like Collins Aerospace, Denso, Visteon), and regional market shares in this comprehensive market analysis. Learn about windshield-based, combiner-based, and AR-HUD technologies.

                                                                                                  July 2025
                                                                                                  Base Year: 2024
                                                                                                  No Of Pages: 234
                                                                                                  Price: $4750

                                                                                                  Exploring Opportunities in Poland Data Center Storage Market Sector

                                                                                                  Poland's Data Center Storage Market is booming, projected to reach €1.38 billion by 2033, with a CAGR of 11.70%. Driven by cloud adoption, big data, and digital transformation, this market offers lucrative opportunities for vendors. Explore key trends, segments, and leading companies shaping this dynamic landscape.

                                                                                                  July 2025
                                                                                                  Base Year: 2024
                                                                                                  No Of Pages: 197
                                                                                                  Price: $3800

                                                                                                  Demand Patterns in Italy Data Center Storage Market Market: Projections to 2033

                                                                                                  Discover the booming Italy Data Center Storage market forecast to 2033! This comprehensive analysis reveals a €460 million market in 2025, growing at a 10.63% CAGR, driven by cloud adoption, digital transformation, and big data. Explore market segments, key players (Dell, NetApp, HPE), and growth drivers in this in-depth report.

                                                                                                  July 2025
                                                                                                  Base Year: 2024
                                                                                                  No Of Pages: 197
                                                                                                  Price: $3800

                                                                                                  Singapore Ecommerce Industry Insightful Analysis: Trends, Competitor Dynamics, and Opportunities 2025-2033

                                                                                                  Discover the booming Singapore e-commerce market! This in-depth analysis reveals a CAGR of 11%, key players like Shopee & Lazada, and future growth projections to 2033. Learn about market drivers, trends, and challenges in this dynamic sector.

                                                                                                  July 2025
                                                                                                  Base Year: 2024
                                                                                                  No Of Pages: 197
                                                                                                  Price: $3800
                                                                                                  • Home
                                                                                                  • About Us
                                                                                                  • Industries
                                                                                                    • Aerospace & Defense
                                                                                                    • Agriculture
                                                                                                    • Animal Nutrition & Wellness
                                                                                                    • Automotive
                                                                                                    • Chemicals & Materials
                                                                                                    • Consumer Goods and Services
                                                                                                    • Energy & Power
                                                                                                    • Financial Services and Investment Intelligence
                                                                                                    • Food & Beverage
                                                                                                    • Home and Property Improvement
                                                                                                    • Hospitality and Tourism
                                                                                                    • Logistics
                                                                                                    • Manufacturing Products and Services
                                                                                                    • Packaging
                                                                                                    • Professional and Commercial Services
                                                                                                    • Real Estate and Construction
                                                                                                    • Retail
                                                                                                    • Technology, Media and Telecom
                                                                                                    • Healthcare
                                                                                                  • Services
                                                                                                  • Contact
                                                                                                  Main Logo
                                                                                                  • Home
                                                                                                  • About Us
                                                                                                  • Industries
                                                                                                    • Aerospace & Defense
                                                                                                    • Agriculture
                                                                                                    • Animal Nutrition & Wellness
                                                                                                    • Automotive
                                                                                                    • Chemicals & Materials
                                                                                                    • Consumer Goods and Services
                                                                                                    • Energy & Power
                                                                                                    • Financial Services and Investment Intelligence
                                                                                                    • Food & Beverage
                                                                                                    • Home and Property Improvement
                                                                                                    • Hospitality and Tourism
                                                                                                    • Logistics
                                                                                                    • Manufacturing Products and Services
                                                                                                    • Packaging
                                                                                                    • Professional and Commercial Services
                                                                                                    • Real Estate and Construction
                                                                                                    • Retail
                                                                                                    • Technology, Media and Telecom
                                                                                                    • Healthcare
                                                                                                  • Services
                                                                                                  • Contact
                                                                                                  +17162654855
                                                                                                  [email protected]

                                                                                                  +17162654855

                                                                                                  [email protected]

                                                                                                  Business Address

                                                                                                  Head Office

                                                                                                  Office no. A 5010, fifth floor, Solitaire Business Hub, Near Phoenix mall, Pune, Maharashtra 411014

                                                                                                  Contact Information

                                                                                                  Craig Francis

                                                                                                  Business Development Head

                                                                                                  +17162654855

                                                                                                  [email protected]

                                                                                                  Connect With Us

                                                                                                  Secure Payment Partners

                                                                                                  payment image
                                                                                                  RetailLogisticsPackagingAutomotiveHealthcareAgricultureEnergy & PowerFood & BeverageAerospace & DefenseChemicals & MaterialsHospitality and TourismAnimal Nutrition & WellnessConsumer Goods and ServicesReal Estate and ConstructionHome and Property ImprovementTechnology, Media and TelecomManufacturing Products and ServicesFinancial Services and Investment Intelligence

                                                                                                  © 2025 All rights reserved


                                                                                                  Privacy Policy
                                                                                                  Terms and Conditions
                                                                                                  FAQ