Key Insights
The high-purity cyanuric chloride market is projected for significant growth, driven by escalating demand in essential applications including herbicides, disinfectants, and flame retardants. Key growth drivers include a rising global population and increased agricultural output, necessitating expanded use of herbicides and disinfectants. Additionally, stringent regulations for water purification and disinfection are boosting the adoption of high-purity cyanuric chloride due to its efficacy and safety. The market is segmented by application, region (North America, Europe, Asia-Pacific), and manufacturing process. Competition is moderately concentrated, featuring major global players and regional manufacturers. Despite challenges from supply chain volatility and raw material price fluctuations, the market outlook is positive, supported by sustained growth in end-use industries.
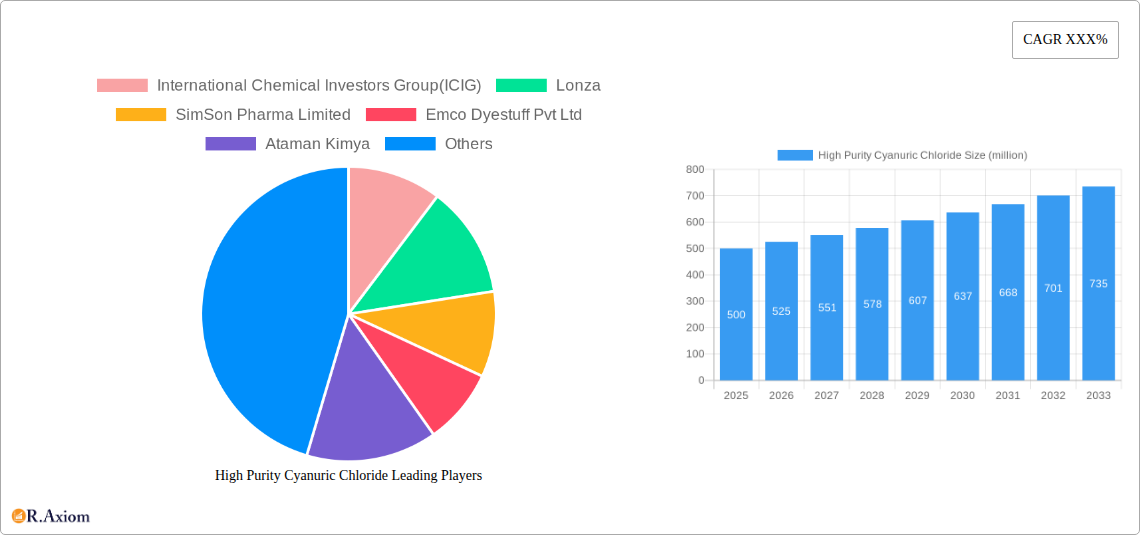
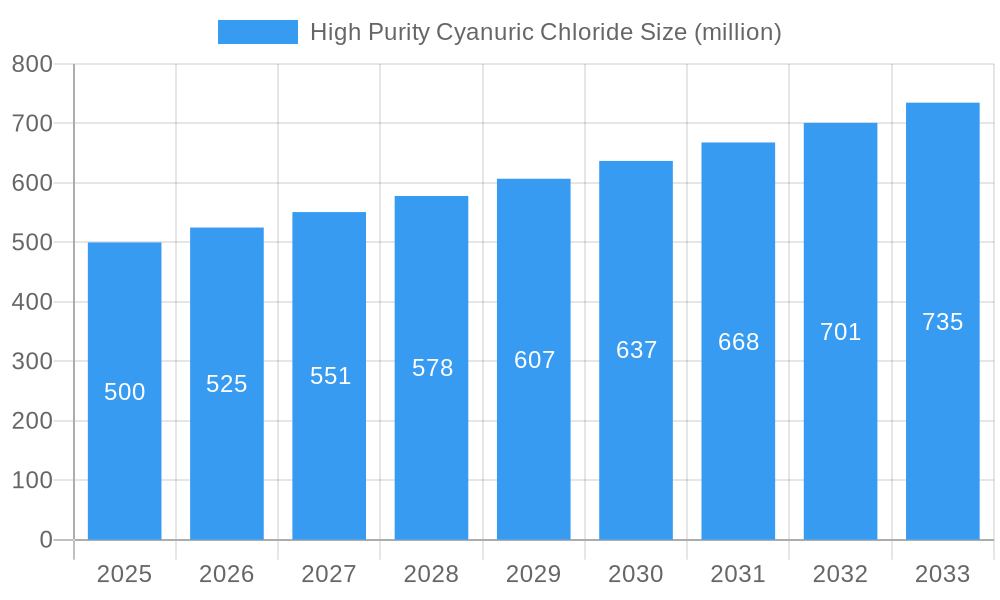
High Purity Cyanuric Chloride Market Size (In Million)
Technological advancements in production are anticipated to improve efficiency and reduce costs, further accelerating market expansion. The Asia-Pacific region is expected to lead growth, fueled by its expanding agricultural sector and increasing industrialization. Market participants must navigate environmental regulations concerning cyanuric chloride use and disposal. Companies are prioritizing innovation and diversification to enhance competitiveness, with strategic mergers and acquisitions likely to shape the future market. The steady growth trend, coupled with evolving industry dynamics, offers considerable opportunities for both established and emerging companies.
High Purity Cyanuric Chloride Company Market Share
High Purity Cyanuric Chloride Market Report: 2019-2033
This comprehensive report provides a detailed analysis of the global High Purity Cyanuric Chloride market, offering invaluable insights for industry stakeholders, investors, and researchers. The study period spans from 2019 to 2033, with 2025 serving as both the base and estimated year. The report leverages rigorous data analysis and expert forecasting to illuminate market trends, competitive landscapes, and future growth prospects. Millions are used for all values.
High Purity Cyanuric Chloride Market Concentration & Innovation
This section analyzes the market concentration, innovation drivers, regulatory landscape, and competitive dynamics within the high-purity cyanuric chloride industry. The report examines the market share held by key players like International Chemical Investors Group (ICIG), Lonza, SimSon Pharma Limited, Emco Dyestuff Pvt Ltd, Ataman Kimya, Hebei Chengxin Group, Tiande Chemical, TNJ Chemical, Zaoyang Jinlu Chemical, Cangzhou Lingang Yueguo Chemical, and Yingkou Sanzheng Organic Chemical. The analysis includes an assessment of mergers and acquisitions (M&A) activities, detailing the value of significant deals concluded during the historical period (2019-2024). Market concentration is evaluated using metrics such as the Herfindahl-Hirschman Index (HHI) and market share distribution. The report further explores innovation drivers, including advancements in manufacturing processes, the development of new applications, and the increasing demand for high-purity products. Regulatory frameworks impacting the industry are also examined, along with an analysis of product substitutes and their market penetration. Finally, the report analyzes end-user trends and their impact on market demand.
- Market Share Analysis: Details the market share distribution amongst leading players, revealing the competitive intensity. For example, Company X holds xx% market share, while Company Y holds xx%.
- M&A Activity: Covers details on significant M&A activities within the industry during the 2019-2024 period, including deal values (e.g., a $xx million acquisition of Company A by Company B).
- Innovation Drivers: Highlights key drivers such as technological advancements leading to improved purity levels and efficiency gains.
- Regulatory Landscape: Examines existing regulations and their influence on market growth and technological innovations.
High Purity Cyanuric Chloride Industry Trends & Insights
This section delves into the dynamic landscape of the high-purity cyanuric chloride market, offering in-depth analysis of market growth drivers, technological advancements, evolving consumer preferences, and competitive dynamics. The report projects a Compound Annual Growth Rate (CAGR) of xx% for the forecast period (2025-2033), based on observed historical trends and anticipated market shifts. The analysis encompasses the market penetration of high-purity cyanuric chloride in key application segments, identifying areas with significant growth potential. The competitive dynamics are explored, highlighting strategies employed by major players, including product differentiation, pricing strategies, and market expansion initiatives. The impact of technological disruptions, such as advancements in synthesis methods and purification techniques, are also assessed.
Dominant Markets & Segments in High Purity Cyanuric Chloride
This section identifies the leading regions, countries, and segments within the high-purity cyanuric chloride market. It provides a comprehensive analysis of factors driving market dominance in these areas. Detailed analysis of the leading regions includes assessing economic conditions, infrastructure development, and government policies that support industry growth.
- Leading Region/Country: [Name of leading region/country] is identified as the dominant market, holding xx% of the global market share in 2025.
- Key Drivers:
- Economic Factors: Strong economic growth, robust industrial production, and favorable investment climate in [Region/Country].
- Infrastructure: Well-developed infrastructure supporting efficient manufacturing and distribution networks.
- Government Policies: Supportive government policies, including subsidies, tax incentives, and regulatory frameworks.
- Consumer Preferences: Growing demand driven by specific application segments and consumer preference for high-quality materials.
Detailed analysis of the dominance of the leading region/country, including market size projections, competitive landscape, and future growth outlook.
High Purity Cyanuric Chloride Product Developments
This section summarizes recent advancements in high-purity cyanuric chloride products, focusing on key innovations, applications, and their corresponding competitive advantages. This includes advancements in manufacturing technologies that enhance purity levels, efficiency, and cost-effectiveness. The analysis assesses the market fit of newly introduced products, considering factors such as pricing, performance, and regulatory compliance.
Report Scope & Segmentation Analysis
This report segments the high-purity cyanuric chloride market based on [List of segmentation criteria, e.g., purity level, application, end-use industry, region]. Each segment is analyzed individually, providing detailed market size projections, competitive dynamics, and growth forecasts for the forecast period (2025-2033). For example, the segment based on purity level (e.g., >99%, >99.5%, >99.9%) will present growth projections for each sub-segment. Similar analysis will be conducted for other segmentation criteria, highlighting the most promising segments based on growth potential.
Key Drivers of High Purity Cyanuric Chloride Growth
The growth of the high-purity cyanuric chloride market is propelled by a confluence of factors. Increasing demand from key application sectors such as [list key application sectors, e.g., pharmaceuticals, water treatment, and agrochemicals] is a primary driver. Technological advancements leading to improved production processes and enhanced product quality further stimulate market growth. Favorable government regulations and policies in certain regions also play a significant role. Finally, the growing awareness of the benefits of high-purity cyanuric chloride across various applications is contributing to the expansion of the market.
Challenges in the High Purity Cyanuric Chloride Sector
The high-purity cyanuric chloride market faces several challenges, including stringent regulatory requirements, fluctuations in raw material prices, intense competition from other players, and potential environmental concerns associated with its production and use. Supply chain disruptions and transportation costs can also impact market growth. The report quantifies the impact of these challenges on market dynamics, presenting estimates of potential revenue losses or growth limitations due to these factors. Addressing these challenges requires industry players to adopt strategic solutions such as supply chain diversification, cost optimization, and compliance with environmental regulations.
Emerging Opportunities in High Purity Cyanuric Chloride
The high-purity cyanuric chloride market presents several emerging opportunities. The growing adoption of high-purity cyanuric chloride in novel applications, such as [List emerging applications, e.g., advanced materials and specialized chemical synthesis], opens new avenues for market growth. Technological advancements enabling the production of even higher-purity products with enhanced properties create further opportunities. Expanding into emerging markets with growing demand for high-quality chemicals represents another significant growth opportunity.
Leading Players in the High Purity Cyanuric Chloride Market
- International Chemical Investors Group (ICIG)
- Lonza (Lonza)
- SimSon Pharma Limited
- Emco Dyestuff Pvt Ltd
- Ataman Kimya
- Hebei Chengxin Group
- Tiande Chemical
- TNJ Chemical
- Zaoyang Jinlu Chemical
- Cangzhou Lingang Yueguo Chemical
- Yingkou Sanzheng Organic Chemical
Key Developments in High Purity Cyanuric Chloride Industry
- [Month, Year]: Company X launched a new high-purity cyanuric chloride product with enhanced performance characteristics.
- [Month, Year]: Company Y announced a significant expansion of its production capacity to meet growing market demand.
- [Month, Year]: A major M&A deal involving Company A and Company B reshaped the competitive landscape. (Further details on the specifics of the deal should be included here.)
- [Month, Year]: New regulations impacting the production and handling of cyanuric chloride were introduced in [Region].
Strategic Outlook for High Purity Cyanuric Chloride Market
The high-purity cyanuric chloride market is poised for significant growth over the forecast period (2025-2033). Continued demand from established application sectors, coupled with the emergence of new applications, will fuel market expansion. Technological innovations, along with strategic initiatives by key players, will further drive growth. Addressing challenges related to regulations and supply chain management will be crucial for realizing the full market potential. The report concludes by providing strategic recommendations for companies operating in this market, offering insights into maximizing market opportunities and navigating potential challenges.
High Purity Cyanuric Chloride Segmentation
-
1. Application
- 1.1. Pesticides
- 1.2. Reactive Dyes
- 1.3. Others
-
2. Type
- 2.1. 99%
- 2.2. >99%
High Purity Cyanuric Chloride Segmentation By Geography
-
1. North America
- 1.1. United States
- 1.2. Canada
- 1.3. Mexico
-
2. South America
- 2.1. Brazil
- 2.2. Argentina
- 2.3. Rest of South America
-
3. Europe
- 3.1. United Kingdom
- 3.2. Germany
- 3.3. France
- 3.4. Italy
- 3.5. Spain
- 3.6. Russia
- 3.7. Benelux
- 3.8. Nordics
- 3.9. Rest of Europe
-
4. Middle East & Africa
- 4.1. Turkey
- 4.2. Israel
- 4.3. GCC
- 4.4. North Africa
- 4.5. South Africa
- 4.6. Rest of Middle East & Africa
-
5. Asia Pacific
- 5.1. China
- 5.2. India
- 5.3. Japan
- 5.4. South Korea
- 5.5. ASEAN
- 5.6. Oceania
- 5.7. Rest of Asia Pacific
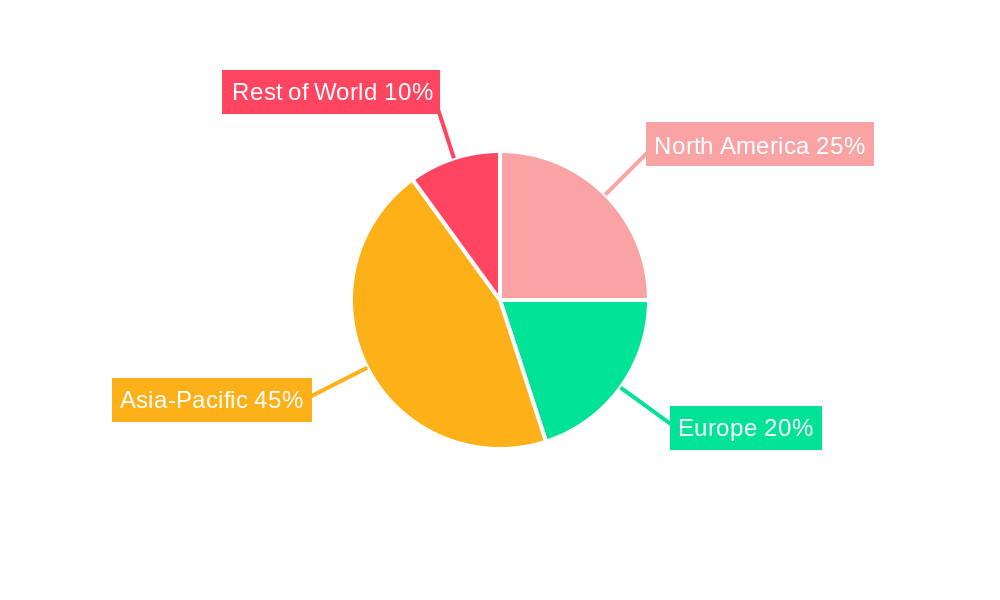
High Purity Cyanuric Chloride Regional Market Share
Geographic Coverage of High Purity Cyanuric Chloride
High Purity Cyanuric Chloride REPORT HIGHLIGHTS
| Aspects | Details |
|---|---|
| Study Period | 2020-2034 |
| Base Year | 2025 |
| Estimated Year | 2026 |
| Forecast Period | 2026-2034 |
| Historical Period | 2020-2025 |
| Growth Rate | CAGR of 3.2% from 2020-2034 |
| Segmentation |
|
Table of Contents
- 1. Introduction
- 1.1. Research Scope
- 1.2. Market Segmentation
- 1.3. Research Objective
- 1.4. Definitions and Assumptions
- 2. Executive Summary
- 2.1. Market Snapshot
- 3. Market Dynamics
- 3.1. Market Drivers
- 3.2. Market Restrains
- 3.3. Market Trends
- 3.4. Market Opportunities
- 4. Market Factor Analysis
- 4.1. Porters Five Forces
- 4.1.1. Bargaining Power of Suppliers
- 4.1.2. Bargaining Power of Buyers
- 4.1.3. Threat of New Entrants
- 4.1.4. Threat of Substitutes
- 4.1.5. Competitive Rivalry
- 4.2. PESTEL analysis
- 4.3. BCG Analysis
- 4.3.1. Stars (High Growth, High Market Share)
- 4.3.2. Cash Cows (Low Growth, High Market Share)
- 4.3.3. Question Mark (High Growth, Low Market Share)
- 4.3.4. Dogs (Low Growth, Low Market Share)
- 4.4. Ansoff Matrix Analysis
- 4.5. Supply Chain Analysis
- 4.6. Regulatory Landscape
- 4.7. Current Market Potential and Opportunity Assessment (TAM–SAM–SOM Framework)
- 4.8. RAX Analyst Note
- 4.1. Porters Five Forces
- 5. Market Analysis, Insights and Forecast 2021-2033
- 5.1. Market Analysis, Insights and Forecast - by Application
- 5.1.1. Pesticides
- 5.1.2. Reactive Dyes
- 5.1.3. Others
- 5.2. Market Analysis, Insights and Forecast - by Type
- 5.2.1. 99%
- 5.2.2. >99%
- 5.3. Market Analysis, Insights and Forecast - by Region
- 5.3.1. North America
- 5.3.2. South America
- 5.3.3. Europe
- 5.3.4. Middle East & Africa
- 5.3.5. Asia Pacific
- 5.1. Market Analysis, Insights and Forecast - by Application
- 6. Global High Purity Cyanuric Chloride Analysis, Insights and Forecast, 2021-2033
- 6.1. Market Analysis, Insights and Forecast - by Application
- 6.1.1. Pesticides
- 6.1.2. Reactive Dyes
- 6.1.3. Others
- 6.2. Market Analysis, Insights and Forecast - by Type
- 6.2.1. 99%
- 6.2.2. >99%
- 6.1. Market Analysis, Insights and Forecast - by Application
- 7. North America High Purity Cyanuric Chloride Analysis, Insights and Forecast, 2020-2032
- 7.1. Market Analysis, Insights and Forecast - by Application
- 7.1.1. Pesticides
- 7.1.2. Reactive Dyes
- 7.1.3. Others
- 7.2. Market Analysis, Insights and Forecast - by Type
- 7.2.1. 99%
- 7.2.2. >99%
- 7.1. Market Analysis, Insights and Forecast - by Application
- 8. South America High Purity Cyanuric Chloride Analysis, Insights and Forecast, 2020-2032
- 8.1. Market Analysis, Insights and Forecast - by Application
- 8.1.1. Pesticides
- 8.1.2. Reactive Dyes
- 8.1.3. Others
- 8.2. Market Analysis, Insights and Forecast - by Type
- 8.2.1. 99%
- 8.2.2. >99%
- 8.1. Market Analysis, Insights and Forecast - by Application
- 9. Europe High Purity Cyanuric Chloride Analysis, Insights and Forecast, 2020-2032
- 9.1. Market Analysis, Insights and Forecast - by Application
- 9.1.1. Pesticides
- 9.1.2. Reactive Dyes
- 9.1.3. Others
- 9.2. Market Analysis, Insights and Forecast - by Type
- 9.2.1. 99%
- 9.2.2. >99%
- 9.1. Market Analysis, Insights and Forecast - by Application
- 10. Middle East & Africa High Purity Cyanuric Chloride Analysis, Insights and Forecast, 2020-2032
- 10.1. Market Analysis, Insights and Forecast - by Application
- 10.1.1. Pesticides
- 10.1.2. Reactive Dyes
- 10.1.3. Others
- 10.2. Market Analysis, Insights and Forecast - by Type
- 10.2.1. 99%
- 10.2.2. >99%
- 10.1. Market Analysis, Insights and Forecast - by Application
- 11. Asia Pacific High Purity Cyanuric Chloride Analysis, Insights and Forecast, 2020-2032
- 11.1. Market Analysis, Insights and Forecast - by Application
- 11.1.1. Pesticides
- 11.1.2. Reactive Dyes
- 11.1.3. Others
- 11.2. Market Analysis, Insights and Forecast - by Type
- 11.2.1. 99%
- 11.2.2. >99%
- 11.1. Market Analysis, Insights and Forecast - by Application
- 12. Competitive Analysis
- 12.1. Company Profiles
- 12.1.1 International Chemical Investors Group(ICIG)
- 12.1.1.1. Company Overview
- 12.1.1.2. Products
- 12.1.1.3. Company Financials
- 12.1.1.4. SWOT Analysis
- 12.1.2 Lonza
- 12.1.2.1. Company Overview
- 12.1.2.2. Products
- 12.1.2.3. Company Financials
- 12.1.2.4. SWOT Analysis
- 12.1.3 SimSon Pharma Limited
- 12.1.3.1. Company Overview
- 12.1.3.2. Products
- 12.1.3.3. Company Financials
- 12.1.3.4. SWOT Analysis
- 12.1.4 Emco Dyestuff Pvt Ltd
- 12.1.4.1. Company Overview
- 12.1.4.2. Products
- 12.1.4.3. Company Financials
- 12.1.4.4. SWOT Analysis
- 12.1.5 Ataman Kimya
- 12.1.5.1. Company Overview
- 12.1.5.2. Products
- 12.1.5.3. Company Financials
- 12.1.5.4. SWOT Analysis
- 12.1.6 Hebei Chengxin Group
- 12.1.6.1. Company Overview
- 12.1.6.2. Products
- 12.1.6.3. Company Financials
- 12.1.6.4. SWOT Analysis
- 12.1.7 Tiande Chemical
- 12.1.7.1. Company Overview
- 12.1.7.2. Products
- 12.1.7.3. Company Financials
- 12.1.7.4. SWOT Analysis
- 12.1.8 TNJ Chemical
- 12.1.8.1. Company Overview
- 12.1.8.2. Products
- 12.1.8.3. Company Financials
- 12.1.8.4. SWOT Analysis
- 12.1.9 Zaoyang Jinlu Chemical
- 12.1.9.1. Company Overview
- 12.1.9.2. Products
- 12.1.9.3. Company Financials
- 12.1.9.4. SWOT Analysis
- 12.1.10 Cangzhou Lingang Yueguo Chemical
- 12.1.10.1. Company Overview
- 12.1.10.2. Products
- 12.1.10.3. Company Financials
- 12.1.10.4. SWOT Analysis
- 12.1.11 Yingkou Sanzheng Organic Chemical
- 12.1.11.1. Company Overview
- 12.1.11.2. Products
- 12.1.11.3. Company Financials
- 12.1.11.4. SWOT Analysis
- 12.1.1 International Chemical Investors Group(ICIG)
- 12.2. Market Entropy
- 12.2.1 Company's Key Areas Served
- 12.2.2 Recent Developments
- 12.3. Company Market Share Analysis 2025
- 12.3.1 Top 5 Companies Market Share Analysis
- 12.3.2 Top 3 Companies Market Share Analysis
- 12.4. List of Potential Customers
- 13. Research Methodology
List of Figures
- Figure 1: Global High Purity Cyanuric Chloride Revenue Breakdown (million, %) by Region 2025 & 2033
- Figure 2: North America High Purity Cyanuric Chloride Revenue (million), by Application 2025 & 2033
- Figure 3: North America High Purity Cyanuric Chloride Revenue Share (%), by Application 2025 & 2033
- Figure 4: North America High Purity Cyanuric Chloride Revenue (million), by Type 2025 & 2033
- Figure 5: North America High Purity Cyanuric Chloride Revenue Share (%), by Type 2025 & 2033
- Figure 6: North America High Purity Cyanuric Chloride Revenue (million), by Country 2025 & 2033
- Figure 7: North America High Purity Cyanuric Chloride Revenue Share (%), by Country 2025 & 2033
- Figure 8: South America High Purity Cyanuric Chloride Revenue (million), by Application 2025 & 2033
- Figure 9: South America High Purity Cyanuric Chloride Revenue Share (%), by Application 2025 & 2033
- Figure 10: South America High Purity Cyanuric Chloride Revenue (million), by Type 2025 & 2033
- Figure 11: South America High Purity Cyanuric Chloride Revenue Share (%), by Type 2025 & 2033
- Figure 12: South America High Purity Cyanuric Chloride Revenue (million), by Country 2025 & 2033
- Figure 13: South America High Purity Cyanuric Chloride Revenue Share (%), by Country 2025 & 2033
- Figure 14: Europe High Purity Cyanuric Chloride Revenue (million), by Application 2025 & 2033
- Figure 15: Europe High Purity Cyanuric Chloride Revenue Share (%), by Application 2025 & 2033
- Figure 16: Europe High Purity Cyanuric Chloride Revenue (million), by Type 2025 & 2033
- Figure 17: Europe High Purity Cyanuric Chloride Revenue Share (%), by Type 2025 & 2033
- Figure 18: Europe High Purity Cyanuric Chloride Revenue (million), by Country 2025 & 2033
- Figure 19: Europe High Purity Cyanuric Chloride Revenue Share (%), by Country 2025 & 2033
- Figure 20: Middle East & Africa High Purity Cyanuric Chloride Revenue (million), by Application 2025 & 2033
- Figure 21: Middle East & Africa High Purity Cyanuric Chloride Revenue Share (%), by Application 2025 & 2033
- Figure 22: Middle East & Africa High Purity Cyanuric Chloride Revenue (million), by Type 2025 & 2033
- Figure 23: Middle East & Africa High Purity Cyanuric Chloride Revenue Share (%), by Type 2025 & 2033
- Figure 24: Middle East & Africa High Purity Cyanuric Chloride Revenue (million), by Country 2025 & 2033
- Figure 25: Middle East & Africa High Purity Cyanuric Chloride Revenue Share (%), by Country 2025 & 2033
- Figure 26: Asia Pacific High Purity Cyanuric Chloride Revenue (million), by Application 2025 & 2033
- Figure 27: Asia Pacific High Purity Cyanuric Chloride Revenue Share (%), by Application 2025 & 2033
- Figure 28: Asia Pacific High Purity Cyanuric Chloride Revenue (million), by Type 2025 & 2033
- Figure 29: Asia Pacific High Purity Cyanuric Chloride Revenue Share (%), by Type 2025 & 2033
- Figure 30: Asia Pacific High Purity Cyanuric Chloride Revenue (million), by Country 2025 & 2033
- Figure 31: Asia Pacific High Purity Cyanuric Chloride Revenue Share (%), by Country 2025 & 2033
List of Tables
- Table 1: Global High Purity Cyanuric Chloride Revenue million Forecast, by Application 2020 & 2033
- Table 2: Global High Purity Cyanuric Chloride Revenue million Forecast, by Type 2020 & 2033
- Table 3: Global High Purity Cyanuric Chloride Revenue million Forecast, by Region 2020 & 2033
- Table 4: Global High Purity Cyanuric Chloride Revenue million Forecast, by Application 2020 & 2033
- Table 5: Global High Purity Cyanuric Chloride Revenue million Forecast, by Type 2020 & 2033
- Table 6: Global High Purity Cyanuric Chloride Revenue million Forecast, by Country 2020 & 2033
- Table 7: United States High Purity Cyanuric Chloride Revenue (million) Forecast, by Application 2020 & 2033
- Table 8: Canada High Purity Cyanuric Chloride Revenue (million) Forecast, by Application 2020 & 2033
- Table 9: Mexico High Purity Cyanuric Chloride Revenue (million) Forecast, by Application 2020 & 2033
- Table 10: Global High Purity Cyanuric Chloride Revenue million Forecast, by Application 2020 & 2033
- Table 11: Global High Purity Cyanuric Chloride Revenue million Forecast, by Type 2020 & 2033
- Table 12: Global High Purity Cyanuric Chloride Revenue million Forecast, by Country 2020 & 2033
- Table 13: Brazil High Purity Cyanuric Chloride Revenue (million) Forecast, by Application 2020 & 2033
- Table 14: Argentina High Purity Cyanuric Chloride Revenue (million) Forecast, by Application 2020 & 2033
- Table 15: Rest of South America High Purity Cyanuric Chloride Revenue (million) Forecast, by Application 2020 & 2033
- Table 16: Global High Purity Cyanuric Chloride Revenue million Forecast, by Application 2020 & 2033
- Table 17: Global High Purity Cyanuric Chloride Revenue million Forecast, by Type 2020 & 2033
- Table 18: Global High Purity Cyanuric Chloride Revenue million Forecast, by Country 2020 & 2033
- Table 19: United Kingdom High Purity Cyanuric Chloride Revenue (million) Forecast, by Application 2020 & 2033
- Table 20: Germany High Purity Cyanuric Chloride Revenue (million) Forecast, by Application 2020 & 2033
- Table 21: France High Purity Cyanuric Chloride Revenue (million) Forecast, by Application 2020 & 2033
- Table 22: Italy High Purity Cyanuric Chloride Revenue (million) Forecast, by Application 2020 & 2033
- Table 23: Spain High Purity Cyanuric Chloride Revenue (million) Forecast, by Application 2020 & 2033
- Table 24: Russia High Purity Cyanuric Chloride Revenue (million) Forecast, by Application 2020 & 2033
- Table 25: Benelux High Purity Cyanuric Chloride Revenue (million) Forecast, by Application 2020 & 2033
- Table 26: Nordics High Purity Cyanuric Chloride Revenue (million) Forecast, by Application 2020 & 2033
- Table 27: Rest of Europe High Purity Cyanuric Chloride Revenue (million) Forecast, by Application 2020 & 2033
- Table 28: Global High Purity Cyanuric Chloride Revenue million Forecast, by Application 2020 & 2033
- Table 29: Global High Purity Cyanuric Chloride Revenue million Forecast, by Type 2020 & 2033
- Table 30: Global High Purity Cyanuric Chloride Revenue million Forecast, by Country 2020 & 2033
- Table 31: Turkey High Purity Cyanuric Chloride Revenue (million) Forecast, by Application 2020 & 2033
- Table 32: Israel High Purity Cyanuric Chloride Revenue (million) Forecast, by Application 2020 & 2033
- Table 33: GCC High Purity Cyanuric Chloride Revenue (million) Forecast, by Application 2020 & 2033
- Table 34: North Africa High Purity Cyanuric Chloride Revenue (million) Forecast, by Application 2020 & 2033
- Table 35: South Africa High Purity Cyanuric Chloride Revenue (million) Forecast, by Application 2020 & 2033
- Table 36: Rest of Middle East & Africa High Purity Cyanuric Chloride Revenue (million) Forecast, by Application 2020 & 2033
- Table 37: Global High Purity Cyanuric Chloride Revenue million Forecast, by Application 2020 & 2033
- Table 38: Global High Purity Cyanuric Chloride Revenue million Forecast, by Type 2020 & 2033
- Table 39: Global High Purity Cyanuric Chloride Revenue million Forecast, by Country 2020 & 2033
- Table 40: China High Purity Cyanuric Chloride Revenue (million) Forecast, by Application 2020 & 2033
- Table 41: India High Purity Cyanuric Chloride Revenue (million) Forecast, by Application 2020 & 2033
- Table 42: Japan High Purity Cyanuric Chloride Revenue (million) Forecast, by Application 2020 & 2033
- Table 43: South Korea High Purity Cyanuric Chloride Revenue (million) Forecast, by Application 2020 & 2033
- Table 44: ASEAN High Purity Cyanuric Chloride Revenue (million) Forecast, by Application 2020 & 2033
- Table 45: Oceania High Purity Cyanuric Chloride Revenue (million) Forecast, by Application 2020 & 2033
- Table 46: Rest of Asia Pacific High Purity Cyanuric Chloride Revenue (million) Forecast, by Application 2020 & 2033
Frequently Asked Questions
1. What is the projected Compound Annual Growth Rate (CAGR) of the High Purity Cyanuric Chloride?
The projected CAGR is approximately 3.2%.
2. Which companies are prominent players in the High Purity Cyanuric Chloride?
Key companies in the market include International Chemical Investors Group(ICIG), Lonza, SimSon Pharma Limited, Emco Dyestuff Pvt Ltd, Ataman Kimya, Hebei Chengxin Group, Tiande Chemical, TNJ Chemical, Zaoyang Jinlu Chemical, Cangzhou Lingang Yueguo Chemical, Yingkou Sanzheng Organic Chemical.
3. What are the main segments of the High Purity Cyanuric Chloride?
The market segments include Application, Type.
4. Can you provide details about the market size?
The market size is estimated to be USD 330 million as of 2022.
5. What are some drivers contributing to market growth?
N/A
6. What are the notable trends driving market growth?
N/A
7. Are there any restraints impacting market growth?
N/A
8. Can you provide examples of recent developments in the market?
N/A
9. What pricing options are available for accessing the report?
Pricing options include single-user, multi-user, and enterprise licenses priced at USD 4250.00, USD 6375.00, and USD 8500.00 respectively.
10. Is the market size provided in terms of value or volume?
The market size is provided in terms of value, measured in million.
11. Are there any specific market keywords associated with the report?
Yes, the market keyword associated with the report is "High Purity Cyanuric Chloride," which aids in identifying and referencing the specific market segment covered.
12. How do I determine which pricing option suits my needs best?
The pricing options vary based on user requirements and access needs. Individual users may opt for single-user licenses, while businesses requiring broader access may choose multi-user or enterprise licenses for cost-effective access to the report.
13. Are there any additional resources or data provided in the High Purity Cyanuric Chloride report?
While the report offers comprehensive insights, it's advisable to review the specific contents or supplementary materials provided to ascertain if additional resources or data are available.
14. How can I stay updated on further developments or reports in the High Purity Cyanuric Chloride?
To stay informed about further developments, trends, and reports in the High Purity Cyanuric Chloride, consider subscribing to industry newsletters, following relevant companies and organizations, or regularly checking reputable industry news sources and publications.
Methodology
Step 1 - Identification of Relevant Samples Size from Population Database


Step 2 - Approaches for Defining Global Market Size (Value, Volume* & Price*)

Note*: In applicable scenarios
Step 3 - Data Sources
Primary Research
- Web Analytics
- Survey Reports
- Research Institute
- Latest Research Reports
- Opinion Leaders
Secondary Research
- Annual Reports
- White Paper
- Latest Press Release
- Industry Association
- Paid Database
- Investor Presentations

Step 4 - Data Triangulation
Involves using different sources of information in order to increase the validity of a study
These sources are likely to be stakeholders in a program - participants, other researchers, program staff, other community members, and so on.
Then we put all data in single framework & apply various statistical tools to find out the dynamic on the market.
During the analysis stage, feedback from the stakeholder groups would be compared to determine areas of agreement as well as areas of divergence

