

Key Insights
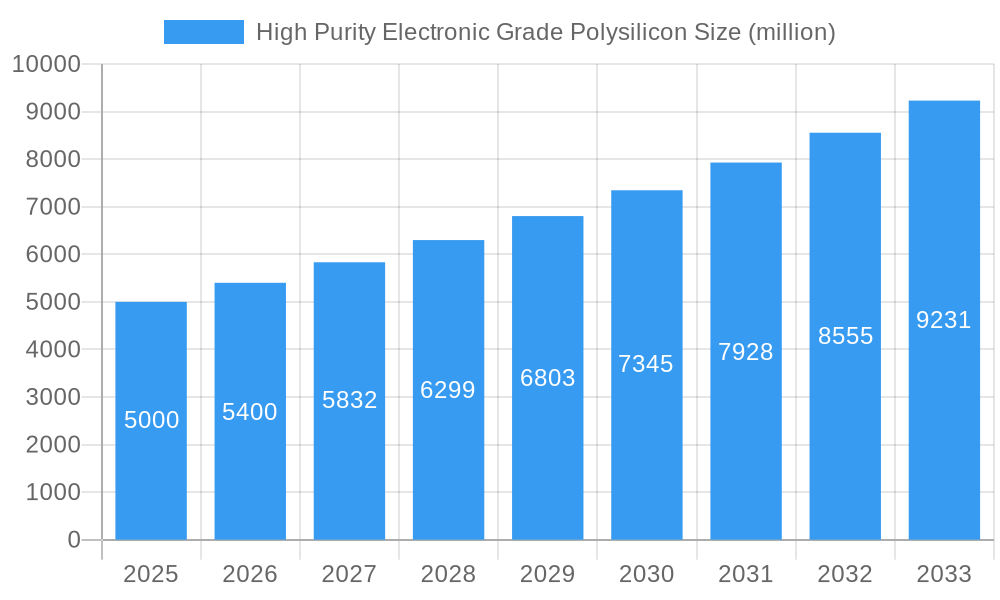
The High Purity Electronic Grade Polysilicon market is projected to experience substantial growth, driven by escalating demand for semiconductors across diverse electronic applications and the widespread adoption of solar photovoltaic (PV) systems. The market is valued at $49.44 billion in the base year 2025, with a projected Compound Annual Growth Rate (CAGR) of 11.6%. Key industry leaders such as Wacker Chemie, Tokuyama Corporation, and Hemlock Semiconductor currently command significant market share through advanced production capabilities and technological innovations. However, emerging players, particularly from China like GCL-Poly Energy and Daquan Energy, are intensifying competition and influencing pricing dynamics. Future expansion will be contingent upon advancements in polysilicon manufacturing for improved efficiency and cost reduction, coupled with the continued growth of the semiconductor and renewable energy sectors. Market participants must navigate the inherent cyclicality of semiconductor demand and potential supply chain vulnerabilities by implementing robust risk management strategies.
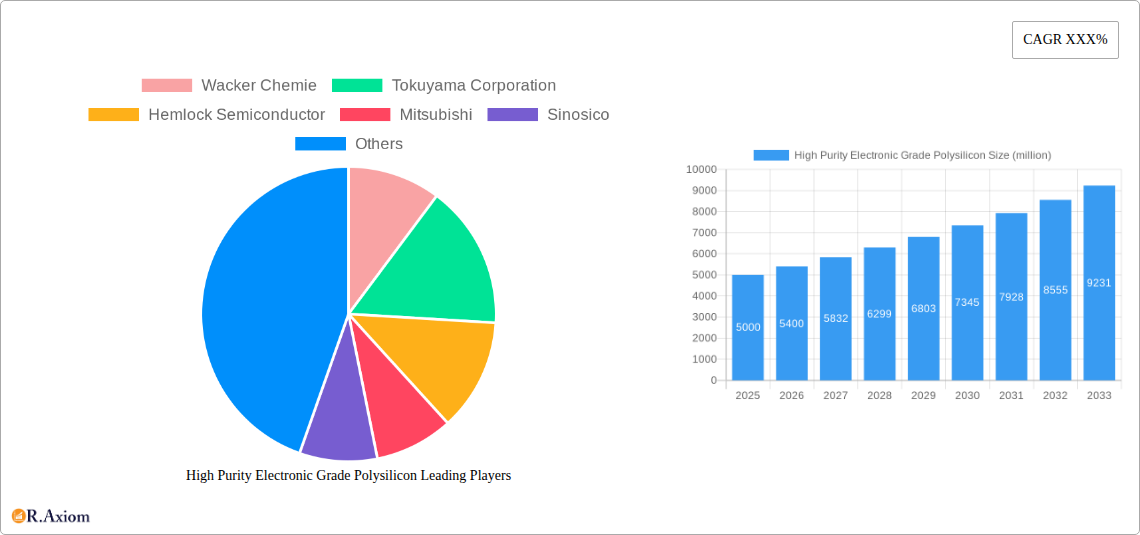
High Purity Electronic Grade Polysilicon Market Size (In Billion)
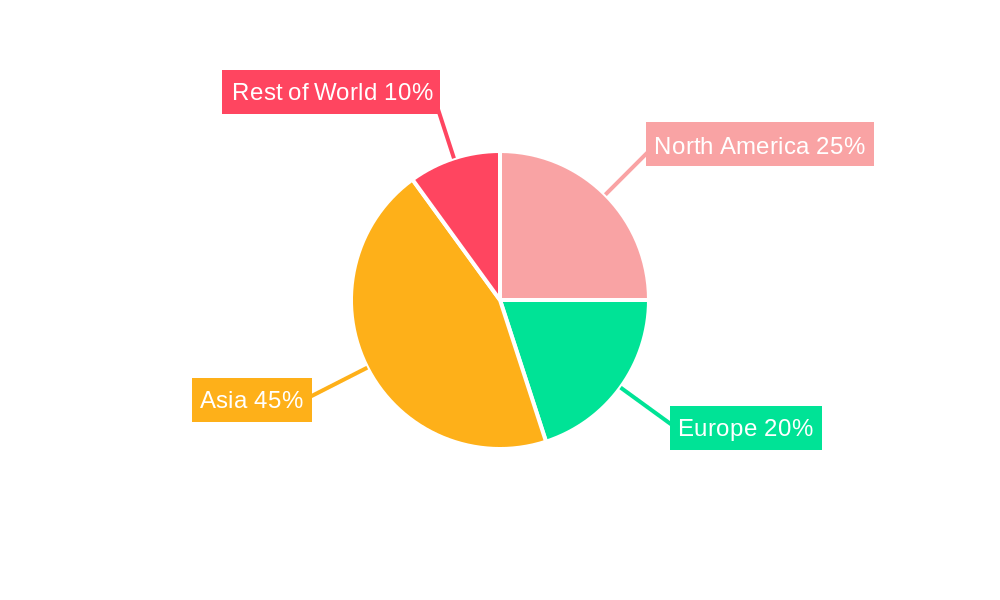
Regional market analysis indicates a pronounced concentration in East Asia, specifically China, owing to its expansive manufacturing infrastructure and substantial investments in renewable energy. North America and Europe also represent significant markets, fueled by robust demand from established semiconductor manufacturers and a strategic emphasis on domestic renewable energy development. Throughout the forecast period of 2025-2033, market expansion will be shaped by ongoing enhancements in polysilicon purity and production efficiency, alongside supportive government policies for renewable energy advancement. The competitive arena is expected to feature strategic collaborations and mergers and acquisitions, influencing future market trajectories. Continuous investment in research and development is paramount for companies seeking to maintain competitive advantages and leverage emerging market opportunities.
High Purity Electronic Grade Polysilicon Company Market Share
High Purity Electronic Grade Polysilicon Market Report: 2019-2033
This comprehensive report provides an in-depth analysis of the High Purity Electronic Grade Polysilicon market, offering valuable insights for industry stakeholders, investors, and strategic decision-makers. The study covers the period from 2019 to 2033, with 2025 as the base and estimated year. The forecast period extends from 2025 to 2033, while the historical period encompasses 2019-2024. The report analyzes market dynamics, competition, technological advancements, and future growth prospects, incorporating data on market size (in millions), CAGR, and market share.
High Purity Electronic Grade Polysilicon Market Concentration & Innovation
This section analyzes the competitive landscape of the High Purity Electronic Grade Polysilicon market, focusing on market concentration, innovation, regulatory influences, and market dynamics. The leading players, including Wacker Chemie, Tokuyama Corporation, Hemlock Semiconductor, Mitsubishi, Sinosico, GCL-Poly Energy, OCI, Huanghe Hydropower, Yichang CSG, REC Silicon, Daquan Energy, and Asia Silicon (Qinghai), contribute significantly to the overall market size. The report estimates the market concentration ratio (CRx) for the top 5 players to be approximately xx% in 2025, indicating a moderately concentrated market.
Key aspects analyzed:
- Market Share: Detailed breakdown of market share held by key players in 2025 and projected market share for 2033.
- Innovation Drivers: Analysis of R&D investments, technological breakthroughs (e.g., advancements in purification techniques), and the role of intellectual property in driving innovation.
- Regulatory Frameworks: Examination of environmental regulations, trade policies, and safety standards impacting the industry. This includes analysis of potential impact of carbon emission regulations on production costs and market dynamics.
- Product Substitutes: Assessment of potential substitutes and their impact on market growth and competitiveness.
- End-User Trends: Analysis of evolving demand from key end-use sectors like solar energy, semiconductors, and electronics.
- M&A Activities: Review of significant mergers and acquisitions (M&A) deals in the recent past, with analysis of deal values and their impact on market consolidation (e.g., xx million deal between Company X and Company Y in 2023).
High Purity Electronic Grade Polysilicon Industry Trends & Insights
This section explores the key trends shaping the High Purity Electronic Grade Polysilicon market. The report projects a CAGR of xx% during the forecast period (2025-2033), driven by factors such as increasing demand from the solar energy sector, technological advancements in semiconductor manufacturing, and rising global investments in renewable energy infrastructure.
Key trends and insights covered:
- Market Growth Drivers: In-depth analysis of factors driving market expansion, including the rising adoption of renewable energy sources (particularly solar power), growth of the electronics industry, and increasing government support for technological advancements.
- Technological Disruptions: Examination of emerging technologies impacting the production and applications of High Purity Electronic Grade Polysilicon, including advancements in metallurgical grade silicon (MGS) to UMG conversion techniques.
- Consumer Preferences: Analysis of evolving consumer demands and preferences for more sustainable and environmentally friendly products, pushing for greater adoption of renewable energy solutions.
- Competitive Dynamics: Evaluation of the intensity of competition among key players, including pricing strategies, product differentiation, and market positioning. The report assesses the competitive landscape across various geographical regions, highlighting areas of intense competition and opportunities for market entry.
Dominant Markets & Segments in High Purity Electronic Grade Polysilicon
This section identifies the leading regions and segments within the High Purity Electronic Grade Polysilicon market. The report indicates that xx region is the dominant market, accounting for xx% of the global market share in 2025. This dominance is attributed to factors including favorable government policies, robust infrastructure, and a strong presence of key players.
Key drivers of regional dominance:
- Economic Policies: Analysis of supportive government policies, including subsidies, tax incentives, and investment in renewable energy infrastructure.
- Infrastructure: Assessment of the availability of essential infrastructure, including power grids and transportation networks, which significantly impacts manufacturing costs and operations.
- Market Size and Growth: The report presents a detailed regional breakdown of market size and growth projections for the forecast period.
Detailed dominance analysis: This section presents an in-depth analysis of the leading region and its key characteristics that drive its dominant market position within the context of the global High Purity Electronic Grade Polysilicon market. This includes a comparative analysis with other regions and an exploration of the underlying factors driving market growth disparities.
High Purity Electronic Grade Polysilicon Product Developments
This section examines recent product innovations, application expansion, and competitive advantages within the High Purity Electronic Grade Polysilicon market. Recent advancements focus on improving purity levels and developing more cost-effective production processes. These innovations are crucial for meeting the growing demand from various end-use industries while maintaining competitiveness. The development of high-efficiency solar cells directly benefits from the enhanced purity of the polysilicon.
Report Scope & Segmentation Analysis
This report segments the High Purity Electronic Grade Polysilicon market based on several factors, including purity level, application (solar energy, semiconductors, etc.), and geography. Each segment's growth projections, market size, and competitive dynamics are analyzed. (Specific details about segments and projections will be detailed within the full report).
Key Drivers of High Purity Electronic Grade Polysilicon Growth
Growth in the High Purity Electronic Grade Polysilicon market is driven by several factors. The increasing adoption of renewable energy sources, particularly solar power, is a key driver. Government support for renewable energy initiatives further boosts demand. Advancements in semiconductor technology are also a major factor, as high-purity polysilicon is a critical material in semiconductor manufacturing.
Challenges in the High Purity Electronic Grade Polysilicon Sector
The High Purity Electronic Grade Polysilicon sector faces challenges such as high production costs, environmental concerns related to silicon production, and intense competition among key players. Supply chain disruptions and fluctuations in raw material prices can also impact profitability. The sector also faces fluctuating prices which are strongly correlated to the demand from end users.
Emerging Opportunities in High Purity Electronic Grade Polysilicon
Emerging opportunities include the expansion of the solar energy market into new regions and the development of more efficient and cost-effective polysilicon production techniques. The exploration of novel applications for high-purity polysilicon, such as in advanced electronics and specialized industrial applications, also presents exciting opportunities.
Leading Players in the High Purity Electronic Grade Polysilicon Market
- Wacker Chemie (Wacker Chemie)
- Tokuyama Corporation (Tokuyama Corporation)
- Hemlock Semiconductor (Hemlock Semiconductor)
- Mitsubishi (Mitsubishi)
- Sinosico
- GCL-Poly Energy
- OCI
- Huanghe Hydropower
- Yichang CSG
- REC Silicon
- Daquan Energy
- Asia Silicon (Qinghai)
Key Developments in High Purity Electronic Grade Polysilicon Industry
- 2022 Q4: Wacker Chemie announced a significant investment in expanding its polysilicon production capacity.
- 2023 Q1: Tokuyama Corporation unveiled a new technology for enhancing the purity of polysilicon.
- 2023 Q3: A joint venture between two major players resulted in the creation of a new polysilicon manufacturing facility. (Further details would be provided within the full report).
Strategic Outlook for High Purity Electronic Grade Polysilicon Market
The future of the High Purity Electronic Grade Polysilicon market looks promising, driven by ongoing growth in renewable energy and the electronics sector. Continued innovation in production technologies and exploration of new applications will further enhance market growth. The sector's focus on sustainability and environmental responsibility will play a key role in shaping its future development.
High Purity Electronic Grade Polysilicon Segmentation
-
1. Application
- 1.1. Integrated Circuit
- 1.2. Discrete Component
- 1.3. Other
-
2. Type
- 2.1. 9N
- 2.2. 10N
- 2.3. 11N
High Purity Electronic Grade Polysilicon Segmentation By Geography
-
1. North America
- 1.1. United States
- 1.2. Canada
- 1.3. Mexico
-
2. South America
- 2.1. Brazil
- 2.2. Argentina
- 2.3. Rest of South America
-
3. Europe
- 3.1. United Kingdom
- 3.2. Germany
- 3.3. France
- 3.4. Italy
- 3.5. Spain
- 3.6. Russia
- 3.7. Benelux
- 3.8. Nordics
- 3.9. Rest of Europe
-
4. Middle East & Africa
- 4.1. Turkey
- 4.2. Israel
- 4.3. GCC
- 4.4. North Africa
- 4.5. South Africa
- 4.6. Rest of Middle East & Africa
-
5. Asia Pacific
- 5.1. China
- 5.2. India
- 5.3. Japan
- 5.4. South Korea
- 5.5. ASEAN
- 5.6. Oceania
- 5.7. Rest of Asia Pacific
High Purity Electronic Grade Polysilicon Regional Market Share
Geographic Coverage of High Purity Electronic Grade Polysilicon
High Purity Electronic Grade Polysilicon REPORT HIGHLIGHTS
| Aspects | Details |
|---|---|
| Study Period | 2020-2034 |
| Base Year | 2025 |
| Estimated Year | 2026 |
| Forecast Period | 2026-2034 |
| Historical Period | 2020-2025 |
| Growth Rate | CAGR of 11.6% from 2020-2034 |
| Segmentation |
|
Table of Contents
- 1. Introduction
- 1.1. Research Scope
- 1.2. Market Segmentation
- 1.3. Research Objective
- 1.4. Definitions and Assumptions
- 2. Executive Summary
- 2.1. Market Snapshot
- 3. Market Dynamics
- 3.1. Market Drivers
- 3.2. Market Restrains
- 3.3. Market Trends
- 3.4. Market Opportunities
- 4. Market Factor Analysis
- 4.1. Porters Five Forces
- 4.1.1. Bargaining Power of Suppliers
- 4.1.2. Bargaining Power of Buyers
- 4.1.3. Threat of New Entrants
- 4.1.4. Threat of Substitutes
- 4.1.5. Competitive Rivalry
- 4.2. PESTEL analysis
- 4.3. BCG Analysis
- 4.3.1. Stars (High Growth, High Market Share)
- 4.3.2. Cash Cows (Low Growth, High Market Share)
- 4.3.3. Question Mark (High Growth, Low Market Share)
- 4.3.4. Dogs (Low Growth, Low Market Share)
- 4.4. Ansoff Matrix Analysis
- 4.5. Supply Chain Analysis
- 4.6. Regulatory Landscape
- 4.7. Current Market Potential and Opportunity Assessment (TAM–SAM–SOM Framework)
- 4.8. RAX Analyst Note
- 4.1. Porters Five Forces
- 5. Market Analysis, Insights and Forecast 2021-2033
- 5.1. Market Analysis, Insights and Forecast - by Application
- 5.1.1. Integrated Circuit
- 5.1.2. Discrete Component
- 5.1.3. Other
- 5.2. Market Analysis, Insights and Forecast - by Type
- 5.2.1. 9N
- 5.2.2. 10N
- 5.2.3. 11N
- 5.3. Market Analysis, Insights and Forecast - by Region
- 5.3.1. North America
- 5.3.2. South America
- 5.3.3. Europe
- 5.3.4. Middle East & Africa
- 5.3.5. Asia Pacific
- 5.1. Market Analysis, Insights and Forecast - by Application
- 6. Global High Purity Electronic Grade Polysilicon Analysis, Insights and Forecast, 2021-2033
- 6.1. Market Analysis, Insights and Forecast - by Application
- 6.1.1. Integrated Circuit
- 6.1.2. Discrete Component
- 6.1.3. Other
- 6.2. Market Analysis, Insights and Forecast - by Type
- 6.2.1. 9N
- 6.2.2. 10N
- 6.2.3. 11N
- 6.1. Market Analysis, Insights and Forecast - by Application
- 7. North America High Purity Electronic Grade Polysilicon Analysis, Insights and Forecast, 2020-2032
- 7.1. Market Analysis, Insights and Forecast - by Application
- 7.1.1. Integrated Circuit
- 7.1.2. Discrete Component
- 7.1.3. Other
- 7.2. Market Analysis, Insights and Forecast - by Type
- 7.2.1. 9N
- 7.2.2. 10N
- 7.2.3. 11N
- 7.1. Market Analysis, Insights and Forecast - by Application
- 8. South America High Purity Electronic Grade Polysilicon Analysis, Insights and Forecast, 2020-2032
- 8.1. Market Analysis, Insights and Forecast - by Application
- 8.1.1. Integrated Circuit
- 8.1.2. Discrete Component
- 8.1.3. Other
- 8.2. Market Analysis, Insights and Forecast - by Type
- 8.2.1. 9N
- 8.2.2. 10N
- 8.2.3. 11N
- 8.1. Market Analysis, Insights and Forecast - by Application
- 9. Europe High Purity Electronic Grade Polysilicon Analysis, Insights and Forecast, 2020-2032
- 9.1. Market Analysis, Insights and Forecast - by Application
- 9.1.1. Integrated Circuit
- 9.1.2. Discrete Component
- 9.1.3. Other
- 9.2. Market Analysis, Insights and Forecast - by Type
- 9.2.1. 9N
- 9.2.2. 10N
- 9.2.3. 11N
- 9.1. Market Analysis, Insights and Forecast - by Application
- 10. Middle East & Africa High Purity Electronic Grade Polysilicon Analysis, Insights and Forecast, 2020-2032
- 10.1. Market Analysis, Insights and Forecast - by Application
- 10.1.1. Integrated Circuit
- 10.1.2. Discrete Component
- 10.1.3. Other
- 10.2. Market Analysis, Insights and Forecast - by Type
- 10.2.1. 9N
- 10.2.2. 10N
- 10.2.3. 11N
- 10.1. Market Analysis, Insights and Forecast - by Application
- 11. Asia Pacific High Purity Electronic Grade Polysilicon Analysis, Insights and Forecast, 2020-2032
- 11.1. Market Analysis, Insights and Forecast - by Application
- 11.1.1. Integrated Circuit
- 11.1.2. Discrete Component
- 11.1.3. Other
- 11.2. Market Analysis, Insights and Forecast - by Type
- 11.2.1. 9N
- 11.2.2. 10N
- 11.2.3. 11N
- 11.1. Market Analysis, Insights and Forecast - by Application
- 12. Competitive Analysis
- 12.1. Company Profiles
- 12.1.1 Wacker Chemie
- 12.1.1.1. Company Overview
- 12.1.1.2. Products
- 12.1.1.3. Company Financials
- 12.1.1.4. SWOT Analysis
- 12.1.2 Tokuyama Corporation
- 12.1.2.1. Company Overview
- 12.1.2.2. Products
- 12.1.2.3. Company Financials
- 12.1.2.4. SWOT Analysis
- 12.1.3 Hemlock Semiconductor
- 12.1.3.1. Company Overview
- 12.1.3.2. Products
- 12.1.3.3. Company Financials
- 12.1.3.4. SWOT Analysis
- 12.1.4 Mitsubishi
- 12.1.4.1. Company Overview
- 12.1.4.2. Products
- 12.1.4.3. Company Financials
- 12.1.4.4. SWOT Analysis
- 12.1.5 Sinosico
- 12.1.5.1. Company Overview
- 12.1.5.2. Products
- 12.1.5.3. Company Financials
- 12.1.5.4. SWOT Analysis
- 12.1.6 GCL-Poly Energy
- 12.1.6.1. Company Overview
- 12.1.6.2. Products
- 12.1.6.3. Company Financials
- 12.1.6.4. SWOT Analysis
- 12.1.7 OCI
- 12.1.7.1. Company Overview
- 12.1.7.2. Products
- 12.1.7.3. Company Financials
- 12.1.7.4. SWOT Analysis
- 12.1.8 Huanghe Hydropower
- 12.1.8.1. Company Overview
- 12.1.8.2. Products
- 12.1.8.3. Company Financials
- 12.1.8.4. SWOT Analysis
- 12.1.9 Yichang CSG
- 12.1.9.1. Company Overview
- 12.1.9.2. Products
- 12.1.9.3. Company Financials
- 12.1.9.4. SWOT Analysis
- 12.1.10 REC Silicon
- 12.1.10.1. Company Overview
- 12.1.10.2. Products
- 12.1.10.3. Company Financials
- 12.1.10.4. SWOT Analysis
- 12.1.11 Daquan Energy
- 12.1.11.1. Company Overview
- 12.1.11.2. Products
- 12.1.11.3. Company Financials
- 12.1.11.4. SWOT Analysis
- 12.1.12 Asia Silicon (Qinghai)
- 12.1.12.1. Company Overview
- 12.1.12.2. Products
- 12.1.12.3. Company Financials
- 12.1.12.4. SWOT Analysis
- 12.1.1 Wacker Chemie
- 12.2. Market Entropy
- 12.2.1 Company's Key Areas Served
- 12.2.2 Recent Developments
- 12.3. Company Market Share Analysis 2025
- 12.3.1 Top 5 Companies Market Share Analysis
- 12.3.2 Top 3 Companies Market Share Analysis
- 12.4. List of Potential Customers
- 13. Research Methodology
List of Figures
- Figure 1: Global High Purity Electronic Grade Polysilicon Revenue Breakdown (billion, %) by Region 2025 & 2033
- Figure 2: North America High Purity Electronic Grade Polysilicon Revenue (billion), by Application 2025 & 2033
- Figure 3: North America High Purity Electronic Grade Polysilicon Revenue Share (%), by Application 2025 & 2033
- Figure 4: North America High Purity Electronic Grade Polysilicon Revenue (billion), by Type 2025 & 2033
- Figure 5: North America High Purity Electronic Grade Polysilicon Revenue Share (%), by Type 2025 & 2033
- Figure 6: North America High Purity Electronic Grade Polysilicon Revenue (billion), by Country 2025 & 2033
- Figure 7: North America High Purity Electronic Grade Polysilicon Revenue Share (%), by Country 2025 & 2033
- Figure 8: South America High Purity Electronic Grade Polysilicon Revenue (billion), by Application 2025 & 2033
- Figure 9: South America High Purity Electronic Grade Polysilicon Revenue Share (%), by Application 2025 & 2033
- Figure 10: South America High Purity Electronic Grade Polysilicon Revenue (billion), by Type 2025 & 2033
- Figure 11: South America High Purity Electronic Grade Polysilicon Revenue Share (%), by Type 2025 & 2033
- Figure 12: South America High Purity Electronic Grade Polysilicon Revenue (billion), by Country 2025 & 2033
- Figure 13: South America High Purity Electronic Grade Polysilicon Revenue Share (%), by Country 2025 & 2033
- Figure 14: Europe High Purity Electronic Grade Polysilicon Revenue (billion), by Application 2025 & 2033
- Figure 15: Europe High Purity Electronic Grade Polysilicon Revenue Share (%), by Application 2025 & 2033
- Figure 16: Europe High Purity Electronic Grade Polysilicon Revenue (billion), by Type 2025 & 2033
- Figure 17: Europe High Purity Electronic Grade Polysilicon Revenue Share (%), by Type 2025 & 2033
- Figure 18: Europe High Purity Electronic Grade Polysilicon Revenue (billion), by Country 2025 & 2033
- Figure 19: Europe High Purity Electronic Grade Polysilicon Revenue Share (%), by Country 2025 & 2033
- Figure 20: Middle East & Africa High Purity Electronic Grade Polysilicon Revenue (billion), by Application 2025 & 2033
- Figure 21: Middle East & Africa High Purity Electronic Grade Polysilicon Revenue Share (%), by Application 2025 & 2033
- Figure 22: Middle East & Africa High Purity Electronic Grade Polysilicon Revenue (billion), by Type 2025 & 2033
- Figure 23: Middle East & Africa High Purity Electronic Grade Polysilicon Revenue Share (%), by Type 2025 & 2033
- Figure 24: Middle East & Africa High Purity Electronic Grade Polysilicon Revenue (billion), by Country 2025 & 2033
- Figure 25: Middle East & Africa High Purity Electronic Grade Polysilicon Revenue Share (%), by Country 2025 & 2033
- Figure 26: Asia Pacific High Purity Electronic Grade Polysilicon Revenue (billion), by Application 2025 & 2033
- Figure 27: Asia Pacific High Purity Electronic Grade Polysilicon Revenue Share (%), by Application 2025 & 2033
- Figure 28: Asia Pacific High Purity Electronic Grade Polysilicon Revenue (billion), by Type 2025 & 2033
- Figure 29: Asia Pacific High Purity Electronic Grade Polysilicon Revenue Share (%), by Type 2025 & 2033
- Figure 30: Asia Pacific High Purity Electronic Grade Polysilicon Revenue (billion), by Country 2025 & 2033
- Figure 31: Asia Pacific High Purity Electronic Grade Polysilicon Revenue Share (%), by Country 2025 & 2033
List of Tables
- Table 1: Global High Purity Electronic Grade Polysilicon Revenue billion Forecast, by Application 2020 & 2033
- Table 2: Global High Purity Electronic Grade Polysilicon Revenue billion Forecast, by Type 2020 & 2033
- Table 3: Global High Purity Electronic Grade Polysilicon Revenue billion Forecast, by Region 2020 & 2033
- Table 4: Global High Purity Electronic Grade Polysilicon Revenue billion Forecast, by Application 2020 & 2033
- Table 5: Global High Purity Electronic Grade Polysilicon Revenue billion Forecast, by Type 2020 & 2033
- Table 6: Global High Purity Electronic Grade Polysilicon Revenue billion Forecast, by Country 2020 & 2033
- Table 7: United States High Purity Electronic Grade Polysilicon Revenue (billion) Forecast, by Application 2020 & 2033
- Table 8: Canada High Purity Electronic Grade Polysilicon Revenue (billion) Forecast, by Application 2020 & 2033
- Table 9: Mexico High Purity Electronic Grade Polysilicon Revenue (billion) Forecast, by Application 2020 & 2033
- Table 10: Global High Purity Electronic Grade Polysilicon Revenue billion Forecast, by Application 2020 & 2033
- Table 11: Global High Purity Electronic Grade Polysilicon Revenue billion Forecast, by Type 2020 & 2033
- Table 12: Global High Purity Electronic Grade Polysilicon Revenue billion Forecast, by Country 2020 & 2033
- Table 13: Brazil High Purity Electronic Grade Polysilicon Revenue (billion) Forecast, by Application 2020 & 2033
- Table 14: Argentina High Purity Electronic Grade Polysilicon Revenue (billion) Forecast, by Application 2020 & 2033
- Table 15: Rest of South America High Purity Electronic Grade Polysilicon Revenue (billion) Forecast, by Application 2020 & 2033
- Table 16: Global High Purity Electronic Grade Polysilicon Revenue billion Forecast, by Application 2020 & 2033
- Table 17: Global High Purity Electronic Grade Polysilicon Revenue billion Forecast, by Type 2020 & 2033
- Table 18: Global High Purity Electronic Grade Polysilicon Revenue billion Forecast, by Country 2020 & 2033
- Table 19: United Kingdom High Purity Electronic Grade Polysilicon Revenue (billion) Forecast, by Application 2020 & 2033
- Table 20: Germany High Purity Electronic Grade Polysilicon Revenue (billion) Forecast, by Application 2020 & 2033
- Table 21: France High Purity Electronic Grade Polysilicon Revenue (billion) Forecast, by Application 2020 & 2033
- Table 22: Italy High Purity Electronic Grade Polysilicon Revenue (billion) Forecast, by Application 2020 & 2033
- Table 23: Spain High Purity Electronic Grade Polysilicon Revenue (billion) Forecast, by Application 2020 & 2033
- Table 24: Russia High Purity Electronic Grade Polysilicon Revenue (billion) Forecast, by Application 2020 & 2033
- Table 25: Benelux High Purity Electronic Grade Polysilicon Revenue (billion) Forecast, by Application 2020 & 2033
- Table 26: Nordics High Purity Electronic Grade Polysilicon Revenue (billion) Forecast, by Application 2020 & 2033
- Table 27: Rest of Europe High Purity Electronic Grade Polysilicon Revenue (billion) Forecast, by Application 2020 & 2033
- Table 28: Global High Purity Electronic Grade Polysilicon Revenue billion Forecast, by Application 2020 & 2033
- Table 29: Global High Purity Electronic Grade Polysilicon Revenue billion Forecast, by Type 2020 & 2033
- Table 30: Global High Purity Electronic Grade Polysilicon Revenue billion Forecast, by Country 2020 & 2033
- Table 31: Turkey High Purity Electronic Grade Polysilicon Revenue (billion) Forecast, by Application 2020 & 2033
- Table 32: Israel High Purity Electronic Grade Polysilicon Revenue (billion) Forecast, by Application 2020 & 2033
- Table 33: GCC High Purity Electronic Grade Polysilicon Revenue (billion) Forecast, by Application 2020 & 2033
- Table 34: North Africa High Purity Electronic Grade Polysilicon Revenue (billion) Forecast, by Application 2020 & 2033
- Table 35: South Africa High Purity Electronic Grade Polysilicon Revenue (billion) Forecast, by Application 2020 & 2033
- Table 36: Rest of Middle East & Africa High Purity Electronic Grade Polysilicon Revenue (billion) Forecast, by Application 2020 & 2033
- Table 37: Global High Purity Electronic Grade Polysilicon Revenue billion Forecast, by Application 2020 & 2033
- Table 38: Global High Purity Electronic Grade Polysilicon Revenue billion Forecast, by Type 2020 & 2033
- Table 39: Global High Purity Electronic Grade Polysilicon Revenue billion Forecast, by Country 2020 & 2033
- Table 40: China High Purity Electronic Grade Polysilicon Revenue (billion) Forecast, by Application 2020 & 2033
- Table 41: India High Purity Electronic Grade Polysilicon Revenue (billion) Forecast, by Application 2020 & 2033
- Table 42: Japan High Purity Electronic Grade Polysilicon Revenue (billion) Forecast, by Application 2020 & 2033
- Table 43: South Korea High Purity Electronic Grade Polysilicon Revenue (billion) Forecast, by Application 2020 & 2033
- Table 44: ASEAN High Purity Electronic Grade Polysilicon Revenue (billion) Forecast, by Application 2020 & 2033
- Table 45: Oceania High Purity Electronic Grade Polysilicon Revenue (billion) Forecast, by Application 2020 & 2033
- Table 46: Rest of Asia Pacific High Purity Electronic Grade Polysilicon Revenue (billion) Forecast, by Application 2020 & 2033
Frequently Asked Questions
1. What is the projected Compound Annual Growth Rate (CAGR) of the High Purity Electronic Grade Polysilicon?
The projected CAGR is approximately 11.6%.
2. Which companies are prominent players in the High Purity Electronic Grade Polysilicon?
Key companies in the market include Wacker Chemie, Tokuyama Corporation, Hemlock Semiconductor, Mitsubishi, Sinosico, GCL-Poly Energy, OCI, Huanghe Hydropower, Yichang CSG, REC Silicon, Daquan Energy, Asia Silicon (Qinghai).
3. What are the main segments of the High Purity Electronic Grade Polysilicon?
The market segments include Application, Type.
4. Can you provide details about the market size?
The market size is estimated to be USD 49.44 billion as of 2022.
5. What are some drivers contributing to market growth?
N/A
6. What are the notable trends driving market growth?
N/A
7. Are there any restraints impacting market growth?
N/A
8. Can you provide examples of recent developments in the market?
N/A
9. What pricing options are available for accessing the report?
Pricing options include single-user, multi-user, and enterprise licenses priced at USD 2900.00, USD 4350.00, and USD 5800.00 respectively.
10. Is the market size provided in terms of value or volume?
The market size is provided in terms of value, measured in billion.
11. Are there any specific market keywords associated with the report?
Yes, the market keyword associated with the report is "High Purity Electronic Grade Polysilicon," which aids in identifying and referencing the specific market segment covered.
12. How do I determine which pricing option suits my needs best?
The pricing options vary based on user requirements and access needs. Individual users may opt for single-user licenses, while businesses requiring broader access may choose multi-user or enterprise licenses for cost-effective access to the report.
13. Are there any additional resources or data provided in the High Purity Electronic Grade Polysilicon report?
While the report offers comprehensive insights, it's advisable to review the specific contents or supplementary materials provided to ascertain if additional resources or data are available.
14. How can I stay updated on further developments or reports in the High Purity Electronic Grade Polysilicon?
To stay informed about further developments, trends, and reports in the High Purity Electronic Grade Polysilicon, consider subscribing to industry newsletters, following relevant companies and organizations, or regularly checking reputable industry news sources and publications.
Methodology
Step 1 - Identification of Relevant Samples Size from Population Database


Step 2 - Approaches for Defining Global Market Size (Value, Volume* & Price*)

Note*: In applicable scenarios
Step 3 - Data Sources
Primary Research
- Web Analytics
- Survey Reports
- Research Institute
- Latest Research Reports
- Opinion Leaders
Secondary Research
- Annual Reports
- White Paper
- Latest Press Release
- Industry Association
- Paid Database
- Investor Presentations

Step 4 - Data Triangulation
Involves using different sources of information in order to increase the validity of a study
These sources are likely to be stakeholders in a program - participants, other researchers, program staff, other community members, and so on.
Then we put all data in single framework & apply various statistical tools to find out the dynamic on the market.
During the analysis stage, feedback from the stakeholder groups would be compared to determine areas of agreement as well as areas of divergence