

Key Insights
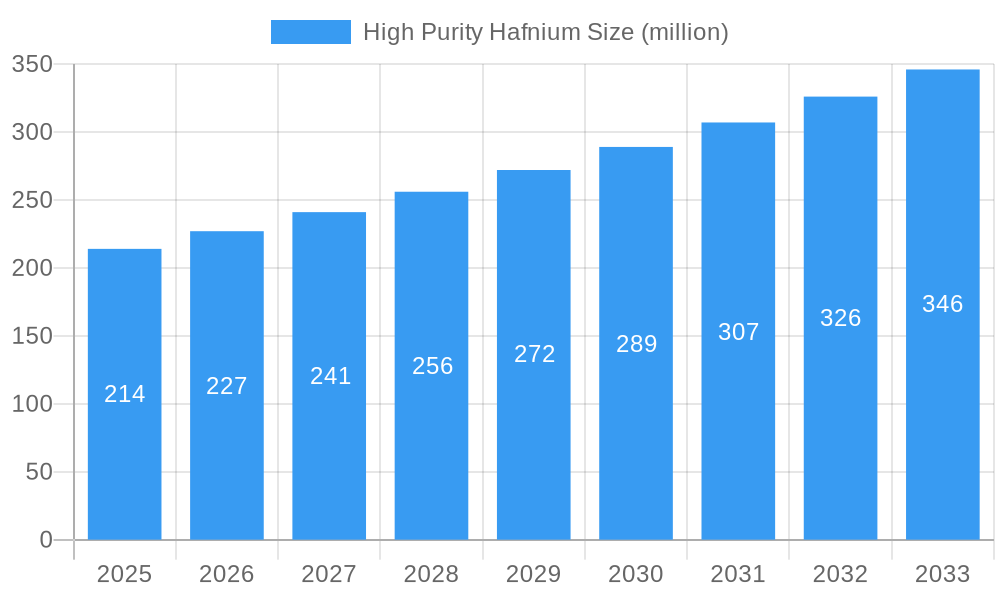
The high-purity hafnium market, currently valued at $214 million (2025), is projected to experience robust growth, driven by increasing demand from critical applications. A compound annual growth rate (CAGR) of 5.8% from 2025 to 2033 indicates a substantial market expansion. This growth is fueled by the material's unique properties, making it indispensable in nuclear reactors as control rods due to its exceptional neutron absorption capabilities. Furthermore, the burgeoning aerospace industry relies on high-purity hafnium for advanced alloys in jet engines and spacecraft components, demanding high thermal stability and corrosion resistance. Emerging applications in electronics, particularly in specialized capacitors and high-power electronics, contribute to the market's expansion. Key players like ATI, Chepetsky Mechanical Plant, Framatome, Australian Strategic Materials (ASM), CNNC Jinghuan, and Nanjing Youtian Metal are actively involved in meeting this growing demand, driving innovation and competition within the market.
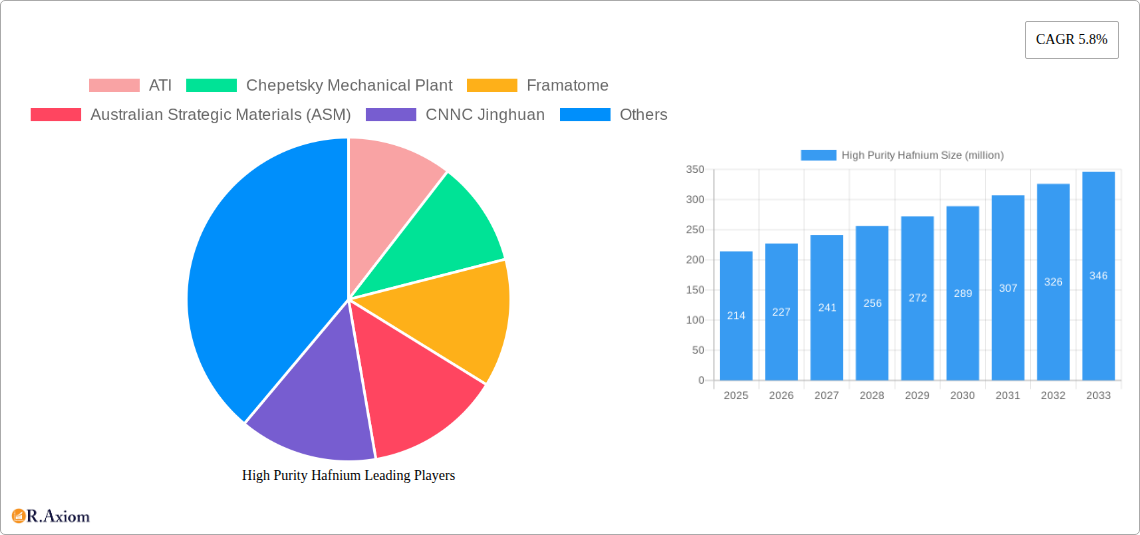
High Purity Hafnium Market Size (In Million)
The market's expansion is also influenced by governmental initiatives promoting the development of nuclear energy and aerospace technologies. However, the high cost of production and purification processes for high-purity hafnium remains a significant restraint, potentially limiting market penetration in certain sectors. Future market dynamics will likely depend on technological advancements in extraction and purification methods, making them more cost-effective and efficient. Moreover, stringent regulations surrounding the handling and disposal of nuclear materials, particularly in the context of nuclear reactor applications, present an additional layer of complexity and influence the market's trajectory. Overall, the high-purity hafnium market demonstrates strong growth potential, primarily driven by its essential role in critical industries.
High Purity Hafnium Company Market Share
High Purity Hafnium Market: A Comprehensive Forecast and Analysis (2019-2033)
This comprehensive report provides an in-depth analysis of the high purity hafnium market, offering invaluable insights for stakeholders across the value chain. Spanning the period from 2019 to 2033, with a focus on the base year 2025 and forecast period 2025-2033, this report leverages rigorous data analysis and expert insights to unveil crucial market trends and future growth opportunities. The report covers over $xx million in M&A activity and projects a CAGR of xx% over the forecast period.
High Purity Hafnium Market Concentration & Innovation
This section dissects the competitive landscape of the high purity hafnium market, examining market concentration, innovation drivers, regulatory frameworks, and market dynamics. The global high purity hafnium market is moderately concentrated, with key players such as ATI, Chepetsky Mechanical Plant, Framatome, Australian Strategic Materials (ASM), CNNC Jinghuan, and Nanjing Youtian Metal holding significant market share. The exact market share distribution for each player varies year-to-year and is a subject of the full report.
- Market Concentration: The Herfindahl-Hirschman Index (HHI) for the high purity hafnium market is estimated at xx in 2025, indicating a moderately concentrated market.
- Innovation Drivers: Ongoing research and development efforts focused on enhancing hafnium's purity levels and exploring new applications are key innovation drivers.
- Regulatory Frameworks: Government regulations concerning nuclear safety and environmental protection significantly impact the industry, particularly in relation to the sourcing and handling of hafnium.
- Product Substitutes: Limited viable substitutes exist for high purity hafnium in its primary applications, leading to a relatively inelastic demand.
- End-User Trends: The increasing demand from aerospace and nuclear industries is a major factor influencing market growth.
- M&A Activities: Over the historical period (2019-2024), M&A activity totaled over $xx million, driven by strategic expansion and consolidation efforts. The full report details specific deals and their impacts.
High Purity Hafnium Industry Trends & Insights
This section delves into the underlying trends shaping the high purity hafnium market. The market is driven by the increasing adoption of hafnium in advanced technologies, particularly within the aerospace and nuclear sectors. Technological advancements in hafnium purification processes are further enhancing its properties and broadening its applications. Consumer preferences for high-performance materials in diverse sectors such as electronics and medicine also contribute to market growth. Competitive dynamics are characterized by a mix of established players and emerging entrants, leading to innovation and price competition. The report details these trends with a granular view of the supply chain and production methodologies, along with specific CAGR figures and market penetration data by application and region.
Dominant Markets & Segments in High Purity Hafnium
The report identifies [Region/Country] as the dominant market for high purity hafnium. This dominance stems from several factors:
- Economic Policies: Supportive government policies, such as subsidies for the nuclear and aerospace industries, fuel demand.
- Infrastructure: Well-established infrastructure for production, processing, and transportation of hafnium contributes to the region's market leadership.
- Strong Industrial Base: A robust industrial sector using hafnium creates significant demand for the high purity variant.
The full report provides a detailed analysis of this regional dominance, along with a segmented view across various applications and end-use industries. It also covers other significant regional markets and their future growth potential.
High Purity Hafnium Product Developments
Recent years have witnessed significant advancements in high purity hafnium production techniques. These innovations focus on improving purity levels, enhancing material properties, and reducing production costs. New applications are emerging in specialized fields, strengthening the market's growth trajectory. The development of novel alloys and composites incorporating hafnium is also a key aspect of innovation in this space.
Report Scope & Segmentation Analysis
This report segments the high purity hafnium market based on purity level, application, and geography. Each segment's growth projections, market sizes, and competitive dynamics are analyzed in detail within the full report. The segments considered encompass various purity grades, diverse applications (including aerospace, nuclear, and electronics), and key geographic regions worldwide.
Key Drivers of High Purity Hafnium Growth
Growth in the high purity hafnium market is propelled by several key factors, including technological advancements improving production efficiency and enhancing hafnium's properties, economic growth fueling demand across various industries, and supportive government policies promoting the adoption of high-performance materials.
Challenges in the High Purity Hafnium Sector
The high purity hafnium sector faces challenges including the inherent complexity and high costs of production, potential supply chain disruptions, and intense competition from other high-performance materials. These factors influence market growth and price stability. The full report quantifies these impacts and assesses their long-term effects.
Emerging Opportunities in High Purity Hafnium
Emerging opportunities include the exploration of new applications for high purity hafnium in advanced technologies such as next-generation electronics and biomedical devices. Furthermore, improvements in production technologies and the potential for cost reductions present significant growth prospects.
Leading Players in the High Purity Hafnium Market
- ATI
- Chepetsky Mechanical Plant
- Framatome
- Australian Strategic Materials (ASM)
- CNNC Jinghuan
- Nanjing Youtian Metal
Key Developments in High Purity Hafnium Industry
- 2022 Q3: ATI announced a significant investment in expanding its high purity hafnium production capacity.
- 2023 Q1: A joint venture between Framatome and ASM was established to develop advanced hafnium alloys for nuclear applications.
- 2024 Q2: Nanjing Youtian Metal unveiled a new purification technology improving hafnium purity levels. (Further developments are detailed within the full report)
Strategic Outlook for High Purity Hafnium Market
The high purity hafnium market is poised for substantial growth over the forecast period, driven by technological advancements, rising demand from key industries, and supportive government policies. New applications and improved production methods will continue to shape market dynamics, creating significant opportunities for industry players. The full report offers detailed strategic recommendations for businesses operating in this dynamic sector.
High Purity Hafnium Segmentation
-
1. Application
- 1.1. Aerospace
- 1.2. Nuke Industry
- 1.3. Semiconductor
- 1.4. Others
-
2. Type
- 2.1. 2N
- 2.2. 3N
- 2.3. Others
High Purity Hafnium Segmentation By Geography
-
1. North America
- 1.1. United States
- 1.2. Canada
- 1.3. Mexico
-
2. South America
- 2.1. Brazil
- 2.2. Argentina
- 2.3. Rest of South America
-
3. Europe
- 3.1. United Kingdom
- 3.2. Germany
- 3.3. France
- 3.4. Italy
- 3.5. Spain
- 3.6. Russia
- 3.7. Benelux
- 3.8. Nordics
- 3.9. Rest of Europe
-
4. Middle East & Africa
- 4.1. Turkey
- 4.2. Israel
- 4.3. GCC
- 4.4. North Africa
- 4.5. South Africa
- 4.6. Rest of Middle East & Africa
-
5. Asia Pacific
- 5.1. China
- 5.2. India
- 5.3. Japan
- 5.4. South Korea
- 5.5. ASEAN
- 5.6. Oceania
- 5.7. Rest of Asia Pacific
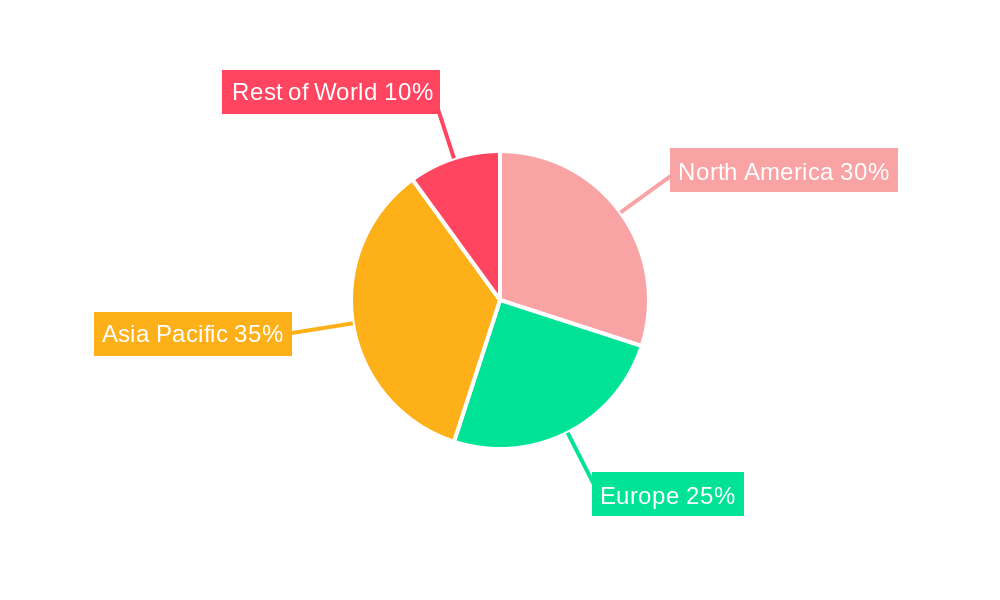
High Purity Hafnium Regional Market Share
Geographic Coverage of High Purity Hafnium
High Purity Hafnium REPORT HIGHLIGHTS
| Aspects | Details |
|---|---|
| Study Period | 2020-2034 |
| Base Year | 2025 |
| Estimated Year | 2026 |
| Forecast Period | 2026-2034 |
| Historical Period | 2020-2025 |
| Growth Rate | CAGR of 5.8% from 2020-2034 |
| Segmentation |
|
Table of Contents
- 1. Introduction
- 1.1. Research Scope
- 1.2. Market Segmentation
- 1.3. Research Objective
- 1.4. Definitions and Assumptions
- 2. Executive Summary
- 2.1. Market Snapshot
- 3. Market Dynamics
- 3.1. Market Drivers
- 3.2. Market Restrains
- 3.3. Market Trends
- 3.4. Market Opportunities
- 4. Market Factor Analysis
- 4.1. Porters Five Forces
- 4.1.1. Bargaining Power of Suppliers
- 4.1.2. Bargaining Power of Buyers
- 4.1.3. Threat of New Entrants
- 4.1.4. Threat of Substitutes
- 4.1.5. Competitive Rivalry
- 4.2. PESTEL analysis
- 4.3. BCG Analysis
- 4.3.1. Stars (High Growth, High Market Share)
- 4.3.2. Cash Cows (Low Growth, High Market Share)
- 4.3.3. Question Mark (High Growth, Low Market Share)
- 4.3.4. Dogs (Low Growth, Low Market Share)
- 4.4. Ansoff Matrix Analysis
- 4.5. Supply Chain Analysis
- 4.6. Regulatory Landscape
- 4.7. Current Market Potential and Opportunity Assessment (TAM–SAM–SOM Framework)
- 4.8. RAX Analyst Note
- 4.1. Porters Five Forces
- 5. Market Analysis, Insights and Forecast 2021-2033
- 5.1. Market Analysis, Insights and Forecast - by Application
- 5.1.1. Aerospace
- 5.1.2. Nuke Industry
- 5.1.3. Semiconductor
- 5.1.4. Others
- 5.2. Market Analysis, Insights and Forecast - by Type
- 5.2.1. 2N
- 5.2.2. 3N
- 5.2.3. Others
- 5.3. Market Analysis, Insights and Forecast - by Region
- 5.3.1. North America
- 5.3.2. South America
- 5.3.3. Europe
- 5.3.4. Middle East & Africa
- 5.3.5. Asia Pacific
- 5.1. Market Analysis, Insights and Forecast - by Application
- 6. Global High Purity Hafnium Analysis, Insights and Forecast, 2021-2033
- 6.1. Market Analysis, Insights and Forecast - by Application
- 6.1.1. Aerospace
- 6.1.2. Nuke Industry
- 6.1.3. Semiconductor
- 6.1.4. Others
- 6.2. Market Analysis, Insights and Forecast - by Type
- 6.2.1. 2N
- 6.2.2. 3N
- 6.2.3. Others
- 6.1. Market Analysis, Insights and Forecast - by Application
- 7. North America High Purity Hafnium Analysis, Insights and Forecast, 2020-2032
- 7.1. Market Analysis, Insights and Forecast - by Application
- 7.1.1. Aerospace
- 7.1.2. Nuke Industry
- 7.1.3. Semiconductor
- 7.1.4. Others
- 7.2. Market Analysis, Insights and Forecast - by Type
- 7.2.1. 2N
- 7.2.2. 3N
- 7.2.3. Others
- 7.1. Market Analysis, Insights and Forecast - by Application
- 8. South America High Purity Hafnium Analysis, Insights and Forecast, 2020-2032
- 8.1. Market Analysis, Insights and Forecast - by Application
- 8.1.1. Aerospace
- 8.1.2. Nuke Industry
- 8.1.3. Semiconductor
- 8.1.4. Others
- 8.2. Market Analysis, Insights and Forecast - by Type
- 8.2.1. 2N
- 8.2.2. 3N
- 8.2.3. Others
- 8.1. Market Analysis, Insights and Forecast - by Application
- 9. Europe High Purity Hafnium Analysis, Insights and Forecast, 2020-2032
- 9.1. Market Analysis, Insights and Forecast - by Application
- 9.1.1. Aerospace
- 9.1.2. Nuke Industry
- 9.1.3. Semiconductor
- 9.1.4. Others
- 9.2. Market Analysis, Insights and Forecast - by Type
- 9.2.1. 2N
- 9.2.2. 3N
- 9.2.3. Others
- 9.1. Market Analysis, Insights and Forecast - by Application
- 10. Middle East & Africa High Purity Hafnium Analysis, Insights and Forecast, 2020-2032
- 10.1. Market Analysis, Insights and Forecast - by Application
- 10.1.1. Aerospace
- 10.1.2. Nuke Industry
- 10.1.3. Semiconductor
- 10.1.4. Others
- 10.2. Market Analysis, Insights and Forecast - by Type
- 10.2.1. 2N
- 10.2.2. 3N
- 10.2.3. Others
- 10.1. Market Analysis, Insights and Forecast - by Application
- 11. Asia Pacific High Purity Hafnium Analysis, Insights and Forecast, 2020-2032
- 11.1. Market Analysis, Insights and Forecast - by Application
- 11.1.1. Aerospace
- 11.1.2. Nuke Industry
- 11.1.3. Semiconductor
- 11.1.4. Others
- 11.2. Market Analysis, Insights and Forecast - by Type
- 11.2.1. 2N
- 11.2.2. 3N
- 11.2.3. Others
- 11.1. Market Analysis, Insights and Forecast - by Application
- 12. Competitive Analysis
- 12.1. Company Profiles
- 12.1.1 ATI
- 12.1.1.1. Company Overview
- 12.1.1.2. Products
- 12.1.1.3. Company Financials
- 12.1.1.4. SWOT Analysis
- 12.1.2 Chepetsky Mechanical Plant
- 12.1.2.1. Company Overview
- 12.1.2.2. Products
- 12.1.2.3. Company Financials
- 12.1.2.4. SWOT Analysis
- 12.1.3 Framatome
- 12.1.3.1. Company Overview
- 12.1.3.2. Products
- 12.1.3.3. Company Financials
- 12.1.3.4. SWOT Analysis
- 12.1.4 Australian Strategic Materials (ASM)
- 12.1.4.1. Company Overview
- 12.1.4.2. Products
- 12.1.4.3. Company Financials
- 12.1.4.4. SWOT Analysis
- 12.1.5 CNNC Jinghuan
- 12.1.5.1. Company Overview
- 12.1.5.2. Products
- 12.1.5.3. Company Financials
- 12.1.5.4. SWOT Analysis
- 12.1.6 Nanjing Youtian Metal
- 12.1.6.1. Company Overview
- 12.1.6.2. Products
- 12.1.6.3. Company Financials
- 12.1.6.4. SWOT Analysis
- 12.1.1 ATI
- 12.2. Market Entropy
- 12.2.1 Company's Key Areas Served
- 12.2.2 Recent Developments
- 12.3. Company Market Share Analysis 2025
- 12.3.1 Top 5 Companies Market Share Analysis
- 12.3.2 Top 3 Companies Market Share Analysis
- 12.4. List of Potential Customers
- 13. Research Methodology
List of Figures
- Figure 1: Global High Purity Hafnium Revenue Breakdown (million, %) by Region 2025 & 2033
- Figure 2: North America High Purity Hafnium Revenue (million), by Application 2025 & 2033
- Figure 3: North America High Purity Hafnium Revenue Share (%), by Application 2025 & 2033
- Figure 4: North America High Purity Hafnium Revenue (million), by Type 2025 & 2033
- Figure 5: North America High Purity Hafnium Revenue Share (%), by Type 2025 & 2033
- Figure 6: North America High Purity Hafnium Revenue (million), by Country 2025 & 2033
- Figure 7: North America High Purity Hafnium Revenue Share (%), by Country 2025 & 2033
- Figure 8: South America High Purity Hafnium Revenue (million), by Application 2025 & 2033
- Figure 9: South America High Purity Hafnium Revenue Share (%), by Application 2025 & 2033
- Figure 10: South America High Purity Hafnium Revenue (million), by Type 2025 & 2033
- Figure 11: South America High Purity Hafnium Revenue Share (%), by Type 2025 & 2033
- Figure 12: South America High Purity Hafnium Revenue (million), by Country 2025 & 2033
- Figure 13: South America High Purity Hafnium Revenue Share (%), by Country 2025 & 2033
- Figure 14: Europe High Purity Hafnium Revenue (million), by Application 2025 & 2033
- Figure 15: Europe High Purity Hafnium Revenue Share (%), by Application 2025 & 2033
- Figure 16: Europe High Purity Hafnium Revenue (million), by Type 2025 & 2033
- Figure 17: Europe High Purity Hafnium Revenue Share (%), by Type 2025 & 2033
- Figure 18: Europe High Purity Hafnium Revenue (million), by Country 2025 & 2033
- Figure 19: Europe High Purity Hafnium Revenue Share (%), by Country 2025 & 2033
- Figure 20: Middle East & Africa High Purity Hafnium Revenue (million), by Application 2025 & 2033
- Figure 21: Middle East & Africa High Purity Hafnium Revenue Share (%), by Application 2025 & 2033
- Figure 22: Middle East & Africa High Purity Hafnium Revenue (million), by Type 2025 & 2033
- Figure 23: Middle East & Africa High Purity Hafnium Revenue Share (%), by Type 2025 & 2033
- Figure 24: Middle East & Africa High Purity Hafnium Revenue (million), by Country 2025 & 2033
- Figure 25: Middle East & Africa High Purity Hafnium Revenue Share (%), by Country 2025 & 2033
- Figure 26: Asia Pacific High Purity Hafnium Revenue (million), by Application 2025 & 2033
- Figure 27: Asia Pacific High Purity Hafnium Revenue Share (%), by Application 2025 & 2033
- Figure 28: Asia Pacific High Purity Hafnium Revenue (million), by Type 2025 & 2033
- Figure 29: Asia Pacific High Purity Hafnium Revenue Share (%), by Type 2025 & 2033
- Figure 30: Asia Pacific High Purity Hafnium Revenue (million), by Country 2025 & 2033
- Figure 31: Asia Pacific High Purity Hafnium Revenue Share (%), by Country 2025 & 2033
List of Tables
- Table 1: Global High Purity Hafnium Revenue million Forecast, by Application 2020 & 2033
- Table 2: Global High Purity Hafnium Revenue million Forecast, by Type 2020 & 2033
- Table 3: Global High Purity Hafnium Revenue million Forecast, by Region 2020 & 2033
- Table 4: Global High Purity Hafnium Revenue million Forecast, by Application 2020 & 2033
- Table 5: Global High Purity Hafnium Revenue million Forecast, by Type 2020 & 2033
- Table 6: Global High Purity Hafnium Revenue million Forecast, by Country 2020 & 2033
- Table 7: United States High Purity Hafnium Revenue (million) Forecast, by Application 2020 & 2033
- Table 8: Canada High Purity Hafnium Revenue (million) Forecast, by Application 2020 & 2033
- Table 9: Mexico High Purity Hafnium Revenue (million) Forecast, by Application 2020 & 2033
- Table 10: Global High Purity Hafnium Revenue million Forecast, by Application 2020 & 2033
- Table 11: Global High Purity Hafnium Revenue million Forecast, by Type 2020 & 2033
- Table 12: Global High Purity Hafnium Revenue million Forecast, by Country 2020 & 2033
- Table 13: Brazil High Purity Hafnium Revenue (million) Forecast, by Application 2020 & 2033
- Table 14: Argentina High Purity Hafnium Revenue (million) Forecast, by Application 2020 & 2033
- Table 15: Rest of South America High Purity Hafnium Revenue (million) Forecast, by Application 2020 & 2033
- Table 16: Global High Purity Hafnium Revenue million Forecast, by Application 2020 & 2033
- Table 17: Global High Purity Hafnium Revenue million Forecast, by Type 2020 & 2033
- Table 18: Global High Purity Hafnium Revenue million Forecast, by Country 2020 & 2033
- Table 19: United Kingdom High Purity Hafnium Revenue (million) Forecast, by Application 2020 & 2033
- Table 20: Germany High Purity Hafnium Revenue (million) Forecast, by Application 2020 & 2033
- Table 21: France High Purity Hafnium Revenue (million) Forecast, by Application 2020 & 2033
- Table 22: Italy High Purity Hafnium Revenue (million) Forecast, by Application 2020 & 2033
- Table 23: Spain High Purity Hafnium Revenue (million) Forecast, by Application 2020 & 2033
- Table 24: Russia High Purity Hafnium Revenue (million) Forecast, by Application 2020 & 2033
- Table 25: Benelux High Purity Hafnium Revenue (million) Forecast, by Application 2020 & 2033
- Table 26: Nordics High Purity Hafnium Revenue (million) Forecast, by Application 2020 & 2033
- Table 27: Rest of Europe High Purity Hafnium Revenue (million) Forecast, by Application 2020 & 2033
- Table 28: Global High Purity Hafnium Revenue million Forecast, by Application 2020 & 2033
- Table 29: Global High Purity Hafnium Revenue million Forecast, by Type 2020 & 2033
- Table 30: Global High Purity Hafnium Revenue million Forecast, by Country 2020 & 2033
- Table 31: Turkey High Purity Hafnium Revenue (million) Forecast, by Application 2020 & 2033
- Table 32: Israel High Purity Hafnium Revenue (million) Forecast, by Application 2020 & 2033
- Table 33: GCC High Purity Hafnium Revenue (million) Forecast, by Application 2020 & 2033
- Table 34: North Africa High Purity Hafnium Revenue (million) Forecast, by Application 2020 & 2033
- Table 35: South Africa High Purity Hafnium Revenue (million) Forecast, by Application 2020 & 2033
- Table 36: Rest of Middle East & Africa High Purity Hafnium Revenue (million) Forecast, by Application 2020 & 2033
- Table 37: Global High Purity Hafnium Revenue million Forecast, by Application 2020 & 2033
- Table 38: Global High Purity Hafnium Revenue million Forecast, by Type 2020 & 2033
- Table 39: Global High Purity Hafnium Revenue million Forecast, by Country 2020 & 2033
- Table 40: China High Purity Hafnium Revenue (million) Forecast, by Application 2020 & 2033
- Table 41: India High Purity Hafnium Revenue (million) Forecast, by Application 2020 & 2033
- Table 42: Japan High Purity Hafnium Revenue (million) Forecast, by Application 2020 & 2033
- Table 43: South Korea High Purity Hafnium Revenue (million) Forecast, by Application 2020 & 2033
- Table 44: ASEAN High Purity Hafnium Revenue (million) Forecast, by Application 2020 & 2033
- Table 45: Oceania High Purity Hafnium Revenue (million) Forecast, by Application 2020 & 2033
- Table 46: Rest of Asia Pacific High Purity Hafnium Revenue (million) Forecast, by Application 2020 & 2033
Frequently Asked Questions
1. What is the projected Compound Annual Growth Rate (CAGR) of the High Purity Hafnium?
The projected CAGR is approximately 5.8%.
2. Which companies are prominent players in the High Purity Hafnium?
Key companies in the market include ATI, Chepetsky Mechanical Plant, Framatome, Australian Strategic Materials (ASM), CNNC Jinghuan, Nanjing Youtian Metal.
3. What are the main segments of the High Purity Hafnium?
The market segments include Application, Type.
4. Can you provide details about the market size?
The market size is estimated to be USD 214 million as of 2022.
5. What are some drivers contributing to market growth?
N/A
6. What are the notable trends driving market growth?
N/A
7. Are there any restraints impacting market growth?
N/A
8. Can you provide examples of recent developments in the market?
N/A
9. What pricing options are available for accessing the report?
Pricing options include single-user, multi-user, and enterprise licenses priced at USD 4900.00, USD 7350.00, and USD 9800.00 respectively.
10. Is the market size provided in terms of value or volume?
The market size is provided in terms of value, measured in million.
11. Are there any specific market keywords associated with the report?
Yes, the market keyword associated with the report is "High Purity Hafnium," which aids in identifying and referencing the specific market segment covered.
12. How do I determine which pricing option suits my needs best?
The pricing options vary based on user requirements and access needs. Individual users may opt for single-user licenses, while businesses requiring broader access may choose multi-user or enterprise licenses for cost-effective access to the report.
13. Are there any additional resources or data provided in the High Purity Hafnium report?
While the report offers comprehensive insights, it's advisable to review the specific contents or supplementary materials provided to ascertain if additional resources or data are available.
14. How can I stay updated on further developments or reports in the High Purity Hafnium?
To stay informed about further developments, trends, and reports in the High Purity Hafnium, consider subscribing to industry newsletters, following relevant companies and organizations, or regularly checking reputable industry news sources and publications.
Methodology
Step 1 - Identification of Relevant Samples Size from Population Database


Step 2 - Approaches for Defining Global Market Size (Value, Volume* & Price*)

Note*: In applicable scenarios
Step 3 - Data Sources
Primary Research
- Web Analytics
- Survey Reports
- Research Institute
- Latest Research Reports
- Opinion Leaders
Secondary Research
- Annual Reports
- White Paper
- Latest Press Release
- Industry Association
- Paid Database
- Investor Presentations

Step 4 - Data Triangulation
Involves using different sources of information in order to increase the validity of a study
These sources are likely to be stakeholders in a program - participants, other researchers, program staff, other community members, and so on.
Then we put all data in single framework & apply various statistical tools to find out the dynamic on the market.
During the analysis stage, feedback from the stakeholder groups would be compared to determine areas of agreement as well as areas of divergence