High Purity Quartz Market Industry Insights and Forecasts

High Purity Quartz Market by Application (Semiconductor, Solar, Lighting, Telecom and Optics, Microelectronics, Others), by Asia Pacific (China, India, Japan, South Korea, Rest of Asia Pacific), by North America (United States, Canada, Mexico), by Europe (Germany, United Kingdom, Italy, France, Rest of Europe), by South America (Brazil, Argentina, Rest of South America), by Middle East and Africa (Saudi Arabia, South Africa, Rest of Middle East and Africa) Forecast 2025-2033

Aug 24 2025
Base Year: 2024

234 Pages
Main Logo

High Purity Quartz Market Industry Insights and Forecasts


Home
Industries
Chemicals & Materials
sponsor image
sponsor image
sponsor image
sponsor image

Tailored for you

  • In-depth Analysis Tailored to Specified Regions or Segments
  • Company Profiles Customized to User Preferences
  • Comprehensive Insights Focused on Specific Segments or Regions
  • Customized Evaluation of Competitive Landscape to Meet Your Needs
  • Tailored Customization to Address Other Specific Requirements
Ask for customization


Key Insights

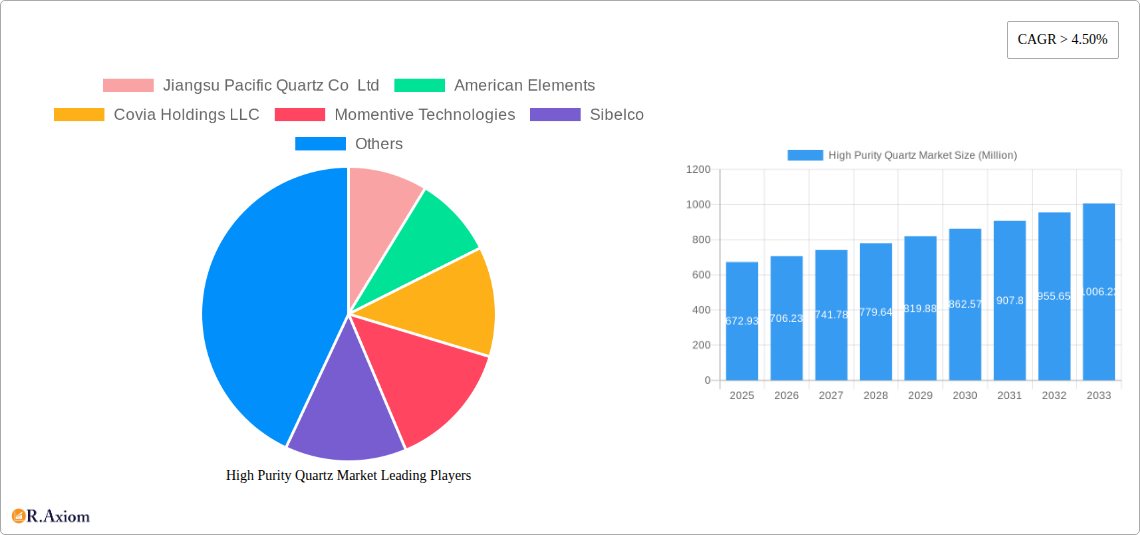
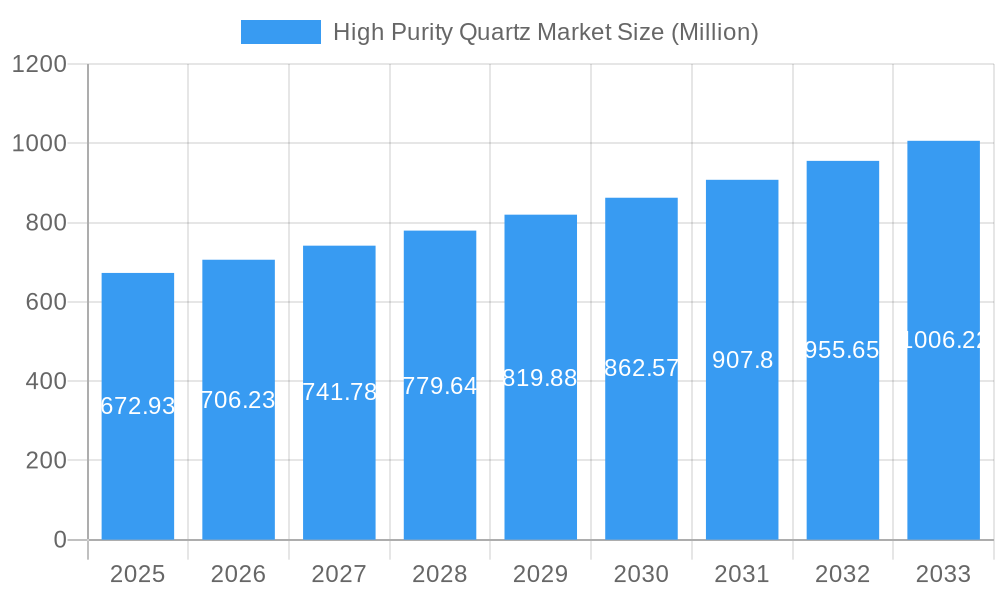
The high-purity quartz market, valued at $672.93 million in 2025, is projected to experience robust growth, exhibiting a compound annual growth rate (CAGR) exceeding 4.50% from 2025 to 2033. This expansion is fueled by the increasing demand from key application sectors. The semiconductor industry, a major driver, relies heavily on high-purity quartz for manufacturing crucial components like wafers and crucibles, necessitating high-quality materials for optimal performance and yield. Similarly, the solar energy sector's growth significantly contributes to market demand as high-purity quartz finds application in solar cells and panels, enhancing efficiency and durability. The lighting industry also utilizes this material for specialized lighting applications, further bolstering market growth. Technological advancements in materials science and manufacturing processes are further propelling the market forward, leading to improved purity levels and cost-effectiveness. However, the market faces some restraints, including the fluctuating prices of raw materials and the geographical concentration of production. Nevertheless, the long-term outlook remains positive due to ongoing technological improvements and the expanding applications across various industries.

The geographic distribution of the market reveals significant regional variations. North America and Asia-Pacific currently hold substantial market shares, driven by strong technological innovation and established manufacturing bases. However, emerging economies in Asia-Pacific and South America are expected to witness significant growth in the coming years due to increasing industrialization and rising investments in renewable energy. Competitive dynamics are characterized by the presence of both large multinational corporations and specialized regional players. Companies such as Jiangsu Pacific Quartz Co Ltd, American Elements, and others are actively engaged in expanding their production capacities and developing innovative products to cater to the growing demand. Strategic partnerships and mergers and acquisitions are likely to further shape the competitive landscape in the years to come.

High Purity Quartz Market Research Report - Market Size, Growth & Forecast

High Purity Quartz Market: A Comprehensive Report (2019-2033)

This comprehensive report provides a detailed analysis of the High Purity Quartz market, offering actionable insights for industry stakeholders. Covering the period 2019-2033, with a base year of 2025 and a forecast period of 2025-2033, this report analyzes market trends, competitive dynamics, and future growth potential. The global market size is projected to reach xx Million by 2033, exhibiting a CAGR of xx% during the forecast period.

High Purity Quartz Market Market Concentration & Innovation

The High Purity Quartz market exhibits a moderately concentrated structure, with a few major players holding significant market share. The top five companies—Jiangsu Pacific Quartz Co Ltd, American Elements, Covia Holdings LLC, Momentive Technologies, and Sibelco—collectively account for approximately xx% of the global market share in 2025. However, the market also includes several smaller regional players, particularly in regions like Australia and Russia. Innovation in the sector is primarily driven by the need for higher purity levels to meet the stringent requirements of advanced applications, especially in semiconductors and solar energy. Key areas of innovation include improving crystal growth techniques, developing advanced purification processes, and optimizing material properties for specific applications. Regulatory frameworks, such as those related to environmental protection and material safety, significantly influence market dynamics. Substitutes for high-purity quartz are limited due to its unique properties; however, some synthetic alternatives are emerging, though they are often more expensive. M&A activity has been moderate, with the most notable recent deal being Sibelco's USD 200 Million investment (detailed further in the Key Developments section). The average deal value for M&A activity in the past five years is estimated at xx Million. End-user trends are heavily influenced by technological advancements and the increasing demand for higher-performance electronic devices and renewable energy solutions.

High Purity Quartz Market Industry Trends & Insights

The High Purity Quartz market is experiencing robust growth, primarily fueled by the expanding semiconductor and solar energy industries. The increasing demand for advanced electronic devices and the global push for renewable energy sources are key market drivers. Technological disruptions, such as the development of new purification techniques and improved crystal growth methods, are constantly shaping the competitive landscape. Consumer preferences, especially in the electronics sector, emphasize miniaturization, higher efficiency, and improved performance, all of which necessitate the use of high-purity quartz. The market is highly competitive, with companies vying for market share through product innovation, technological advancements, and strategic partnerships. The market's growth is further impacted by fluctuations in raw material prices and global economic conditions. However, the long-term outlook remains positive, supported by continuous technological advancements and growing end-user demands. The market is expected to witness a CAGR of xx% during the forecast period, with market penetration rates in key segments showing significant increases.

High Purity Quartz Market Growth

Dominant Markets & Segments in High Purity Quartz Market

The semiconductor industry is the dominant segment within the high-purity quartz market, accounting for approximately xx% of the total market value in 2025. East Asia, particularly China and Japan, are the leading regions in terms of market size and growth, due to the substantial concentration of semiconductor manufacturing facilities.

  • Key Drivers in East Asia:
    • Strong government support for the semiconductor and solar industries.
    • Robust economic growth and substantial investments in infrastructure.
    • A large pool of skilled labor.
    • High demand from the electronics sector.

The solar industry is another significant segment, driven by the global transition to renewable energy. However, the semiconductor segment maintains its dominance due to the higher purity requirements and larger volume demand from the integrated circuit and other semiconductor manufacturing industries.

High Purity Quartz Market Product Developments

Recent product innovations focus on enhancing the purity levels and improving the crystal properties of high-purity quartz. This includes advancements in crystal growth techniques, such as the hydrothermal method, and refinement of purification processes to remove trace impurities. These developments directly impact the performance and reliability of end products, leading to improved market fit and competitive advantages for manufacturers capable of producing these superior materials. The trend is towards larger, more flawless crystals with consistently high purity levels.

Report Scope & Segmentation Analysis

The High Purity Quartz market is segmented by application:

  • Semiconductor: This segment is projected to witness substantial growth, driven by the ever-increasing demand for advanced semiconductor devices. Market size is estimated at xx Million in 2025, with a projected CAGR of xx% during the forecast period. The segment is highly competitive, with major players focusing on supply chain optimization and technological innovation to secure market share.

  • Solar: The solar industry is experiencing rapid growth, significantly impacting the demand for high-purity quartz in solar cell manufacturing. The market size for this segment is anticipated to be xx Million in 2025, with a projected CAGR of xx% driven by government policies promoting renewable energy and increasing energy demands.

  • Lighting: This segment encompasses various lighting applications, and while not as large as semiconductors or solar, still exhibits consistent growth due to increasing adoption of energy-efficient lighting technologies. Market size in 2025 is predicted to be xx Million.

  • Telecom and Optics: This segment shows steady growth, driven by the expansion of communication networks and advancements in optical fiber technology. The market size is approximately xx Million in 2025.

  • Microelectronics: This segment presents significant opportunities for high purity quartz due to its unique properties required in advanced microelectronic components. Market size in 2025 is anticipated at xx Million.

  • Others: This segment comprises various other applications of high-purity quartz, including specialized industrial applications. The market size in 2025 is approximately xx Million.

Key Drivers of High Purity Quartz Market Growth

The growth of the high-purity quartz market is primarily driven by technological advancements in semiconductor and solar energy industries. The need for higher purity levels in electronic devices and renewable energy solutions is a major factor. Furthermore, increasing government initiatives promoting renewable energy and technological innovation contribute significantly. The strong economic growth in several regions, coupled with rising disposable income, drives consumer demand for technologically advanced devices, further fueling market growth.

Challenges in the High Purity Quartz Market Sector

The high-purity quartz market faces challenges, including the volatile price of raw materials, stringent regulatory requirements for environmental protection, and the complex supply chain. These factors can significantly impact production costs and profitability. The market also faces competitive pressure from the emergence of substitute materials, although they often lack the superior properties of high-purity quartz. These factors collectively constrain market growth and pose significant challenges for market participants.

Emerging Opportunities in High Purity Quartz Market

Emerging opportunities lie in the development of new applications for high-purity quartz, such as advanced sensors and specialized optical devices. The increasing demand for high-purity quartz in the 5G infrastructure and space exploration technologies presents significant growth potential. Moreover, innovations in crystal growth and purification techniques could unlock new markets and enhance existing applications, thus creating further opportunities for growth.

Leading Players in the High Purity Quartz Market Market

  • Jiangsu Pacific Quartz Co Ltd
  • American Elements
  • Covia Holdings LLC
  • Momentive Technologies
  • Sibelco
  • Imerys
  • ULTRA HPQ
  • Russian Quartz LLC
  • Australian Silica Quartz Group Ltd
  • The Quartz Corp

Key Developments in High Purity Quartz Market Industry

  • April 2023: Sibelco announced an investment of approximately USD 200 Million to double its high-purity quartz installed capacity at its Spruce Pine facility in North Carolina, United States. This significant investment signifies the company's commitment to expanding its production capacity to meet the growing market demand and underscores the robust growth potential of the high-purity quartz market.

Strategic Outlook for High Purity Quartz Market Market

The high-purity quartz market is poised for continued growth, driven by sustained demand from the semiconductor and solar energy sectors, alongside the emergence of novel applications. Technological innovations in production processes and the development of higher-purity materials are likely to further fuel market expansion. Companies that successfully navigate the challenges of raw material volatility and regulatory compliance while strategically investing in research and development are likely to secure a competitive advantage and capture significant market share in the years to come.

High Purity Quartz Market Segmentation

  • 1. Application
    • 1.1. Semiconductor
    • 1.2. Solar
    • 1.3. Lighting
    • 1.4. Telecom and Optics
    • 1.5. Microelectronics
    • 1.6. Others

High Purity Quartz Market Segmentation By Geography

  • 1. Asia Pacific
    • 1.1. China
    • 1.2. India
    • 1.3. Japan
    • 1.4. South Korea
    • 1.5. Rest of Asia Pacific
  • 2. North America
    • 2.1. United States
    • 2.2. Canada
    • 2.3. Mexico
  • 3. Europe
    • 3.1. Germany
    • 3.2. United Kingdom
    • 3.3. Italy
    • 3.4. France
    • 3.5. Rest of Europe
  • 4. South America
    • 4.1. Brazil
    • 4.2. Argentina
    • 4.3. Rest of South America
  • 5. Middle East and Africa
    • 5.1. Saudi Arabia
    • 5.2. South Africa
    • 5.3. Rest of Middle East and Africa
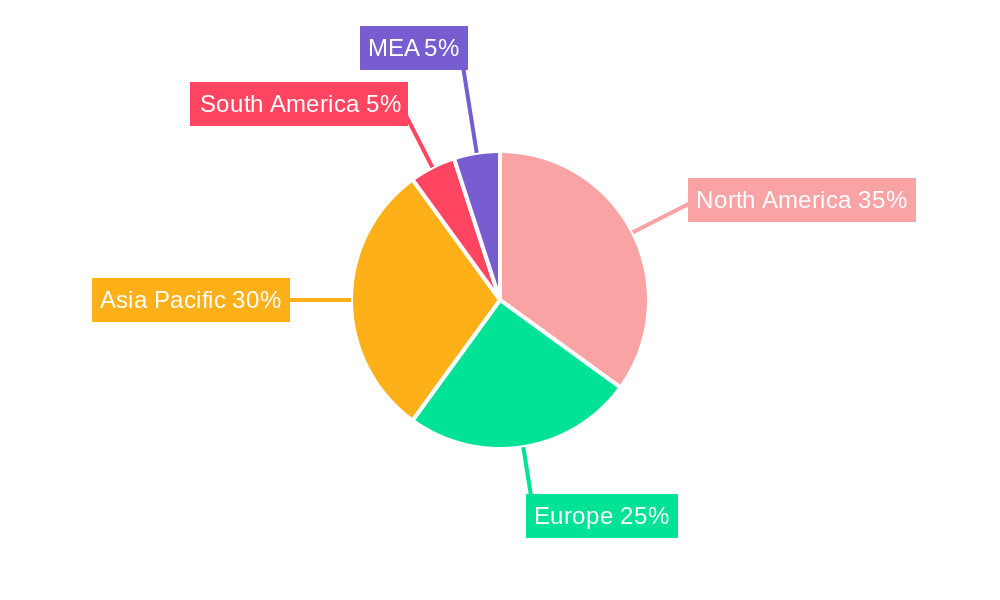
High Purity Quartz Market Regional Share


High Purity Quartz Market REPORT HIGHLIGHTS

AspectsDetails
Study Period 2019-2033
Base Year 2024
Estimated Year 2025
Forecast Period2025-2033
Historical Period2019-2024
Growth RateCAGR of > 4.50% from 2019-2033
Segmentation
    • By Application
      • Semiconductor
      • Solar
      • Lighting
      • Telecom and Optics
      • Microelectronics
      • Others
  • By Geography
    • Asia Pacific
      • China
      • India
      • Japan
      • South Korea
      • Rest of Asia Pacific
    • North America
      • United States
      • Canada
      • Mexico
    • Europe
      • Germany
      • United Kingdom
      • Italy
      • France
      • Rest of Europe
    • South America
      • Brazil
      • Argentina
      • Rest of South America
    • Middle East and Africa
      • Saudi Arabia
      • South Africa
      • Rest of Middle East and Africa


Table of Contents

  1. 1. Introduction
    • 1.1. Research Scope
    • 1.2. Market Segmentation
    • 1.3. Research Methodology
    • 1.4. Definitions and Assumptions
  2. 2. Executive Summary
    • 2.1. Introduction
  3. 3. Market Dynamics
    • 3.1. Introduction
      • 3.2. Market Drivers
        • 3.2.1. Growing Demand for Semiconductor ICs; Increasing Adoption in Solar Industry; Other Drivers
      • 3.3. Market Restrains
        • 3.3.1. The Fluctuating Prices of Raw Materials; Other Restraints
      • 3.4. Market Trends
        • 3.4.1. Growing Demand from Semiconductor Industry
  4. 4. Market Factor Analysis
    • 4.1. Porters Five Forces
    • 4.2. Supply/Value Chain
    • 4.3. PESTEL analysis
    • 4.4. Market Entropy
    • 4.5. Patent/Trademark Analysis
  5. 5. Global High Purity Quartz Market Analysis, Insights and Forecast, 2019-2031
    • 5.1. Market Analysis, Insights and Forecast - by Application
      • 5.1.1. Semiconductor
      • 5.1.2. Solar
      • 5.1.3. Lighting
      • 5.1.4. Telecom and Optics
      • 5.1.5. Microelectronics
      • 5.1.6. Others
    • 5.2. Market Analysis, Insights and Forecast - by Region
      • 5.2.1. Asia Pacific
      • 5.2.2. North America
      • 5.2.3. Europe
      • 5.2.4. South America
      • 5.2.5. Middle East and Africa
  6. 6. Asia Pacific High Purity Quartz Market Analysis, Insights and Forecast, 2019-2031
    • 6.1. Market Analysis, Insights and Forecast - by Application
      • 6.1.1. Semiconductor
      • 6.1.2. Solar
      • 6.1.3. Lighting
      • 6.1.4. Telecom and Optics
      • 6.1.5. Microelectronics
      • 6.1.6. Others
  7. 7. North America High Purity Quartz Market Analysis, Insights and Forecast, 2019-2031
    • 7.1. Market Analysis, Insights and Forecast - by Application
      • 7.1.1. Semiconductor
      • 7.1.2. Solar
      • 7.1.3. Lighting
      • 7.1.4. Telecom and Optics
      • 7.1.5. Microelectronics
      • 7.1.6. Others
  8. 8. Europe High Purity Quartz Market Analysis, Insights and Forecast, 2019-2031
    • 8.1. Market Analysis, Insights and Forecast - by Application
      • 8.1.1. Semiconductor
      • 8.1.2. Solar
      • 8.1.3. Lighting
      • 8.1.4. Telecom and Optics
      • 8.1.5. Microelectronics
      • 8.1.6. Others
  9. 9. South America High Purity Quartz Market Analysis, Insights and Forecast, 2019-2031
    • 9.1. Market Analysis, Insights and Forecast - by Application
      • 9.1.1. Semiconductor
      • 9.1.2. Solar
      • 9.1.3. Lighting
      • 9.1.4. Telecom and Optics
      • 9.1.5. Microelectronics
      • 9.1.6. Others
  10. 10. Middle East and Africa High Purity Quartz Market Analysis, Insights and Forecast, 2019-2031
    • 10.1. Market Analysis, Insights and Forecast - by Application
      • 10.1.1. Semiconductor
      • 10.1.2. Solar
      • 10.1.3. Lighting
      • 10.1.4. Telecom and Optics
      • 10.1.5. Microelectronics
      • 10.1.6. Others
  11. 11. North America High Purity Quartz Market Analysis, Insights and Forecast, 2019-2031
      • 11.1. Market Analysis, Insights and Forecast - By Country/Sub-region
        • 11.1.1 United States
        • 11.1.2 Canada
        • 11.1.3 Mexico
  12. 12. Europe High Purity Quartz Market Analysis, Insights and Forecast, 2019-2031
      • 12.1. Market Analysis, Insights and Forecast - By Country/Sub-region
        • 12.1.1 Germany
        • 12.1.2 France
        • 12.1.3 Italy
        • 12.1.4 United Kingdom
        • 12.1.5 Netherlands
        • 12.1.6 Rest of Europe
  13. 13. Asia Pacific High Purity Quartz Market Analysis, Insights and Forecast, 2019-2031
      • 13.1. Market Analysis, Insights and Forecast - By Country/Sub-region
        • 13.1.1 China
        • 13.1.2 Japan
        • 13.1.3 India
        • 13.1.4 South Korea
        • 13.1.5 Taiwan
        • 13.1.6 Australia
        • 13.1.7 Rest of Asia-Pacific
  14. 14. South America High Purity Quartz Market Analysis, Insights and Forecast, 2019-2031
      • 14.1. Market Analysis, Insights and Forecast - By Country/Sub-region
        • 14.1.1 Brazil
        • 14.1.2 Argentina
        • 14.1.3 Rest of South America
  15. 15. MEA High Purity Quartz Market Analysis, Insights and Forecast, 2019-2031
      • 15.1. Market Analysis, Insights and Forecast - By Country/Sub-region
        • 15.1.1 Middle East
        • 15.1.2 Africa
  16. 16. Competitive Analysis
    • 16.1. Global Market Share Analysis 2024
      • 16.2. Company Profiles
        • 16.2.1 Jiangsu Pacific Quartz Co Ltd
          • 16.2.1.1. Overview
          • 16.2.1.2. Products
          • 16.2.1.3. SWOT Analysis
          • 16.2.1.4. Recent Developments
          • 16.2.1.5. Financials (Based on Availability)
        • 16.2.2 American Elements
          • 16.2.2.1. Overview
          • 16.2.2.2. Products
          • 16.2.2.3. SWOT Analysis
          • 16.2.2.4. Recent Developments
          • 16.2.2.5. Financials (Based on Availability)
        • 16.2.3 Covia Holdings LLC
          • 16.2.3.1. Overview
          • 16.2.3.2. Products
          • 16.2.3.3. SWOT Analysis
          • 16.2.3.4. Recent Developments
          • 16.2.3.5. Financials (Based on Availability)
        • 16.2.4 Momentive Technologies
          • 16.2.4.1. Overview
          • 16.2.4.2. Products
          • 16.2.4.3. SWOT Analysis
          • 16.2.4.4. Recent Developments
          • 16.2.4.5. Financials (Based on Availability)
        • 16.2.5 Sibelco
          • 16.2.5.1. Overview
          • 16.2.5.2. Products
          • 16.2.5.3. SWOT Analysis
          • 16.2.5.4. Recent Developments
          • 16.2.5.5. Financials (Based on Availability)
        • 16.2.6 Imerys
          • 16.2.6.1. Overview
          • 16.2.6.2. Products
          • 16.2.6.3. SWOT Analysis
          • 16.2.6.4. Recent Developments
          • 16.2.6.5. Financials (Based on Availability)
        • 16.2.7 ULTRA HPQ
          • 16.2.7.1. Overview
          • 16.2.7.2. Products
          • 16.2.7.3. SWOT Analysis
          • 16.2.7.4. Recent Developments
          • 16.2.7.5. Financials (Based on Availability)
        • 16.2.8 Russian Quartz LLC
          • 16.2.8.1. Overview
          • 16.2.8.2. Products
          • 16.2.8.3. SWOT Analysis
          • 16.2.8.4. Recent Developments
          • 16.2.8.5. Financials (Based on Availability)
        • 16.2.9 Australian Silica Quartz Group Ltd
          • 16.2.9.1. Overview
          • 16.2.9.2. Products
          • 16.2.9.3. SWOT Analysis
          • 16.2.9.4. Recent Developments
          • 16.2.9.5. Financials (Based on Availability)
        • 16.2.10 The Quartz Corp
          • 16.2.10.1. Overview
          • 16.2.10.2. Products
          • 16.2.10.3. SWOT Analysis
          • 16.2.10.4. Recent Developments
          • 16.2.10.5. Financials (Based on Availability)

List of Figures

  1. Figure 1: Global High Purity Quartz Market Revenue Breakdown (Million, %) by Region 2024 & 2032
  2. Figure 2: Global High Purity Quartz Market Volume Breakdown (K Tons, %) by Region 2024 & 2032
  3. Figure 3: North America High Purity Quartz Market Revenue (Million), by Country 2024 & 2032
  4. Figure 4: North America High Purity Quartz Market Volume (K Tons), by Country 2024 & 2032
  5. Figure 5: North America High Purity Quartz Market Revenue Share (%), by Country 2024 & 2032
  6. Figure 6: North America High Purity Quartz Market Volume Share (%), by Country 2024 & 2032
  7. Figure 7: Europe High Purity Quartz Market Revenue (Million), by Country 2024 & 2032
  8. Figure 8: Europe High Purity Quartz Market Volume (K Tons), by Country 2024 & 2032
  9. Figure 9: Europe High Purity Quartz Market Revenue Share (%), by Country 2024 & 2032
  10. Figure 10: Europe High Purity Quartz Market Volume Share (%), by Country 2024 & 2032
  11. Figure 11: Asia Pacific High Purity Quartz Market Revenue (Million), by Country 2024 & 2032
  12. Figure 12: Asia Pacific High Purity Quartz Market Volume (K Tons), by Country 2024 & 2032
  13. Figure 13: Asia Pacific High Purity Quartz Market Revenue Share (%), by Country 2024 & 2032
  14. Figure 14: Asia Pacific High Purity Quartz Market Volume Share (%), by Country 2024 & 2032
  15. Figure 15: South America High Purity Quartz Market Revenue (Million), by Country 2024 & 2032
  16. Figure 16: South America High Purity Quartz Market Volume (K Tons), by Country 2024 & 2032
  17. Figure 17: South America High Purity Quartz Market Revenue Share (%), by Country 2024 & 2032
  18. Figure 18: South America High Purity Quartz Market Volume Share (%), by Country 2024 & 2032
  19. Figure 19: MEA High Purity Quartz Market Revenue (Million), by Country 2024 & 2032
  20. Figure 20: MEA High Purity Quartz Market Volume (K Tons), by Country 2024 & 2032
  21. Figure 21: MEA High Purity Quartz Market Revenue Share (%), by Country 2024 & 2032
  22. Figure 22: MEA High Purity Quartz Market Volume Share (%), by Country 2024 & 2032
  23. Figure 23: Asia Pacific High Purity Quartz Market Revenue (Million), by Application 2024 & 2032
  24. Figure 24: Asia Pacific High Purity Quartz Market Volume (K Tons), by Application 2024 & 2032
  25. Figure 25: Asia Pacific High Purity Quartz Market Revenue Share (%), by Application 2024 & 2032
  26. Figure 26: Asia Pacific High Purity Quartz Market Volume Share (%), by Application 2024 & 2032
  27. Figure 27: Asia Pacific High Purity Quartz Market Revenue (Million), by Country 2024 & 2032
  28. Figure 28: Asia Pacific High Purity Quartz Market Volume (K Tons), by Country 2024 & 2032
  29. Figure 29: Asia Pacific High Purity Quartz Market Revenue Share (%), by Country 2024 & 2032
  30. Figure 30: Asia Pacific High Purity Quartz Market Volume Share (%), by Country 2024 & 2032
  31. Figure 31: North America High Purity Quartz Market Revenue (Million), by Application 2024 & 2032
  32. Figure 32: North America High Purity Quartz Market Volume (K Tons), by Application 2024 & 2032
  33. Figure 33: North America High Purity Quartz Market Revenue Share (%), by Application 2024 & 2032
  34. Figure 34: North America High Purity Quartz Market Volume Share (%), by Application 2024 & 2032
  35. Figure 35: North America High Purity Quartz Market Revenue (Million), by Country 2024 & 2032
  36. Figure 36: North America High Purity Quartz Market Volume (K Tons), by Country 2024 & 2032
  37. Figure 37: North America High Purity Quartz Market Revenue Share (%), by Country 2024 & 2032
  38. Figure 38: North America High Purity Quartz Market Volume Share (%), by Country 2024 & 2032
  39. Figure 39: Europe High Purity Quartz Market Revenue (Million), by Application 2024 & 2032
  40. Figure 40: Europe High Purity Quartz Market Volume (K Tons), by Application 2024 & 2032
  41. Figure 41: Europe High Purity Quartz Market Revenue Share (%), by Application 2024 & 2032
  42. Figure 42: Europe High Purity Quartz Market Volume Share (%), by Application 2024 & 2032
  43. Figure 43: Europe High Purity Quartz Market Revenue (Million), by Country 2024 & 2032
  44. Figure 44: Europe High Purity Quartz Market Volume (K Tons), by Country 2024 & 2032
  45. Figure 45: Europe High Purity Quartz Market Revenue Share (%), by Country 2024 & 2032
  46. Figure 46: Europe High Purity Quartz Market Volume Share (%), by Country 2024 & 2032
  47. Figure 47: South America High Purity Quartz Market Revenue (Million), by Application 2024 & 2032
  48. Figure 48: South America High Purity Quartz Market Volume (K Tons), by Application 2024 & 2032
  49. Figure 49: South America High Purity Quartz Market Revenue Share (%), by Application 2024 & 2032
  50. Figure 50: South America High Purity Quartz Market Volume Share (%), by Application 2024 & 2032
  51. Figure 51: South America High Purity Quartz Market Revenue (Million), by Country 2024 & 2032
  52. Figure 52: South America High Purity Quartz Market Volume (K Tons), by Country 2024 & 2032
  53. Figure 53: South America High Purity Quartz Market Revenue Share (%), by Country 2024 & 2032
  54. Figure 54: South America High Purity Quartz Market Volume Share (%), by Country 2024 & 2032
  55. Figure 55: Middle East and Africa High Purity Quartz Market Revenue (Million), by Application 2024 & 2032
  56. Figure 56: Middle East and Africa High Purity Quartz Market Volume (K Tons), by Application 2024 & 2032
  57. Figure 57: Middle East and Africa High Purity Quartz Market Revenue Share (%), by Application 2024 & 2032
  58. Figure 58: Middle East and Africa High Purity Quartz Market Volume Share (%), by Application 2024 & 2032
  59. Figure 59: Middle East and Africa High Purity Quartz Market Revenue (Million), by Country 2024 & 2032
  60. Figure 60: Middle East and Africa High Purity Quartz Market Volume (K Tons), by Country 2024 & 2032
  61. Figure 61: Middle East and Africa High Purity Quartz Market Revenue Share (%), by Country 2024 & 2032
  62. Figure 62: Middle East and Africa High Purity Quartz Market Volume Share (%), by Country 2024 & 2032

List of Tables

  1. Table 1: Global High Purity Quartz Market Revenue Million Forecast, by Region 2019 & 2032
  2. Table 2: Global High Purity Quartz Market Volume K Tons Forecast, by Region 2019 & 2032
  3. Table 3: Global High Purity Quartz Market Revenue Million Forecast, by Application 2019 & 2032
  4. Table 4: Global High Purity Quartz Market Volume K Tons Forecast, by Application 2019 & 2032
  5. Table 5: Global High Purity Quartz Market Revenue Million Forecast, by Region 2019 & 2032
  6. Table 6: Global High Purity Quartz Market Volume K Tons Forecast, by Region 2019 & 2032
  7. Table 7: Global High Purity Quartz Market Revenue Million Forecast, by Country 2019 & 2032
  8. Table 8: Global High Purity Quartz Market Volume K Tons Forecast, by Country 2019 & 2032
  9. Table 9: United States High Purity Quartz Market Revenue (Million) Forecast, by Application 2019 & 2032
  10. Table 10: United States High Purity Quartz Market Volume (K Tons) Forecast, by Application 2019 & 2032
  11. Table 11: Canada High Purity Quartz Market Revenue (Million) Forecast, by Application 2019 & 2032
  12. Table 12: Canada High Purity Quartz Market Volume (K Tons) Forecast, by Application 2019 & 2032
  13. Table 13: Mexico High Purity Quartz Market Revenue (Million) Forecast, by Application 2019 & 2032
  14. Table 14: Mexico High Purity Quartz Market Volume (K Tons) Forecast, by Application 2019 & 2032
  15. Table 15: Global High Purity Quartz Market Revenue Million Forecast, by Country 2019 & 2032
  16. Table 16: Global High Purity Quartz Market Volume K Tons Forecast, by Country 2019 & 2032
  17. Table 17: Germany High Purity Quartz Market Revenue (Million) Forecast, by Application 2019 & 2032
  18. Table 18: Germany High Purity Quartz Market Volume (K Tons) Forecast, by Application 2019 & 2032
  19. Table 19: France High Purity Quartz Market Revenue (Million) Forecast, by Application 2019 & 2032
  20. Table 20: France High Purity Quartz Market Volume (K Tons) Forecast, by Application 2019 & 2032
  21. Table 21: Italy High Purity Quartz Market Revenue (Million) Forecast, by Application 2019 & 2032
  22. Table 22: Italy High Purity Quartz Market Volume (K Tons) Forecast, by Application 2019 & 2032
  23. Table 23: United Kingdom High Purity Quartz Market Revenue (Million) Forecast, by Application 2019 & 2032
  24. Table 24: United Kingdom High Purity Quartz Market Volume (K Tons) Forecast, by Application 2019 & 2032
  25. Table 25: Netherlands High Purity Quartz Market Revenue (Million) Forecast, by Application 2019 & 2032
  26. Table 26: Netherlands High Purity Quartz Market Volume (K Tons) Forecast, by Application 2019 & 2032
  27. Table 27: Rest of Europe High Purity Quartz Market Revenue (Million) Forecast, by Application 2019 & 2032
  28. Table 28: Rest of Europe High Purity Quartz Market Volume (K Tons) Forecast, by Application 2019 & 2032
  29. Table 29: Global High Purity Quartz Market Revenue Million Forecast, by Country 2019 & 2032
  30. Table 30: Global High Purity Quartz Market Volume K Tons Forecast, by Country 2019 & 2032
  31. Table 31: China High Purity Quartz Market Revenue (Million) Forecast, by Application 2019 & 2032
  32. Table 32: China High Purity Quartz Market Volume (K Tons) Forecast, by Application 2019 & 2032
  33. Table 33: Japan High Purity Quartz Market Revenue (Million) Forecast, by Application 2019 & 2032
  34. Table 34: Japan High Purity Quartz Market Volume (K Tons) Forecast, by Application 2019 & 2032
  35. Table 35: India High Purity Quartz Market Revenue (Million) Forecast, by Application 2019 & 2032
  36. Table 36: India High Purity Quartz Market Volume (K Tons) Forecast, by Application 2019 & 2032
  37. Table 37: South Korea High Purity Quartz Market Revenue (Million) Forecast, by Application 2019 & 2032
  38. Table 38: South Korea High Purity Quartz Market Volume (K Tons) Forecast, by Application 2019 & 2032
  39. Table 39: Taiwan High Purity Quartz Market Revenue (Million) Forecast, by Application 2019 & 2032
  40. Table 40: Taiwan High Purity Quartz Market Volume (K Tons) Forecast, by Application 2019 & 2032
  41. Table 41: Australia High Purity Quartz Market Revenue (Million) Forecast, by Application 2019 & 2032
  42. Table 42: Australia High Purity Quartz Market Volume (K Tons) Forecast, by Application 2019 & 2032
  43. Table 43: Rest of Asia-Pacific High Purity Quartz Market Revenue (Million) Forecast, by Application 2019 & 2032
  44. Table 44: Rest of Asia-Pacific High Purity Quartz Market Volume (K Tons) Forecast, by Application 2019 & 2032
  45. Table 45: Global High Purity Quartz Market Revenue Million Forecast, by Country 2019 & 2032
  46. Table 46: Global High Purity Quartz Market Volume K Tons Forecast, by Country 2019 & 2032
  47. Table 47: Brazil High Purity Quartz Market Revenue (Million) Forecast, by Application 2019 & 2032
  48. Table 48: Brazil High Purity Quartz Market Volume (K Tons) Forecast, by Application 2019 & 2032
  49. Table 49: Argentina High Purity Quartz Market Revenue (Million) Forecast, by Application 2019 & 2032
  50. Table 50: Argentina High Purity Quartz Market Volume (K Tons) Forecast, by Application 2019 & 2032
  51. Table 51: Rest of South America High Purity Quartz Market Revenue (Million) Forecast, by Application 2019 & 2032
  52. Table 52: Rest of South America High Purity Quartz Market Volume (K Tons) Forecast, by Application 2019 & 2032
  53. Table 53: Global High Purity Quartz Market Revenue Million Forecast, by Country 2019 & 2032
  54. Table 54: Global High Purity Quartz Market Volume K Tons Forecast, by Country 2019 & 2032
  55. Table 55: Middle East High Purity Quartz Market Revenue (Million) Forecast, by Application 2019 & 2032
  56. Table 56: Middle East High Purity Quartz Market Volume (K Tons) Forecast, by Application 2019 & 2032
  57. Table 57: Africa High Purity Quartz Market Revenue (Million) Forecast, by Application 2019 & 2032
  58. Table 58: Africa High Purity Quartz Market Volume (K Tons) Forecast, by Application 2019 & 2032
  59. Table 59: Global High Purity Quartz Market Revenue Million Forecast, by Application 2019 & 2032
  60. Table 60: Global High Purity Quartz Market Volume K Tons Forecast, by Application 2019 & 2032
  61. Table 61: Global High Purity Quartz Market Revenue Million Forecast, by Country 2019 & 2032
  62. Table 62: Global High Purity Quartz Market Volume K Tons Forecast, by Country 2019 & 2032
  63. Table 63: China High Purity Quartz Market Revenue (Million) Forecast, by Application 2019 & 2032
  64. Table 64: China High Purity Quartz Market Volume (K Tons) Forecast, by Application 2019 & 2032
  65. Table 65: India High Purity Quartz Market Revenue (Million) Forecast, by Application 2019 & 2032
  66. Table 66: India High Purity Quartz Market Volume (K Tons) Forecast, by Application 2019 & 2032
  67. Table 67: Japan High Purity Quartz Market Revenue (Million) Forecast, by Application 2019 & 2032
  68. Table 68: Japan High Purity Quartz Market Volume (K Tons) Forecast, by Application 2019 & 2032
  69. Table 69: South Korea High Purity Quartz Market Revenue (Million) Forecast, by Application 2019 & 2032
  70. Table 70: South Korea High Purity Quartz Market Volume (K Tons) Forecast, by Application 2019 & 2032
  71. Table 71: Rest of Asia Pacific High Purity Quartz Market Revenue (Million) Forecast, by Application 2019 & 2032
  72. Table 72: Rest of Asia Pacific High Purity Quartz Market Volume (K Tons) Forecast, by Application 2019 & 2032
  73. Table 73: Global High Purity Quartz Market Revenue Million Forecast, by Application 2019 & 2032
  74. Table 74: Global High Purity Quartz Market Volume K Tons Forecast, by Application 2019 & 2032
  75. Table 75: Global High Purity Quartz Market Revenue Million Forecast, by Country 2019 & 2032
  76. Table 76: Global High Purity Quartz Market Volume K Tons Forecast, by Country 2019 & 2032
  77. Table 77: United States High Purity Quartz Market Revenue (Million) Forecast, by Application 2019 & 2032
  78. Table 78: United States High Purity Quartz Market Volume (K Tons) Forecast, by Application 2019 & 2032
  79. Table 79: Canada High Purity Quartz Market Revenue (Million) Forecast, by Application 2019 & 2032
  80. Table 80: Canada High Purity Quartz Market Volume (K Tons) Forecast, by Application 2019 & 2032
  81. Table 81: Mexico High Purity Quartz Market Revenue (Million) Forecast, by Application 2019 & 2032
  82. Table 82: Mexico High Purity Quartz Market Volume (K Tons) Forecast, by Application 2019 & 2032
  83. Table 83: Global High Purity Quartz Market Revenue Million Forecast, by Application 2019 & 2032
  84. Table 84: Global High Purity Quartz Market Volume K Tons Forecast, by Application 2019 & 2032
  85. Table 85: Global High Purity Quartz Market Revenue Million Forecast, by Country 2019 & 2032
  86. Table 86: Global High Purity Quartz Market Volume K Tons Forecast, by Country 2019 & 2032
  87. Table 87: Germany High Purity Quartz Market Revenue (Million) Forecast, by Application 2019 & 2032
  88. Table 88: Germany High Purity Quartz Market Volume (K Tons) Forecast, by Application 2019 & 2032
  89. Table 89: United Kingdom High Purity Quartz Market Revenue (Million) Forecast, by Application 2019 & 2032
  90. Table 90: United Kingdom High Purity Quartz Market Volume (K Tons) Forecast, by Application 2019 & 2032
  91. Table 91: Italy High Purity Quartz Market Revenue (Million) Forecast, by Application 2019 & 2032
  92. Table 92: Italy High Purity Quartz Market Volume (K Tons) Forecast, by Application 2019 & 2032
  93. Table 93: France High Purity Quartz Market Revenue (Million) Forecast, by Application 2019 & 2032
  94. Table 94: France High Purity Quartz Market Volume (K Tons) Forecast, by Application 2019 & 2032
  95. Table 95: Rest of Europe High Purity Quartz Market Revenue (Million) Forecast, by Application 2019 & 2032
  96. Table 96: Rest of Europe High Purity Quartz Market Volume (K Tons) Forecast, by Application 2019 & 2032
  97. Table 97: Global High Purity Quartz Market Revenue Million Forecast, by Application 2019 & 2032
  98. Table 98: Global High Purity Quartz Market Volume K Tons Forecast, by Application 2019 & 2032
  99. Table 99: Global High Purity Quartz Market Revenue Million Forecast, by Country 2019 & 2032
  100. Table 100: Global High Purity Quartz Market Volume K Tons Forecast, by Country 2019 & 2032
  101. Table 101: Brazil High Purity Quartz Market Revenue (Million) Forecast, by Application 2019 & 2032
  102. Table 102: Brazil High Purity Quartz Market Volume (K Tons) Forecast, by Application 2019 & 2032
  103. Table 103: Argentina High Purity Quartz Market Revenue (Million) Forecast, by Application 2019 & 2032
  104. Table 104: Argentina High Purity Quartz Market Volume (K Tons) Forecast, by Application 2019 & 2032
  105. Table 105: Rest of South America High Purity Quartz Market Revenue (Million) Forecast, by Application 2019 & 2032
  106. Table 106: Rest of South America High Purity Quartz Market Volume (K Tons) Forecast, by Application 2019 & 2032
  107. Table 107: Global High Purity Quartz Market Revenue Million Forecast, by Application 2019 & 2032
  108. Table 108: Global High Purity Quartz Market Volume K Tons Forecast, by Application 2019 & 2032
  109. Table 109: Global High Purity Quartz Market Revenue Million Forecast, by Country 2019 & 2032
  110. Table 110: Global High Purity Quartz Market Volume K Tons Forecast, by Country 2019 & 2032
  111. Table 111: Saudi Arabia High Purity Quartz Market Revenue (Million) Forecast, by Application 2019 & 2032
  112. Table 112: Saudi Arabia High Purity Quartz Market Volume (K Tons) Forecast, by Application 2019 & 2032
  113. Table 113: South Africa High Purity Quartz Market Revenue (Million) Forecast, by Application 2019 & 2032
  114. Table 114: South Africa High Purity Quartz Market Volume (K Tons) Forecast, by Application 2019 & 2032
  115. Table 115: Rest of Middle East and Africa High Purity Quartz Market Revenue (Million) Forecast, by Application 2019 & 2032
  116. Table 116: Rest of Middle East and Africa High Purity Quartz Market Volume (K Tons) Forecast, by Application 2019 & 2032


Frequently Asked Questions

1. What is the projected Compound Annual Growth Rate (CAGR) of the High Purity Quartz Market?

The projected CAGR is approximately > 4.50%.

2. Which companies are prominent players in the High Purity Quartz Market?

Key companies in the market include Jiangsu Pacific Quartz Co Ltd, American Elements, Covia Holdings LLC, Momentive Technologies, Sibelco, Imerys, ULTRA HPQ, Russian Quartz LLC, Australian Silica Quartz Group Ltd, The Quartz Corp.

3. What are the main segments of the High Purity Quartz Market?

The market segments include Application.

4. Can you provide details about the market size?

The market size is estimated to be USD 672.93 Million as of 2022.

5. What are some drivers contributing to market growth?

Growing Demand for Semiconductor ICs; Increasing Adoption in Solar Industry; Other Drivers.

6. What are the notable trends driving market growth?

Growing Demand from Semiconductor Industry.

7. Are there any restraints impacting market growth?

The Fluctuating Prices of Raw Materials; Other Restraints.

8. Can you provide examples of recent developments in the market?

April 2023: Sibelco announced an investment of approx. USD 200 million to double high purity quartz (HPQ) installed capacity at its Spruce Pine facility in North Carolina, United States.

9. What pricing options are available for accessing the report?

Pricing options include single-user, multi-user, and enterprise licenses priced at USD 4750, USD 5250, and USD 8750 respectively.

10. Is the market size provided in terms of value or volume?

The market size is provided in terms of value, measured in Million and volume, measured in K Tons.

11. Are there any specific market keywords associated with the report?

Yes, the market keyword associated with the report is "High Purity Quartz Market," which aids in identifying and referencing the specific market segment covered.

12. How do I determine which pricing option suits my needs best?

The pricing options vary based on user requirements and access needs. Individual users may opt for single-user licenses, while businesses requiring broader access may choose multi-user or enterprise licenses for cost-effective access to the report.

13. Are there any additional resources or data provided in the High Purity Quartz Market report?

While the report offers comprehensive insights, it's advisable to review the specific contents or supplementary materials provided to ascertain if additional resources or data are available.

14. How can I stay updated on further developments or reports in the High Purity Quartz Market?

To stay informed about further developments, trends, and reports in the High Purity Quartz Market, consider subscribing to industry newsletters, following relevant companies and organizations, or regularly checking reputable industry news sources and publications.


Methodology

Step 1 - Identification of Relevant Samples Size from Population Database

Step Chart
Bar Chart
Method Chart

Step 2 - Approaches for Defining Global Market Size (Value, Volume* & Price*)

Approach Chart
Top-down and bottom-up approaches are used to validate the global market size and estimate the market size for manufactures, regional segments, product, and application.

Note*: In applicable scenarios

Step 3 - Data Sources

Primary Research

  • Web Analytics
  • Survey Reports
  • Research Institute
  • Latest Research Reports
  • Opinion Leaders

Secondary Research

  • Annual Reports
  • White Paper
  • Latest Press Release
  • Industry Association
  • Paid Database
  • Investor Presentations
Analyst Chart

Step 4 - Data Triangulation

Involves using different sources of information in order to increase the validity of a study

These sources are likely to be stakeholders in a program - participants, other researchers, program staff, other community members, and so on.

Then we put all data in single framework & apply various statistical tools to find out the dynamic on the market.

During the analysis stage, feedback from the stakeholder groups would be compared to determine areas of agreement as well as areas of divergence

Additionally, after gathering mixed and scattered data from a wide range of sources, data is triangulated and correlated to come up with estimated figures which are further validated through primary mediums or industry experts, opinion leaders.

About Research Axiom

Research Axiom delivers in-depth market research, industry analysis, and consulting for pharmaceuticals, automotive, IT, and consumer goods. Our reports provide the clarity you need to make informed decisions and drive innovation.

Our team combines primary research, advanced analytics, and sector expertise to deliver actionable intelligence. We offer syndicated reports, custom research, and consulting services tailored to your business needs.

At Research Axiom, we are committed to quality, transparency, and client satisfaction. Every report is rigorously validated to ensure accuracy and relevance. Our global perspective and local expertise help you understand both the big picture and the finer details of your market.

Stay informed with Research Axiom. Subscribe to our newsletter for the latest updates and research highlights, and follow us on social media for real-time insights. Research Axiom – Turning Data into Business Advantage.

artwork spiralartwork spiralRelated Reports
artwork underline

CCUS Market Decoded: Comprehensive Analysis and Forecasts 2025-2033

Explore the booming Carbon Capture, Utilization, and Storage (CCUS) market, driven by climate goals and industrial decarbonization. Discover key trends, technologies, and growth forecasts from 2025-2033.

September 2025
Base Year: 2024
No Of Pages: 180
Price: $4750

Sri Lanka Paints And Coatings Market Market Trends and Insights

Explore the Sri Lanka paints and coatings market, driven by construction, urbanization, and eco-friendly trends. Get insights into market size, CAGR, key players, and future growth.

September 2025
Base Year: 2024
No Of Pages: 180
Price: $3800

Polypropylene Catalyst Industry Strategic Dynamics: Competitor Analysis 2025-2033

Explore the booming Polypropylene Catalyst market forecast, driven by surging demand for polypropylene in packaging, automotive, and construction. Discover key drivers, trends, restraints, and top companies shaping this \$1.35 billion industry with a 5.3% CAGR.

September 2025
Base Year: 2024
No Of Pages: 180
Price: $3,950

Vietnam Commercial Vehicles Lubricants Market XX CAGR Growth Outlook 2025-2033

Explore the booming Vietnam Commercial Vehicles Lubricants Market, driven by logistics growth and infrastructure development. Discover market size, CAGR, key drivers, trends, and leading companies. Get insights into Engine Oils, Greases, and more.

September 2025
Base Year: 2024
No Of Pages: 197
Price: $3800

Self-adhered Roofing Membranes Market Growth Opportunities: Market Size Forecast to 2033

Explore the Self-adhered Roofing Membranes Market growth forecast, key drivers like TPO & EPDM, and regional trends in North America, Asia Pacific, and Europe. Get insights into market size and CAGR.

September 2025
Base Year: 2024
No Of Pages: 180
Price: $4750

Polyurethane Composites Market Market’s Technological Evolution: Trends and Analysis 2025-2033

Explore the dynamic global Polyurethane Composites Market, forecasting significant growth driven by transportation, construction, and renewable energy. Discover key drivers, trends, and restraints shaping this expanding industry.

September 2025
Base Year: 2024
No Of Pages: 234
Price: $4750

Nucleotides Market 2025 Trends and Forecasts 2033: Analyzing Growth Opportunities

Explore the dynamic Nucleotides Market with a market size of USD 718.4 million and a CAGR over 7%. Discover key drivers, pharmaceutical applications, and regional growth trends through 2033.

September 2025
Base Year: 2024
No Of Pages: 180
Price: $4750

Superhydrophobic Coating Market 2025 to Grow at XX CAGR with XXX Million Market Size: Analysis and Forecasts 2033

The size of the Superhydrophobic Coating Market market was valued at USD XX Million in 2024 and is projected to reach USD XXX Million by 2033, with an expected CAGR of % during the forecast period.

September 2025
Base Year: 2024
No Of Pages: 234
Price: $4750

Europe Ammonium Nitrate Market Market’s Strategic Roadmap: Insights for 2025-2033

The size of the Europe Ammonium Nitrate Market market was valued at USD XX Million in 2024 and is projected to reach USD XXX Million by 2033, with an expected CAGR of 1.03">> 1.03% during the forecast period.

September 2025
Base Year: 2024
No Of Pages: 140
Price: $4750

Industrial Laser Market CAGR Growth Drivers and Trends: Forecasts 2025-2033

The size of the Industrial Laser Market market was valued at USD XX Million in 2024 and is projected to reach USD XXX Million by 2033, with an expected CAGR of 13.00">> 13.00% during the forecast period.

September 2025
Base Year: 2024
No Of Pages: 234
Price: $4750

United States Decorative Laminates Market Market Overview: Trends and Strategic Forecasts 2025-2033

The US Decorative Laminates Market is booming, projected to exceed $2.9 billion by 2033 with a CAGR above 2%. Driven by home renovations and new construction, this report analyzes market trends, key players (Formica, Wilsonart), segments (furniture, flooring), and regional growth, providing valuable insights for investors and industry professionals.

August 2025
Base Year: 2024
No Of Pages: 120
Price: $3800

Demand Patterns in Microcrystalline Wax Market Market: Projections to 2033

Discover the booming microcrystalline wax market! This comprehensive analysis reveals a CAGR of 8.15% through 2033, driven by cosmetics, packaging, and candle industries. Explore regional trends, key players (Sasol, Sonneborn, Koster Keunen), and future growth projections.

August 2025
Base Year: 2024
No Of Pages: 180
Price: $4750

GCC Flat Glass Market Market’s Growth Catalysts

Discover the booming GCC flat glass market! Our in-depth analysis reveals a CAGR of 4.49%, driven by construction, automotive, and solar energy sectors. Learn about key players, market trends, and future growth projections for annealed glass, coated glass, and more. Invest wisely in this lucrative market.

August 2025
Base Year: 2024
No Of Pages: 150
Price: $4750

Packaging Tapes Industry in Developing Economies: Trends and Growth Analysis 2025-2033

Discover the booming Packaging Tapes market! Our in-depth analysis reveals a CAGR exceeding 6%, driven by e-commerce and sustainable packaging trends. Explore market size, key players (3M, Avery Dennison, etc.), regional insights, and future growth projections. Learn how to capitalize on this expanding industry.

August 2025
Base Year: 2024
No Of Pages: 150
Price: $4750

Plastic Adhesives Industry: Growth Opportunities and Competitive Landscape Overview 2025-2033

Discover the booming plastic adhesives market! This comprehensive analysis reveals key trends, drivers, and restraints impacting growth through 2033, covering resin types, technologies, and major players like 3M and Henkel. Explore regional market shares and CAGR projections.

August 2025
Base Year: 2024
No Of Pages: 150
Price: $4750

Iran Automotive Engine Oils Market Market Report: Trends and Growth

Discover the latest insights into the thriving Iran Automotive Engine Oils Market. This comprehensive analysis reveals a market size of $150 million in 2025, projected to grow at a 2.22% CAGR until 2033. Explore key drivers, trends, restraints, and leading players shaping this dynamic sector.

August 2025
Base Year: 2024
No Of Pages: 197
Price: $3800

Asia-Pacific Acetic Acid Market 2025-2033 Trends: Unveiling Growth Opportunities and Competitor Dynamics

The Asia-Pacific acetic acid market is booming, with a projected CAGR of 5.26% (2025-2033). This comprehensive analysis explores market size, key drivers (textiles, pharmaceuticals), major players (Celanese, Eastman Chemical), and regional trends, offering valuable insights for industry stakeholders. Discover growth opportunities in this dynamic market.

August 2025
Base Year: 2024
No Of Pages: 234
Price: $4750

Facade Coatings Market Competitive Advantage: Trends and Opportunities to 2033

Discover the booming facade coatings market! Our analysis reveals a CAGR exceeding 7%, driven by urbanization and demand for energy-efficient buildings. Explore market segmentation, key players (Nippon Paint, Sherwin-Williams, AkzoNobel), and regional trends in this comprehensive report. Learn about silicone, acrylic, and other resin types dominating the industry.

August 2025
Base Year: 2024
No Of Pages: 234
Price: $4750

North America Powder Coatings Market Strategic Insights for 2025 and Forecasts to 2033: Market Trends

The North American powder coatings market is booming, projected to reach [estimated 2033 value] by 2033 with a 4% CAGR. This in-depth analysis explores market drivers, trends, and restraints, covering key resin types, end-user industries, and leading companies. Discover growth opportunities in architectural, automotive, and industrial applications.

August 2025
Base Year: 2024
No Of Pages: 180
Price: $4750

Strategic Insights into India Cement Market Market Trends

Discover the booming Indian cement market! Our in-depth analysis reveals a 5% CAGR from 2025-2033, driven by infrastructure growth and urbanization. Explore key players, market segmentation (OPC, blended cement, etc.), regional trends, and future projections for India's cement industry.

August 2025
Base Year: 2024
No Of Pages: 150
Price: $3800

Asia-Pacific Laminated Adhesives Industry 2025 to Grow at XX CAGR with XXX Million Market Size: Analysis and Forecasts 2033

The Asia-Pacific laminated adhesives market is booming, projected to exceed a CAGR of 6% through 2033. Driven by packaging, industrial, and transportation growth, this market analysis explores key trends, restraints, and leading companies like Avery Dennison and Henkel. Discover insights into regional market share and future projections.

August 2025
Base Year: 2024
No Of Pages: 150
Price: $4750

Analyzing Asia-Pacific Surface Treatment Chemicals Market: Opportunities and Growth Patterns 2025-2033

The Asia-Pacific surface treatment chemicals market is booming, with a CAGR exceeding 5%! This in-depth analysis explores market size, key drivers (automotive, electronics, construction), top players (Henkel, PPG, Chemetall), and future trends in this rapidly growing sector. Discover opportunities and challenges in this dynamic market.

August 2025
Base Year: 2024
No Of Pages: 234
Price: $4750

Barium Petroleum Sulfonate Market Trends and Opportunities for Growth

Discover the booming Barium Petroleum Sulfonate market forecast to 2033! This comprehensive analysis reveals key growth drivers, regional market shares, and competitive landscape insights. Learn about the impact of EOR techniques and environmental regulations on market expansion. Explore the projected CAGR and understand future market trends.

August 2025
Base Year: 2024
No Of Pages: 234
Price: $4750

Consumer Trends in South America Waterborne Adhesives Market Market 2025-2033

Discover the booming South American waterborne adhesives market! This in-depth analysis reveals key trends, drivers, and restraints shaping the $XX million market, projected to exceed 4% CAGR through 2033. Explore regional insights, leading companies (Henkel, 3M, Pidilite), and lucrative segments like building & construction and packaging. Get your free market report today!

August 2025
Base Year: 2024
No Of Pages: 234
Price: $4750

Strategic Growth Drivers for APAC Paints & Coatings Additives Industry Market

The APAC paints & coatings additives market is booming, with a CAGR exceeding 6%! Discover key trends, drivers, and regional breakdowns in this comprehensive market analysis, featuring insights on major players and growth projections to 2033. Learn how to capitalize on this lucrative opportunity.

August 2025
Base Year: 2024
No Of Pages: 180
Price: $4750

ASEAN Protective Coatings Market 2025-2033 Overview: Trends, Competitor Dynamics, and Opportunities

Discover the booming ASEAN protective coatings market! This in-depth analysis reveals a $300M market in 2025, projected to grow at a CAGR exceeding 3% until 2033, driven by infrastructure development and advanced coating technologies. Learn about key players, regional trends, and market restraints in this comprehensive report.

August 2025
Base Year: 2024
No Of Pages: 180
Price: $4750

Exploring Fatty Acid Ester Market Growth Trajectories: CAGR Insights 2025-2033

Discover the booming Fatty Acid Ester market! This comprehensive analysis reveals key drivers, trends, and restraints shaping this multi-billion dollar industry, including projections to 2033, regional breakdowns, and leading companies. Explore market segmentation by type and application, and gain valuable insights for investment and strategic planning.

August 2025
Base Year: 2024
No Of Pages: 180
Price: $4750

Regional Analysis of Asia-Pacific Electronics Adhesives Market Growth Trajectories

The Asia-Pacific Electronics Adhesives Market is booming, projected to exceed $27.6 Billion by 2033 with a CAGR >8%. Driven by 5G, electric vehicles, and consumer electronics growth, this report analyzes market trends, key players (Henkel, 3M, BASF), and application segments (conformal coatings, surface mounting). Discover key insights and forecast data now!

August 2025
Base Year: 2024
No Of Pages: 234
Price: $4750

Strategic Vision for Particle Board Industry in India Industry Trends

Discover the booming Indian particle board market! This in-depth analysis reveals a $0.64B market in 2025, projected to grow at a 12.15% CAGR until 2033, driven by construction, furniture, and infrastructure growth. Explore key players, regional trends, and future forecasts for this dynamic sector.

August 2025
Base Year: 2024
No Of Pages: 197
Price: $3800

Navigating Cryogenic Valves Market Market Trends: Competitor Analysis and Growth 2025-2033

The Cryogenic Valves Market is booming, with a CAGR exceeding 4% and projected growth to 2033. Driven by LNG expansion and technological advancements, this market analysis reveals key trends, restraints, and leading companies, offering valuable insights for investors and industry professionals. Explore market segmentation, regional breakdowns, and future projections.

August 2025
Base Year: 2024
No Of Pages: 234
Price: $4750

Exploring Innovation in Saturated Polyester Resins Market Industry

Discover the latest insights into the booming saturated polyester resins market, projected to reach $7.39 billion by 2033 with a CAGR of 4.24%. This comprehensive analysis covers market size, key drivers, trends, restraints, segments (liquid/solid, applications), leading companies, and regional breakdowns (North America, Europe, Asia-Pacific, etc.). Learn about growth opportunities and future trends in this vital industry.

August 2025
Base Year: 2024
No Of Pages: 150
Price: $4750

Navigating Bismuth Market Market Trends: Competitor Analysis and Growth 2025-2033

Discover the booming bismuth market! This in-depth analysis reveals a CAGR exceeding 5%, driven by pharmaceutical, automotive, and electronics demand. Explore market trends, segmentation (bismuth oxide, bismuth oxychloride, etc.), key players (Merck KGaA, BASF SE, etc.), and regional growth forecasts (Asia Pacific, North America) through 2033.

August 2025
Base Year: 2024
No Of Pages: 234
Price: $4750

Consumer Trends Driving Tall Oil Rosin Industry Market Growth

Discover the booming Tall Oil Rosin market! Our comprehensive analysis reveals key trends, growth projections (2019-2033), and regional market share, highlighting opportunities in adhesives, inks, and coatings. Learn about CAGR, market size, and future forecasts for this vital chemical industry segment.

August 2025
Base Year: 2024
No Of Pages: 234
Price: $4750

Strategic Insights for Wax Additives Market Market Expansion

The global wax additives market is booming, projected to reach over $2.5 billion by 2033 with a 4.95% CAGR. Discover key trends, drivers, restraints, and leading companies shaping this dynamic industry across coatings, leather, and printing applications. Explore market segmentation by material type and regional insights.

August 2025
Base Year: 2024
No Of Pages: 180
Price: $4750

High Purity Quartz Market Industry Insights and Forecasts

The high-purity quartz market is booming, with a projected CAGR exceeding 4.5% to 2033. Driven by semiconductor, solar, and lighting industries, this market analysis reveals key trends, regional insights, and leading companies like Jiangsu Pacific Quartz and Momentive Technologies. Discover the future of high-purity quartz.

August 2025
Base Year: 2024
No Of Pages: 234
Price: $4750

Polyether Amine Industry XX CAGR Growth Outlook 2025-2033

Discover the booming polyether amine market! This in-depth analysis reveals a CAGR of 9.44%, driven by polyurea coatings, fuel additives, and composites. Explore key trends, regional growth, and leading companies shaping this dynamic industry. Get the latest market insights and projections for 2025-2033.

August 2025
Base Year: 2024
No Of Pages: 234
Price: $4750

Flame Retardants for Aerospace Plastics Market Drivers of Growth: Opportunities to 2033

Discover the booming Flame Retardants for Aerospace Plastics market analysis, projecting robust growth (CAGR >3%) to 2033. Explore key drivers, trends, restraints, leading companies (BASF, Clariant, etc.), and regional market share data. Learn about the latest innovations in halogen-free and sustainable solutions.

August 2025
Base Year: 2024
No Of Pages: 234
Price: $4750

Turkey Commercial Vehicle Lubricant Market Insights: Market Size Analysis to 2033

Discover the booming Turkish commercial vehicle lubricant market! Our in-depth analysis reveals a CAGR of 5.45% through 2033, driven by economic growth and regulatory changes. Explore key players, market segmentation, and future trends impacting engine oils, greases, and more.

August 2025
Base Year: 2024
No Of Pages: 120
Price: $3800

Adhesives and Sealants Market 2025 to Grow at XX CAGR with XXX Million Market Size: Analysis and Forecasts 2033

The global adhesives and sealants market is booming, projected to exceed $133 billion by 2033, driven by construction, automotive, and aerospace growth. Explore market trends, key players (Henkel, 3M, Akzo Nobel), and regional insights in this comprehensive analysis. Discover opportunities within polyurethane, epoxy, and silicone adhesives and sealants.

August 2025
Base Year: 2024
No Of Pages: 180
Price: $4750

Unlocking Insights for Polyurethane Powder Coatings Market Growth Strategies

The Polyurethane Powder Coatings Market is booming, with a CAGR exceeding 5%! Discover key trends, drivers, and restraints shaping this $XX billion industry. Explore regional market share, leading companies, and future growth projections in our comprehensive market analysis.

August 2025
Base Year: 2024
No Of Pages: 234
Price: $4750

Decoding Bio alcohols Market Consumer Preferences 2025-2033

Discover the booming bio-alcohols market! This comprehensive analysis reveals key trends, drivers, and restraints impacting bio-ethanol, bio-methanol, bio-butanol, and bio-BDO production from 2019-2033, including regional market shares and leading companies. Explore the potential of sustainable fuels and bio-based materials in transportation, construction, and more.

August 2025
Base Year: 2024
No Of Pages: 234
Price: $4750

Exploring Innovation in North America Electronics Adhesives Market Industry

Discover the booming North America Electronics Adhesives Market! This in-depth analysis reveals a CAGR exceeding 7%, driven by EV adoption, consumer electronics growth, and industry innovation. Explore market size, key players (Henkel, 3M, Dow), and future trends impacting epoxy, acrylic, and polyurethane adhesives.

August 2025
Base Year: 2024
No Of Pages: 234
Price: $4750

Fracking Chemicals Fluid Market Size, Share, and Growth Report: In-Depth Analysis and Forecast to 2033

The Fracking Chemicals Fluid market is booming, exceeding a $15 billion valuation in 2025 and projected for 9%+ CAGR through 2033. Driven by rising energy demand and technological advancements, this report analyzes market segments (water-based, oil-based, etc.), key players (Baker Hughes, Halliburton, Schlumberger), and regional growth trends. Discover insights into this dynamic market.

August 2025
Base Year: 2024
No Of Pages: 234
Price: $4750

Opportunities in United Kingdom Architectural Coatings Market Market 2025-2033

Discover the booming UK Architectural Coatings Market! This in-depth analysis reveals key trends, growth drivers, and market segmentation from 2019-2033, including insights on waterborne coatings, resin types, and leading companies like AkzoNobel and Sherwin-Williams. Learn about projected CAGR and future growth opportunities.

August 2025
Base Year: 2024
No Of Pages: 180
Price: $3800

Polyurea Grease Market Industry Forecasts: Insights and Growth

Discover the booming Polyurea Grease market! This in-depth analysis reveals a CAGR exceeding 7%, driven by high-performance needs and sustainability trends. Explore market size, key players (Castrol, Sinopec, Chevron), and future growth projections for 2025-2033.

August 2025
Base Year: 2024
No Of Pages: 234
Price: $4750

GFRP Industry Market Report: Trends and Growth

Discover the booming GFRP market analysis with a CAGR exceeding 4%! Explore key trends, drivers, restraints, and regional insights. Learn about leading companies and future projections until 2033. Invest wisely in this expanding sector.

August 2025
Base Year: 2024
No Of Pages: 234
Price: $4750

Understanding Rubber Bonded Abrasive Market Trends and Growth Dynamics

Discover the booming Rubber Bonded Abrasive market! Explore key trends, growth drivers, and regional insights for 2025-2033. Learn about leading companies and the future of this $XX million industry. Get your market analysis now.

August 2025
Base Year: 2024
No Of Pages: 150
Price: $4750

Hydrogen Cyanide Market Analysis 2025 and Forecasts 2033: Unveiling Growth Opportunities

The Hydrogen Cyanide market is poised for steady growth, driven by increasing demand from key industries like textiles and mining. Learn about market size, trends, key players, and regional analysis in this comprehensive report covering the period 2019-2033. Explore the challenges and opportunities in this vital chemical market.

August 2025
Base Year: 2024
No Of Pages: 180
Price: $4750

Strategic Drivers and Barriers in Polyester Hot Melt Adhesives Market Market 2025-2033

Discover the latest insights into the booming Polyester Hot Melt Adhesives market. Explore market size, CAGR, key drivers, trends, restraints, and leading companies. Learn about growth projections to 2033 and regional market share analysis. Download your free report today!

August 2025
Base Year: 2024
No Of Pages: 234
Price: $4750

Poland Architectural Coatings Market 2025-2033 Overview: Trends, Competitor Dynamics, and Opportunities

Discover the booming Poland architectural coatings market! This in-depth analysis reveals a CAGR exceeding 4%, driven by construction growth and rising demand for sustainable solutions. Explore market segments, key players (AkzoNobel, Jotun, PPG), and future trends impacting this €[estimated value] market from 2025-2033.

August 2025
Base Year: 2024
No Of Pages: 180
Price: $3800

Business Address

Head Office

Ansec House 3 rd floor Tank Road, Yerwada, Pune, Maharashtra 411014

Contact Information

Craig Francis

Business Development Head

+17162654855

[email protected]

Secure Payment Partners

payment image
RetailLogisticsPackagingAutomotiveHealthcareAgricultureEnergy & PowerFood & BeverageAerospace & DefenseChemicals & MaterialsHospitality and TourismAnimal Nutrition & WellnessConsumer Goods and ServicesReal Estate and ConstructionHome and Property ImprovementTechnology, Media and TelecomManufacturing Products and ServicesFinancial Services and Investment Intelligence

© 2025 PRDUA Research & Media Private Limited, All rights reserved

Privacy Policy
Terms and Conditions
FAQ
  • Home
  • About Us
  • Industries
    • Aerospace & Defense
    • Agriculture
    • Animal Nutrition & Wellness
    • Automotive
    • Chemicals & Materials
    • Consumer Goods and Services
    • Energy & Power
    • Financial Services and Investment Intelligence
    • Food & Beverage
    • Home and Property Improvement
    • Hospitality and Tourism
    • Logistics
    • Manufacturing Products and Services
    • Packaging
    • Professional and Commercial Services
    • Real Estate and Construction
    • Retail
    • Technology, Media and Telecom
    • Healthcare
  • Services
  • Contact
Main Logo
  • Home
  • About Us
  • Industries
    • Aerospace & Defense
    • Agriculture
    • Animal Nutrition & Wellness
    • Automotive
    • Chemicals & Materials
    • Consumer Goods and Services
    • Energy & Power
    • Financial Services and Investment Intelligence
    • Food & Beverage
    • Home and Property Improvement
    • Hospitality and Tourism
    • Logistics
    • Manufacturing Products and Services
    • Packaging
    • Professional and Commercial Services
    • Real Estate and Construction
    • Retail
    • Technology, Media and Telecom
    • Healthcare
  • Services
  • Contact
+17162654855
[email protected]

+17162654855

[email protected]