
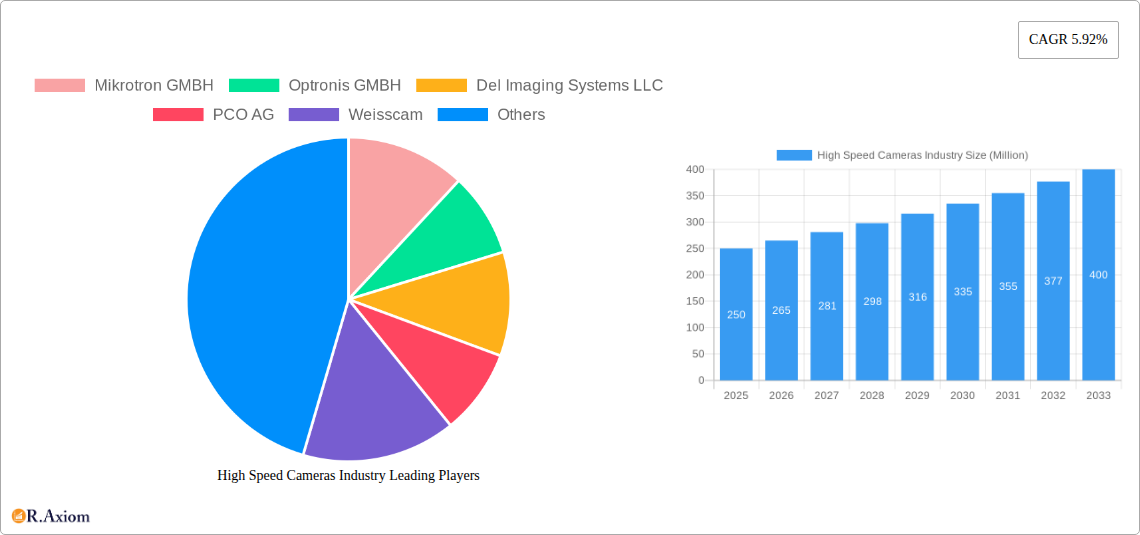
Key Insights
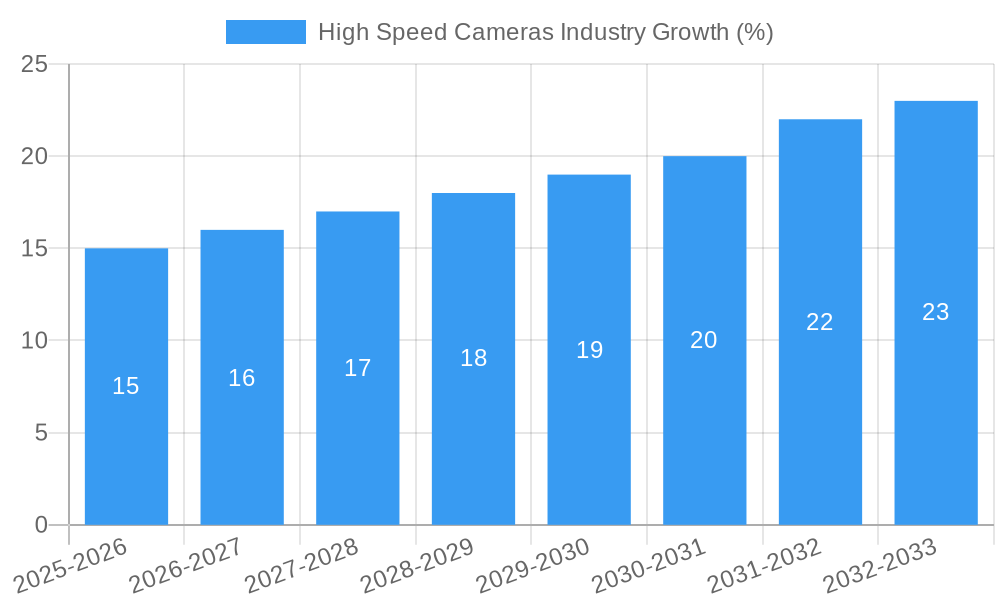
The high-speed camera market, currently valued at approximately $XX million in 2025, is projected to experience robust growth, exhibiting a Compound Annual Growth Rate (CAGR) of 5.92% from 2025 to 2033. This expansion is driven by several key factors. The increasing adoption of high-speed cameras across diverse sectors, including entertainment and media (driven by advancements in filmmaking and sports broadcasting), consumer electronics (with the rise of high-speed photography in smartphones), and industrial manufacturing (for quality control and process optimization) are major contributors. Further fueling this growth are advancements in sensor technology, leading to improved image resolution, sensitivity, and frame rates, along with miniaturization and cost reduction of components. The market is segmented by component (image sensors, lenses, batteries, memory systems), frame rate (ranging from 1,000 to over 100,000 fps), and application, with entertainment and media, and industrial manufacturing currently dominating market share. However, emerging applications in research and design, along with the expanding aerospace and defense sectors, are expected to significantly drive future market expansion. Competitive landscape analysis reveals key players like Mikrotron GMBH, Optronis GMBH, and Vision Research Inc., constantly innovating to meet the evolving demands of various applications. The geographical distribution of the market shows North America and Europe currently hold significant market shares, but Asia-Pacific is anticipated to experience substantial growth in the coming years, driven by increasing industrialization and technological advancements within the region.
The restraints to market growth primarily stem from the high initial investment cost associated with high-speed cameras, particularly those with extremely high frame rates and advanced features. The complexity of the technology and the specialized expertise required for operation and maintenance also pose challenges. However, ongoing technological advancements are gradually addressing these issues, making high-speed cameras more accessible and user-friendly, thereby mitigating these restraints and paving the way for continued market expansion. The continued integration of sophisticated software for image processing and analysis will also unlock new applications and drive demand further. Therefore, the high-speed camera market is poised for substantial growth, driven by technological innovation, expanding applications, and increasing affordability.
High Speed Cameras Industry Market Report: 2019-2033
This comprehensive report provides a detailed analysis of the High Speed Cameras industry, offering invaluable insights for stakeholders, investors, and industry professionals. The report covers the period from 2019 to 2033, with a focus on the 2025-2033 forecast period. The global market size is projected to reach xx Million by 2033. This in-depth analysis encompasses market segmentation, key players, technological advancements, and growth drivers, providing a 360-degree view of this dynamic sector.
High Speed Cameras Industry Market Concentration & Innovation
The high-speed camera market exhibits a moderately concentrated landscape, with several major players commanding significant market share. While precise market share data for each company requires proprietary research, key players like Vision Research Inc., Photron LTD, and Mikrotron GMBH are estimated to collectively hold over xx% of the market. The industry is characterized by continuous innovation driven by advancements in image sensor technology (CMOS and CCD), lens design, and data processing capabilities.
Regulatory frameworks, particularly those related to data privacy and export controls, play a significant role, especially in military and defense applications. Product substitutes, such as traditional video cameras with high frame rates or specialized imaging techniques, offer limited competition due to the unique capabilities of high-speed cameras. End-user trends lean towards higher resolution, faster frame rates, and increased ease of use. M&A activity in the sector has been relatively moderate in recent years, with deal values typically ranging from xx Million to xx Million, reflecting a focus on strategic acquisitions to enhance technology or expand market reach.
- Key Players: Vision Research Inc., Photron LTD, Mikrotron GMBH, and others.
- Estimated Market Share (Top 3): xx%
- Average M&A Deal Value: xx Million - xx Million
High Speed Cameras Industry Industry Trends & Insights
The high-speed camera industry is experiencing robust growth, driven by increasing demand across various sectors. The Compound Annual Growth Rate (CAGR) during the forecast period (2025-2033) is projected to be xx%, fueled by technological advancements, such as improved sensor sensitivity, higher frame rates, and increased storage capacities. The market penetration of high-speed cameras is expanding rapidly, particularly in applications requiring precise analysis of fast-moving objects or events. Consumer preferences are shifting towards more compact, user-friendly, and cost-effective solutions while maintaining high-performance capabilities. Competitive dynamics are intense, with companies focusing on differentiation through innovative features, enhanced software solutions, and strategic partnerships. The ongoing miniaturization of high-speed cameras is also a major trend, making them increasingly adaptable to various applications.
Dominant Markets & Segments in High Speed Cameras Industry
The North American region currently holds a dominant position in the high-speed camera market, driven by strong demand from the aerospace, defense, and research sectors. However, the Asia-Pacific region is expected to witness significant growth in the coming years, fueled by expanding industrial manufacturing and consumer electronics industries.
- Dominant Region: North America
- Fastest Growing Region: Asia-Pacific
By Component: The image sensor segment constitutes the largest share of the market, followed by lens and memory systems. The high cost of advanced image sensors is a key factor.
By Frame Rate: The 5,001-20,000 fps segment currently holds the largest market share due to its suitability for a wide range of applications. However, the >100,000 fps segment is anticipated to witness the fastest growth due to its applications in specialized scientific and industrial research.
By Application: The industrial manufacturing, research & design, and military & defense sectors are the leading application segments for high-speed cameras, driven by their crucial role in quality control, product development, and security.
- Key Drivers (Regional): Strong economic growth, robust infrastructure development, and government support for technological advancements (varies by region).
High Speed Cameras Industry Product Developments
Recent product innovations highlight a trend toward increased resolution, faster frame rates, and improved ease of use. Companies are also incorporating advanced features such as integrated data processing and analysis capabilities. The development of more compact and portable high-speed cameras is expanding their applicability across diverse sectors. These advancements cater to the growing need for precise visual data acquisition across a broad range of industries.
Report Scope & Segmentation Analysis
This report provides a comprehensive segmentation of the high-speed camera market across various parameters:
- By Component: Image Sensors, Lens, Battery, Memory Systems. Each segment's growth is analyzed considering technological advancements, pricing dynamics, and market competition.
- By Frame Rate: 1,000-5,000 fps, 5,001-20,000 fps, 20,001-100,000 fps, Greater than 100,000 fps. Each segment is assessed based on its application specificities and growth potential.
- By Application: Entertainment & Media, Sports, Consumer Electronics, Research & Design, Industrial Manufacturing, Military & Defense, Aerospace, Other Applications. Market size and growth projections are provided for each application segment.
The competitive landscape is analyzed within each segment, highlighting key players and their market strategies.
Key Drivers of High Speed Cameras Industry Growth
Several factors drive the growth of the high-speed camera industry. Technological advancements in sensor technology, leading to higher resolution and frame rates, are a major driver. The increasing demand for improved quality control and process optimization in various industries, particularly manufacturing and research, further fuels growth. Government investments in research and development, particularly in defense and aerospace, are also significant contributors.
Challenges in the High Speed Cameras Industry Sector
The high-speed camera industry faces challenges including the high cost of advanced cameras, which can restrict accessibility for smaller businesses. Supply chain disruptions, especially for specialized components, can negatively impact production and delivery. Intense competition from established players and new entrants necessitates continuous innovation and differentiation. These challenges can lead to fluctuations in market growth and profitability.
Emerging Opportunities in High Speed Cameras Industry
Emerging opportunities exist in the integration of high-speed cameras with advanced analytics and AI capabilities. The growing demand for high-speed cameras in new sectors like medical imaging and automotive testing represents untapped market potential. The development of more compact, energy-efficient, and cost-effective solutions will further expand market reach and adoption.
Leading Players in the High Speed Cameras Industry Market
- Mikrotron GMBH
- Optronis GMBH
- Del Imaging Systems LLC
- PCO AG
- Weisscam
- Photron LTD
- NAC Image Technology
- Ix-Cameras Inc
- Vision Research Inc
- Olympus Corporation
- Motion Capture Technologies
Key Developments in High Speed Cameras Industry Industry
- February 2022: OM Digital Solutions launched the OM System OM-1, featuring a high-frame-rate sensor impacting the consumer and professional markets.
- March 2022: Photron USA introduced the Fastcam Nova R5-4K, a high-speed 4K camera, significantly improving 4K capabilities and impacting the high-end market.
- April 2022: Vision Research's Phantom VEO 610 expanded access to high-speed cameras, affecting the entry-level market.
Strategic Outlook for High Speed Cameras Industry Market
The future of the high-speed camera market appears bright, with significant growth potential driven by continuous technological advancements and expanding applications. The integration of artificial intelligence and machine learning will further enhance the capabilities and value proposition of high-speed cameras. Strategic partnerships and collaborations between companies will be key to driving innovation and expanding market reach.
High Speed Cameras Industry Segmentation
-
1. Component
- 1.1. Image Sensors
- 1.2. Lens
- 1.3. Battery
- 1.4. Memory Systems
-
2. Frame Rate
- 2.1. 1,000-5,000
- 2.2. 5,001-20,000
- 2.3. 20,001-100,000
- 2.4. Greater Than 100,000
-
3. Application
- 3.1. Entertainment & Media
- 3.2. Sports
- 3.3. Consumer Electronics
- 3.4. Research & Design
- 3.5. Industrial Manufacturing
- 3.6. Military & Defense
- 3.7. Aerospace
- 3.8. Other Applications
High Speed Cameras Industry Segmentation By Geography
-
1. North America
- 1.1. United States
- 1.2. Canada
-
2. Europe
- 2.1. United Kingdom
- 2.2. Germany
- 2.3. France
- 2.4. Rest of Europe
-
3. Asia Pacific
- 3.1. China
- 3.2. Japan
- 3.3. India
- 3.4. Rest of Asia Pacific
-
4. Rest of the World
- 4.1. Latin America
- 4.2. Middle East

High Speed Cameras Industry REPORT HIGHLIGHTS
| Aspects | Details |
|---|---|
| Study Period | 2019-2033 |
| Base Year | 2024 |
| Estimated Year | 2025 |
| Forecast Period | 2025-2033 |
| Historical Period | 2019-2024 |
| Growth Rate | CAGR of 5.92% from 2019-2033 |
| Segmentation |
|
Table of Contents
- 1. Introduction
- 1.1. Research Scope
- 1.2. Market Segmentation
- 1.3. Research Methodology
- 1.4. Definitions and Assumptions
- 2. Executive Summary
- 2.1. Introduction
- 3. Market Dynamics
- 3.1. Introduction
- 3.2. Market Drivers
- 3.2.1. Increasing Adoption of High Speed Camera in Manufacturing Sector
- 3.3. Market Restrains
- 3.3.1. High Cost of High Speed Cameras
- 3.4. Market Trends
- 3.4.1. Intelligent Transportation Systems Initiative to Drive the Market
- 4. Market Factor Analysis
- 4.1. Porters Five Forces
- 4.2. Supply/Value Chain
- 4.3. PESTEL analysis
- 4.4. Market Entropy
- 4.5. Patent/Trademark Analysis
- 5. Global High Speed Cameras Industry Analysis, Insights and Forecast, 2019-2031
- 5.1. Market Analysis, Insights and Forecast - by Component
- 5.1.1. Image Sensors
- 5.1.2. Lens
- 5.1.3. Battery
- 5.1.4. Memory Systems
- 5.2. Market Analysis, Insights and Forecast - by Frame Rate
- 5.2.1. 1,000-5,000
- 5.2.2. 5,001-20,000
- 5.2.3. 20,001-100,000
- 5.2.4. Greater Than 100,000
- 5.3. Market Analysis, Insights and Forecast - by Application
- 5.3.1. Entertainment & Media
- 5.3.2. Sports
- 5.3.3. Consumer Electronics
- 5.3.4. Research & Design
- 5.3.5. Industrial Manufacturing
- 5.3.6. Military & Defense
- 5.3.7. Aerospace
- 5.3.8. Other Applications
- 5.4. Market Analysis, Insights and Forecast - by Region
- 5.4.1. North America
- 5.4.2. Europe
- 5.4.3. Asia Pacific
- 5.4.4. Rest of the World
- 5.1. Market Analysis, Insights and Forecast - by Component
- 6. North America High Speed Cameras Industry Analysis, Insights and Forecast, 2019-2031
- 6.1. Market Analysis, Insights and Forecast - by Component
- 6.1.1. Image Sensors
- 6.1.2. Lens
- 6.1.3. Battery
- 6.1.4. Memory Systems
- 6.2. Market Analysis, Insights and Forecast - by Frame Rate
- 6.2.1. 1,000-5,000
- 6.2.2. 5,001-20,000
- 6.2.3. 20,001-100,000
- 6.2.4. Greater Than 100,000
- 6.3. Market Analysis, Insights and Forecast - by Application
- 6.3.1. Entertainment & Media
- 6.3.2. Sports
- 6.3.3. Consumer Electronics
- 6.3.4. Research & Design
- 6.3.5. Industrial Manufacturing
- 6.3.6. Military & Defense
- 6.3.7. Aerospace
- 6.3.8. Other Applications
- 6.1. Market Analysis, Insights and Forecast - by Component
- 7. Europe High Speed Cameras Industry Analysis, Insights and Forecast, 2019-2031
- 7.1. Market Analysis, Insights and Forecast - by Component
- 7.1.1. Image Sensors
- 7.1.2. Lens
- 7.1.3. Battery
- 7.1.4. Memory Systems
- 7.2. Market Analysis, Insights and Forecast - by Frame Rate
- 7.2.1. 1,000-5,000
- 7.2.2. 5,001-20,000
- 7.2.3. 20,001-100,000
- 7.2.4. Greater Than 100,000
- 7.3. Market Analysis, Insights and Forecast - by Application
- 7.3.1. Entertainment & Media
- 7.3.2. Sports
- 7.3.3. Consumer Electronics
- 7.3.4. Research & Design
- 7.3.5. Industrial Manufacturing
- 7.3.6. Military & Defense
- 7.3.7. Aerospace
- 7.3.8. Other Applications
- 7.1. Market Analysis, Insights and Forecast - by Component
- 8. Asia Pacific High Speed Cameras Industry Analysis, Insights and Forecast, 2019-2031
- 8.1. Market Analysis, Insights and Forecast - by Component
- 8.1.1. Image Sensors
- 8.1.2. Lens
- 8.1.3. Battery
- 8.1.4. Memory Systems
- 8.2. Market Analysis, Insights and Forecast - by Frame Rate
- 8.2.1. 1,000-5,000
- 8.2.2. 5,001-20,000
- 8.2.3. 20,001-100,000
- 8.2.4. Greater Than 100,000
- 8.3. Market Analysis, Insights and Forecast - by Application
- 8.3.1. Entertainment & Media
- 8.3.2. Sports
- 8.3.3. Consumer Electronics
- 8.3.4. Research & Design
- 8.3.5. Industrial Manufacturing
- 8.3.6. Military & Defense
- 8.3.7. Aerospace
- 8.3.8. Other Applications
- 8.1. Market Analysis, Insights and Forecast - by Component
- 9. Rest of the World High Speed Cameras Industry Analysis, Insights and Forecast, 2019-2031
- 9.1. Market Analysis, Insights and Forecast - by Component
- 9.1.1. Image Sensors
- 9.1.2. Lens
- 9.1.3. Battery
- 9.1.4. Memory Systems
- 9.2. Market Analysis, Insights and Forecast - by Frame Rate
- 9.2.1. 1,000-5,000
- 9.2.2. 5,001-20,000
- 9.2.3. 20,001-100,000
- 9.2.4. Greater Than 100,000
- 9.3. Market Analysis, Insights and Forecast - by Application
- 9.3.1. Entertainment & Media
- 9.3.2. Sports
- 9.3.3. Consumer Electronics
- 9.3.4. Research & Design
- 9.3.5. Industrial Manufacturing
- 9.3.6. Military & Defense
- 9.3.7. Aerospace
- 9.3.8. Other Applications
- 9.1. Market Analysis, Insights and Forecast - by Component
- 10. North America High Speed Cameras Industry Analysis, Insights and Forecast, 2019-2031
- 10.1. Market Analysis, Insights and Forecast - By Country/Sub-region
- 10.1.1 United States
- 10.1.2 Canada
- 11. Europe High Speed Cameras Industry Analysis, Insights and Forecast, 2019-2031
- 11.1. Market Analysis, Insights and Forecast - By Country/Sub-region
- 11.1.1 United Kingdom
- 11.1.2 Germany
- 11.1.3 France
- 11.1.4 Rest of Europe
- 12. Asia Pacific High Speed Cameras Industry Analysis, Insights and Forecast, 2019-2031
- 12.1. Market Analysis, Insights and Forecast - By Country/Sub-region
- 12.1.1 China
- 12.1.2 Japan
- 12.1.3 India
- 12.1.4 Rest of Asia Pacific
- 13. Rest of the World High Speed Cameras Industry Analysis, Insights and Forecast, 2019-2031
- 13.1. Market Analysis, Insights and Forecast - By Country/Sub-region
- 13.1.1 Latin America
- 13.1.2 Middle East
- 14. Competitive Analysis
- 14.1. Global Market Share Analysis 2024
- 14.2. Company Profiles
- 14.2.1 Mikrotron GMBH
- 14.2.1.1. Overview
- 14.2.1.2. Products
- 14.2.1.3. SWOT Analysis
- 14.2.1.4. Recent Developments
- 14.2.1.5. Financials (Based on Availability)
- 14.2.2 Optronis GMBH
- 14.2.2.1. Overview
- 14.2.2.2. Products
- 14.2.2.3. SWOT Analysis
- 14.2.2.4. Recent Developments
- 14.2.2.5. Financials (Based on Availability)
- 14.2.3 Del Imaging Systems LLC
- 14.2.3.1. Overview
- 14.2.3.2. Products
- 14.2.3.3. SWOT Analysis
- 14.2.3.4. Recent Developments
- 14.2.3.5. Financials (Based on Availability)
- 14.2.4 PCO AG
- 14.2.4.1. Overview
- 14.2.4.2. Products
- 14.2.4.3. SWOT Analysis
- 14.2.4.4. Recent Developments
- 14.2.4.5. Financials (Based on Availability)
- 14.2.5 Weisscam
- 14.2.5.1. Overview
- 14.2.5.2. Products
- 14.2.5.3. SWOT Analysis
- 14.2.5.4. Recent Developments
- 14.2.5.5. Financials (Based on Availability)
- 14.2.6 Photron LTD
- 14.2.6.1. Overview
- 14.2.6.2. Products
- 14.2.6.3. SWOT Analysis
- 14.2.6.4. Recent Developments
- 14.2.6.5. Financials (Based on Availability)
- 14.2.7 NAC Image Technology
- 14.2.7.1. Overview
- 14.2.7.2. Products
- 14.2.7.3. SWOT Analysis
- 14.2.7.4. Recent Developments
- 14.2.7.5. Financials (Based on Availability)
- 14.2.8 Ix-Cameras Inc *List Not Exhaustive
- 14.2.8.1. Overview
- 14.2.8.2. Products
- 14.2.8.3. SWOT Analysis
- 14.2.8.4. Recent Developments
- 14.2.8.5. Financials (Based on Availability)
- 14.2.9 Vision Research Inc
- 14.2.9.1. Overview
- 14.2.9.2. Products
- 14.2.9.3. SWOT Analysis
- 14.2.9.4. Recent Developments
- 14.2.9.5. Financials (Based on Availability)
- 14.2.10 Olympus Corporation
- 14.2.10.1. Overview
- 14.2.10.2. Products
- 14.2.10.3. SWOT Analysis
- 14.2.10.4. Recent Developments
- 14.2.10.5. Financials (Based on Availability)
- 14.2.11 Motion Capture Technologies
- 14.2.11.1. Overview
- 14.2.11.2. Products
- 14.2.11.3. SWOT Analysis
- 14.2.11.4. Recent Developments
- 14.2.11.5. Financials (Based on Availability)
- 14.2.1 Mikrotron GMBH
List of Figures
- Figure 1: Global High Speed Cameras Industry Revenue Breakdown (Million, %) by Region 2024 & 2032
- Figure 2: North America High Speed Cameras Industry Revenue (Million), by Country 2024 & 2032
- Figure 3: North America High Speed Cameras Industry Revenue Share (%), by Country 2024 & 2032
- Figure 4: Europe High Speed Cameras Industry Revenue (Million), by Country 2024 & 2032
- Figure 5: Europe High Speed Cameras Industry Revenue Share (%), by Country 2024 & 2032
- Figure 6: Asia Pacific High Speed Cameras Industry Revenue (Million), by Country 2024 & 2032
- Figure 7: Asia Pacific High Speed Cameras Industry Revenue Share (%), by Country 2024 & 2032
- Figure 8: Rest of the World High Speed Cameras Industry Revenue (Million), by Country 2024 & 2032
- Figure 9: Rest of the World High Speed Cameras Industry Revenue Share (%), by Country 2024 & 2032
- Figure 10: North America High Speed Cameras Industry Revenue (Million), by Component 2024 & 2032
- Figure 11: North America High Speed Cameras Industry Revenue Share (%), by Component 2024 & 2032
- Figure 12: North America High Speed Cameras Industry Revenue (Million), by Frame Rate 2024 & 2032
- Figure 13: North America High Speed Cameras Industry Revenue Share (%), by Frame Rate 2024 & 2032
- Figure 14: North America High Speed Cameras Industry Revenue (Million), by Application 2024 & 2032
- Figure 15: North America High Speed Cameras Industry Revenue Share (%), by Application 2024 & 2032
- Figure 16: North America High Speed Cameras Industry Revenue (Million), by Country 2024 & 2032
- Figure 17: North America High Speed Cameras Industry Revenue Share (%), by Country 2024 & 2032
- Figure 18: Europe High Speed Cameras Industry Revenue (Million), by Component 2024 & 2032
- Figure 19: Europe High Speed Cameras Industry Revenue Share (%), by Component 2024 & 2032
- Figure 20: Europe High Speed Cameras Industry Revenue (Million), by Frame Rate 2024 & 2032
- Figure 21: Europe High Speed Cameras Industry Revenue Share (%), by Frame Rate 2024 & 2032
- Figure 22: Europe High Speed Cameras Industry Revenue (Million), by Application 2024 & 2032
- Figure 23: Europe High Speed Cameras Industry Revenue Share (%), by Application 2024 & 2032
- Figure 24: Europe High Speed Cameras Industry Revenue (Million), by Country 2024 & 2032
- Figure 25: Europe High Speed Cameras Industry Revenue Share (%), by Country 2024 & 2032
- Figure 26: Asia Pacific High Speed Cameras Industry Revenue (Million), by Component 2024 & 2032
- Figure 27: Asia Pacific High Speed Cameras Industry Revenue Share (%), by Component 2024 & 2032
- Figure 28: Asia Pacific High Speed Cameras Industry Revenue (Million), by Frame Rate 2024 & 2032
- Figure 29: Asia Pacific High Speed Cameras Industry Revenue Share (%), by Frame Rate 2024 & 2032
- Figure 30: Asia Pacific High Speed Cameras Industry Revenue (Million), by Application 2024 & 2032
- Figure 31: Asia Pacific High Speed Cameras Industry Revenue Share (%), by Application 2024 & 2032
- Figure 32: Asia Pacific High Speed Cameras Industry Revenue (Million), by Country 2024 & 2032
- Figure 33: Asia Pacific High Speed Cameras Industry Revenue Share (%), by Country 2024 & 2032
- Figure 34: Rest of the World High Speed Cameras Industry Revenue (Million), by Component 2024 & 2032
- Figure 35: Rest of the World High Speed Cameras Industry Revenue Share (%), by Component 2024 & 2032
- Figure 36: Rest of the World High Speed Cameras Industry Revenue (Million), by Frame Rate 2024 & 2032
- Figure 37: Rest of the World High Speed Cameras Industry Revenue Share (%), by Frame Rate 2024 & 2032
- Figure 38: Rest of the World High Speed Cameras Industry Revenue (Million), by Application 2024 & 2032
- Figure 39: Rest of the World High Speed Cameras Industry Revenue Share (%), by Application 2024 & 2032
- Figure 40: Rest of the World High Speed Cameras Industry Revenue (Million), by Country 2024 & 2032
- Figure 41: Rest of the World High Speed Cameras Industry Revenue Share (%), by Country 2024 & 2032
List of Tables
- Table 1: Global High Speed Cameras Industry Revenue Million Forecast, by Region 2019 & 2032
- Table 2: Global High Speed Cameras Industry Revenue Million Forecast, by Component 2019 & 2032
- Table 3: Global High Speed Cameras Industry Revenue Million Forecast, by Frame Rate 2019 & 2032
- Table 4: Global High Speed Cameras Industry Revenue Million Forecast, by Application 2019 & 2032
- Table 5: Global High Speed Cameras Industry Revenue Million Forecast, by Region 2019 & 2032
- Table 6: Global High Speed Cameras Industry Revenue Million Forecast, by Country 2019 & 2032
- Table 7: United States High Speed Cameras Industry Revenue (Million) Forecast, by Application 2019 & 2032
- Table 8: Canada High Speed Cameras Industry Revenue (Million) Forecast, by Application 2019 & 2032
- Table 9: Global High Speed Cameras Industry Revenue Million Forecast, by Country 2019 & 2032
- Table 10: United Kingdom High Speed Cameras Industry Revenue (Million) Forecast, by Application 2019 & 2032
- Table 11: Germany High Speed Cameras Industry Revenue (Million) Forecast, by Application 2019 & 2032
- Table 12: France High Speed Cameras Industry Revenue (Million) Forecast, by Application 2019 & 2032
- Table 13: Rest of Europe High Speed Cameras Industry Revenue (Million) Forecast, by Application 2019 & 2032
- Table 14: Global High Speed Cameras Industry Revenue Million Forecast, by Country 2019 & 2032
- Table 15: China High Speed Cameras Industry Revenue (Million) Forecast, by Application 2019 & 2032
- Table 16: Japan High Speed Cameras Industry Revenue (Million) Forecast, by Application 2019 & 2032
- Table 17: India High Speed Cameras Industry Revenue (Million) Forecast, by Application 2019 & 2032
- Table 18: Rest of Asia Pacific High Speed Cameras Industry Revenue (Million) Forecast, by Application 2019 & 2032
- Table 19: Global High Speed Cameras Industry Revenue Million Forecast, by Country 2019 & 2032
- Table 20: Latin America High Speed Cameras Industry Revenue (Million) Forecast, by Application 2019 & 2032
- Table 21: Middle East High Speed Cameras Industry Revenue (Million) Forecast, by Application 2019 & 2032
- Table 22: Global High Speed Cameras Industry Revenue Million Forecast, by Component 2019 & 2032
- Table 23: Global High Speed Cameras Industry Revenue Million Forecast, by Frame Rate 2019 & 2032
- Table 24: Global High Speed Cameras Industry Revenue Million Forecast, by Application 2019 & 2032
- Table 25: Global High Speed Cameras Industry Revenue Million Forecast, by Country 2019 & 2032
- Table 26: United States High Speed Cameras Industry Revenue (Million) Forecast, by Application 2019 & 2032
- Table 27: Canada High Speed Cameras Industry Revenue (Million) Forecast, by Application 2019 & 2032
- Table 28: Global High Speed Cameras Industry Revenue Million Forecast, by Component 2019 & 2032
- Table 29: Global High Speed Cameras Industry Revenue Million Forecast, by Frame Rate 2019 & 2032
- Table 30: Global High Speed Cameras Industry Revenue Million Forecast, by Application 2019 & 2032
- Table 31: Global High Speed Cameras Industry Revenue Million Forecast, by Country 2019 & 2032
- Table 32: United Kingdom High Speed Cameras Industry Revenue (Million) Forecast, by Application 2019 & 2032
- Table 33: Germany High Speed Cameras Industry Revenue (Million) Forecast, by Application 2019 & 2032
- Table 34: France High Speed Cameras Industry Revenue (Million) Forecast, by Application 2019 & 2032
- Table 35: Rest of Europe High Speed Cameras Industry Revenue (Million) Forecast, by Application 2019 & 2032
- Table 36: Global High Speed Cameras Industry Revenue Million Forecast, by Component 2019 & 2032
- Table 37: Global High Speed Cameras Industry Revenue Million Forecast, by Frame Rate 2019 & 2032
- Table 38: Global High Speed Cameras Industry Revenue Million Forecast, by Application 2019 & 2032
- Table 39: Global High Speed Cameras Industry Revenue Million Forecast, by Country 2019 & 2032
- Table 40: China High Speed Cameras Industry Revenue (Million) Forecast, by Application 2019 & 2032
- Table 41: Japan High Speed Cameras Industry Revenue (Million) Forecast, by Application 2019 & 2032
- Table 42: India High Speed Cameras Industry Revenue (Million) Forecast, by Application 2019 & 2032
- Table 43: Rest of Asia Pacific High Speed Cameras Industry Revenue (Million) Forecast, by Application 2019 & 2032
- Table 44: Global High Speed Cameras Industry Revenue Million Forecast, by Component 2019 & 2032
- Table 45: Global High Speed Cameras Industry Revenue Million Forecast, by Frame Rate 2019 & 2032
- Table 46: Global High Speed Cameras Industry Revenue Million Forecast, by Application 2019 & 2032
- Table 47: Global High Speed Cameras Industry Revenue Million Forecast, by Country 2019 & 2032
- Table 48: Latin America High Speed Cameras Industry Revenue (Million) Forecast, by Application 2019 & 2032
- Table 49: Middle East High Speed Cameras Industry Revenue (Million) Forecast, by Application 2019 & 2032
Frequently Asked Questions
1. What is the projected Compound Annual Growth Rate (CAGR) of the High Speed Cameras Industry?
The projected CAGR is approximately 5.92%.
2. Which companies are prominent players in the High Speed Cameras Industry?
Key companies in the market include Mikrotron GMBH, Optronis GMBH, Del Imaging Systems LLC, PCO AG, Weisscam, Photron LTD, NAC Image Technology, Ix-Cameras Inc *List Not Exhaustive, Vision Research Inc, Olympus Corporation, Motion Capture Technologies.
3. What are the main segments of the High Speed Cameras Industry?
The market segments include Component, Frame Rate, Application.
4. Can you provide details about the market size?
The market size is estimated to be USD XX Million as of 2022.
5. What are some drivers contributing to market growth?
Increasing Adoption of High Speed Camera in Manufacturing Sector.
6. What are the notable trends driving market growth?
Intelligent Transportation Systems Initiative to Drive the Market.
7. Are there any restraints impacting market growth?
High Cost of High Speed Cameras.
8. Can you provide examples of recent developments in the market?
April 2022: The Phantom VEO 610 is Vision Study's latest "entry-level" high-speed camera. The camera has a maximum refresh speed of 218.970 fps in 320 x 12 and can record in HD 720p at 7420 pictures per second.
9. What pricing options are available for accessing the report?
Pricing options include single-user, multi-user, and enterprise licenses priced at USD 4750, USD 5250, and USD 8750 respectively.
10. Is the market size provided in terms of value or volume?
The market size is provided in terms of value, measured in Million.
11. Are there any specific market keywords associated with the report?
Yes, the market keyword associated with the report is "High Speed Cameras Industry," which aids in identifying and referencing the specific market segment covered.
12. How do I determine which pricing option suits my needs best?
The pricing options vary based on user requirements and access needs. Individual users may opt for single-user licenses, while businesses requiring broader access may choose multi-user or enterprise licenses for cost-effective access to the report.
13. Are there any additional resources or data provided in the High Speed Cameras Industry report?
While the report offers comprehensive insights, it's advisable to review the specific contents or supplementary materials provided to ascertain if additional resources or data are available.
14. How can I stay updated on further developments or reports in the High Speed Cameras Industry?
To stay informed about further developments, trends, and reports in the High Speed Cameras Industry, consider subscribing to industry newsletters, following relevant companies and organizations, or regularly checking reputable industry news sources and publications.
Methodology
Step 1 - Identification of Relevant Samples Size from Population Database


Step 2 - Approaches for Defining Global Market Size (Value, Volume* & Price*)

Note*: In applicable scenarios
Step 3 - Data Sources
Primary Research
- Web Analytics
- Survey Reports
- Research Institute
- Latest Research Reports
- Opinion Leaders
Secondary Research
- Annual Reports
- White Paper
- Latest Press Release
- Industry Association
- Paid Database
- Investor Presentations

Step 4 - Data Triangulation
Involves using different sources of information in order to increase the validity of a study
These sources are likely to be stakeholders in a program - participants, other researchers, program staff, other community members, and so on.
Then we put all data in single framework & apply various statistical tools to find out the dynamic on the market.
During the analysis stage, feedback from the stakeholder groups would be compared to determine areas of agreement as well as areas of divergence


