

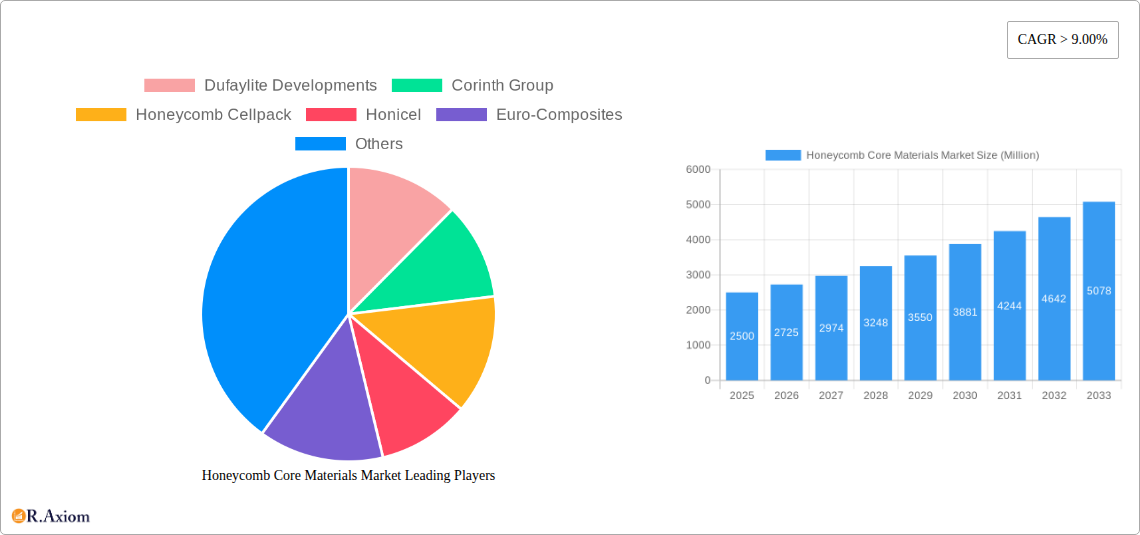
Key Insights
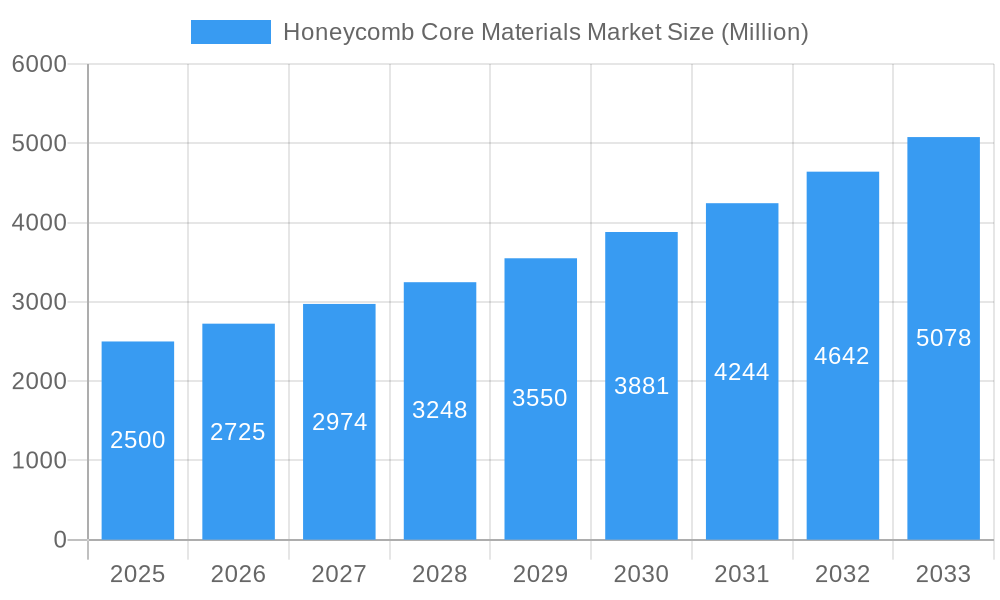
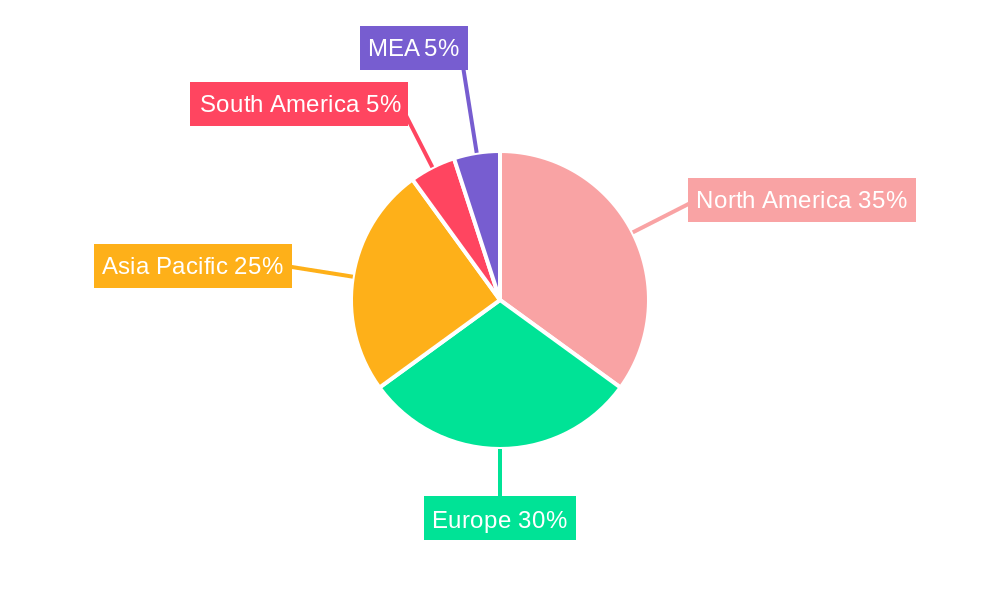
The Honeycomb Core Materials market is experiencing robust growth, projected to maintain a Compound Annual Growth Rate (CAGR) exceeding 9% from 2025 to 2033. This expansion is fueled by increasing demand across key sectors like aerospace and defense, driven by lightweighting initiatives in aircraft and spacecraft design. The rising adoption of honeycomb structures in marine applications, particularly in high-speed vessels and specialized boats, also contributes significantly. Furthermore, advancements in material science are leading to the development of novel honeycomb core materials, such as enhanced thermoplastic composites, offering improved strength-to-weight ratios and durability. This innovation is attracting interest from diverse end-user industries, including automotive and construction, expanding the market's overall potential. The market segmentation, comprising Nomex, Aluminum, Thermoplastics, and other materials, reflects the diversity of applications and material choices available. The geographical spread is broad, with North America and Europe currently holding significant market shares, while the Asia-Pacific region is expected to witness substantial growth in the coming years, driven by increased manufacturing activities and infrastructure development. Competition among established players like Hexcel Corporation and emerging companies is intense, fostering innovation and driving price competitiveness.
Honeycomb Core Materials Market Market Size (In Billion)
However, the market faces certain restraints. High manufacturing costs associated with advanced honeycomb core materials can limit adoption in price-sensitive sectors. Furthermore, supply chain disruptions and fluctuations in raw material prices pose challenges for manufacturers. Despite these factors, the long-term outlook for the Honeycomb Core Materials market remains positive, underpinned by ongoing technological advancements, expanding application areas, and the growing emphasis on lightweight and high-performance materials across various industries. The market's evolution will continue to be shaped by factors such as material innovation, regulatory compliance, and the emergence of sustainable alternatives. The key to success for market players lies in delivering high-quality products that meet specific industry requirements and adapting to evolving technological landscapes.
Honeycomb Core Materials Market Company Market Share
This in-depth report provides a comprehensive analysis of the Honeycomb Core Materials market, offering invaluable insights for industry stakeholders, investors, and strategic decision-makers. Spanning the period from 2019 to 2033, with a focus on 2025 as the base and estimated year, this report meticulously examines market dynamics, growth drivers, challenges, and emerging opportunities within this crucial sector. The study covers key segments, including various product types and end-user industries, while profiling leading players and their strategic initiatives.
Honeycomb Core Materials Market Concentration & Innovation
The Honeycomb Core Materials market exhibits a moderately concentrated landscape, with a handful of key players holding significant market share. Precise market share figures require further proprietary data analysis, but Hexcel Corporation, Koninklijke Ten Cate BV, and Thermhex Waben GmbH are consistently recognized as major players. The market is characterized by ongoing innovation driven by the need for lighter, stronger, and more cost-effective materials in diverse applications. Regulatory frameworks, particularly those concerning environmental sustainability and material safety, significantly influence market dynamics. Product substitutes, such as foam cores and other lightweight composites, present competitive pressure, requiring continuous innovation in material properties and manufacturing processes. End-user trends toward lightweighting and improved performance in aerospace, automotive, and construction drive market demand. Mergers and acquisitions (M&A) activities have played a role in shaping market concentration; however, precise deal values for recent M&A activity in this space are not publicly available. Further investigation would be needed for quantification. For example, the recent partnerships, like the one between Hexcel Corp. and Metyx Composites, demonstrate strategic moves to expand product offerings and market reach.
Honeycomb Core Materials Market Industry Trends & Insights
The global Honeycomb Core Materials market is experiencing robust growth, projected to reach xx Million by 2033. The Compound Annual Growth Rate (CAGR) during the forecast period (2025-2033) is estimated at xx%. Several factors contribute to this growth trajectory. Technological advancements, particularly in material science and manufacturing processes, enable the creation of high-performance honeycomb cores with enhanced properties like improved strength-to-weight ratios and durability. The growing demand for lightweight materials across diverse industries, such as aerospace and automotive, fuels market expansion. Consumer preferences for sustainable and environmentally friendly materials are driving adoption of honeycomb cores made from recycled or renewable materials. Competitive dynamics are shaping market strategies, with manufacturers investing in research and development to enhance product features, expand their product portfolio and tap into new markets. Market penetration varies across different end-user industries, with the aerospace sector currently leading in adoption. Increased adoption in other industries like construction and marine applications signifies substantial growth potential for the future.
Dominant Markets & Segments in Honeycomb Core Materials Market
The aerospace industry is currently the dominant end-user segment for honeycomb core materials, followed closely by defense. Within product types, aluminum honeycomb cores maintain a significant market share due to their cost-effectiveness and established applications. However, Nomex and thermoplastic honeycomb cores are gaining traction due to their superior performance characteristics in specialized applications.
Key Drivers for Dominant Segments:
- Aerospace: Demand for lightweight and high-strength materials in aircraft construction.
- Defense: Need for robust and durable materials in military vehicles and equipment.
- Aluminum Honeycomb Cores: Cost-effectiveness and wide range of applications.
- Nomex Honeycomb Cores: Superior strength, thermal resistance, and fire safety in specialized applications.
- Thermoplastic Honeycomb Cores: Ease of processing, design flexibility, and recyclability.
Geographic Dominance: North America and Europe currently hold the largest market share, primarily driven by robust aerospace and defense industries in these regions. However, Asia-Pacific is demonstrating significant growth potential, fueled by expanding manufacturing sectors and increasing infrastructure investments.
Honeycomb Core Materials Market Product Developments
Recent innovations in honeycomb core materials focus on enhancing performance characteristics, cost-effectiveness, and sustainability. The development of FITS Air technology and similar advancements reflect a trend toward higher technology readiness levels (TRL). The use of advanced materials like carbon fiber, coupled with innovative manufacturing techniques, results in lighter, stronger, and more durable products. These technological advancements allow for the expansion of honeycomb core materials into new applications, enhancing their market competitiveness.
Report Scope & Segmentation Analysis
This report segments the Honeycomb Core Materials market based on product type (Nomex, Aluminum, Thermoplastics, Other) and end-user industry (Aerospace, Defense, Marine, Other). Each segment is analyzed in detail, providing growth projections, market size estimations (in Million), and competitive dynamics for the historical period (2019-2024), the base year (2025), and the forecast period (2025-2033). For example, the aerospace segment is expected to exhibit significant growth driven by the increasing demand for lightweight aircraft and space vehicles. The aluminum honeycomb core segment will likely remain dominant, however, the other segments are expected to exhibit higher growth rates.
Key Drivers of Honeycomb Core Materials Market Growth
Several factors are driving the growth of the Honeycomb Core Materials market:
- Technological advancements: Continuous innovations leading to improved material properties and manufacturing processes.
- Growing demand for lightweight materials: Increasing adoption across various sectors for weight reduction and performance enhancement.
- Rising investments in research and development: Significant R&D spending by key players to develop novel materials and applications.
- Stringent environmental regulations: Increased focus on reducing carbon emissions promotes the use of sustainable materials.
Challenges in the Honeycomb Core Materials Market Sector
Challenges facing the industry include:
- Fluctuations in raw material prices: Price volatility can impact manufacturing costs and profitability.
- Supply chain disruptions: Geopolitical events and unforeseen circumstances can disrupt supply chains, impacting production.
- Intense competition: The market is characterized by a number of significant players, resulting in competitive pricing pressures. This competition also impacts the ability to achieve significant pricing premiums on new innovations.
- Stringent safety and quality standards: Meeting regulatory requirements adds to production complexity and costs.
Emerging Opportunities in Honeycomb Core Materials Market
Several emerging trends offer significant growth opportunities:
- Expansion into new applications: Growing demand in sectors such as automotive and construction is expected to open new market avenues.
- Development of sustainable and eco-friendly materials: The use of recycled and renewable materials is gaining traction, leading to more sustainable products.
- Adoption of advanced manufacturing techniques: Technologies like 3D printing are opening up new possibilities for customized core structures.
- Focus on improving product performance and durability: Development of high-performance materials tailored to specific applications.
Leading Players in the Honeycomb Core Materials Market Market
- Dufaylite Developments
- Corinth Group
- Honeycomb Cellpack
- Honicel
- Euro-Composites
- Grigeo
- Thermhex Waben GmbH
- Samia Canada
- The Gill Corporation
- Hexcel Corporation
- Argosy International
- Koninklijke Ten Cate BV
- Packaging Corporation of America
- Axxion Group
- Tubus Baer GmbH
Key Developments in Honeycomb Core Materials Market Industry
- January 2022: FITS Air technology reaches TRL 6, demonstrating significant advancements in honeycomb core materials.
- December 2021: Hexcel Corp. and Metyx Composites partner to produce high-performance carbon fiber pultruded profiles for the wind energy sector, indicating expansion into new markets.
Strategic Outlook for Honeycomb Core Materials Market Market
The Honeycomb Core Materials market is poised for sustained growth driven by technological advancements, increasing demand for lightweight materials, and the expansion into new applications. Strategic investments in research and development, coupled with a focus on sustainability, will be crucial for success in this dynamic market. The continued development of high-performance materials, alongside the integration of innovative manufacturing techniques, promises to unlock new opportunities and drive significant market growth in the years to come.
Honeycomb Core Materials Market Segmentation
-
1. Product Type
- 1.1. Nomex
- 1.2. Aluminum
- 1.3. Thermoplastics
- 1.4. Other Product Types
-
2. End-user Industry
- 2.1. Aerospace
- 2.2. Defense
- 2.3. Marine
- 2.4. Other End-user Industries
Honeycomb Core Materials Market Segmentation By Geography
-
1. Asia Pacific
- 1.1. China
- 1.2. India
- 1.3. Japan
- 1.4. South Korea
- 1.5. Rest of Asia Pacific
-
2. North America
- 2.1. United States
- 2.2. Canada
- 2.3. Mexico
-
3. Europe
- 3.1. Germany
- 3.2. United Kingdom
- 3.3. Italy
- 3.4. France
- 3.5. Rest of Europe
-
4. South America
- 4.1. Brazil
- 4.2. Argentina
- 4.3. Rest of South America
-
5. Middle East and Africa
- 5.1. Saudi Arabia
- 5.2. South Africa
- 5.3. Rest of Middle East and Africa
Honeycomb Core Materials Market Regional Market Share
Geographic Coverage of Honeycomb Core Materials Market
Honeycomb Core Materials Market REPORT HIGHLIGHTS
| Aspects | Details |
|---|---|
| Study Period | 2020-2034 |
| Base Year | 2025 |
| Estimated Year | 2026 |
| Forecast Period | 2026-2034 |
| Historical Period | 2020-2025 |
| Growth Rate | CAGR of 9.63% from 2020-2034 |
| Segmentation |
|
Table of Contents
- 1. Introduction
- 1.1. Research Scope
- 1.2. Market Segmentation
- 1.3. Research Objective
- 1.4. Definitions and Assumptions
- 2. Executive Summary
- 2.1. Market Snapshot
- 3. Market Dynamics
- 3.1. Market Drivers
- 3.2. Market Restrains
- 3.3. Market Trends
- 3.4. Market Opportunities
- 4. Market Factor Analysis
- 4.1. Porters Five Forces
- 4.1.1. Bargaining Power of Suppliers
- 4.1.2. Bargaining Power of Buyers
- 4.1.3. Threat of New Entrants
- 4.1.4. Threat of Substitutes
- 4.1.5. Competitive Rivalry
- 4.2. PESTEL analysis
- 4.3. BCG Analysis
- 4.3.1. Stars (High Growth, High Market Share)
- 4.3.2. Cash Cows (Low Growth, High Market Share)
- 4.3.3. Question Mark (High Growth, Low Market Share)
- 4.3.4. Dogs (Low Growth, Low Market Share)
- 4.4. Ansoff Matrix Analysis
- 4.5. Supply Chain Analysis
- 4.6. Regulatory Landscape
- 4.7. Current Market Potential and Opportunity Assessment (TAM–SAM–SOM Framework)
- 4.8. RAX Analyst Note
- 4.1. Porters Five Forces
- 5. Market Analysis, Insights and Forecast 2021-2033
- 5.1. Market Analysis, Insights and Forecast - by Product Type
- 5.1.1. Nomex
- 5.1.2. Aluminum
- 5.1.3. Thermoplastics
- 5.1.4. Other Product Types
- 5.2. Market Analysis, Insights and Forecast - by End-user Industry
- 5.2.1. Aerospace
- 5.2.2. Defense
- 5.2.3. Marine
- 5.2.4. Other End-user Industries
- 5.3. Market Analysis, Insights and Forecast - by Region
- 5.3.1. Asia Pacific
- 5.3.2. North America
- 5.3.3. Europe
- 5.3.4. South America
- 5.3.5. Middle East and Africa
- 5.1. Market Analysis, Insights and Forecast - by Product Type
- 6. Global Honeycomb Core Materials Market Analysis, Insights and Forecast, 2021-2033
- 6.1. Market Analysis, Insights and Forecast - by Product Type
- 6.1.1. Nomex
- 6.1.2. Aluminum
- 6.1.3. Thermoplastics
- 6.1.4. Other Product Types
- 6.2. Market Analysis, Insights and Forecast - by End-user Industry
- 6.2.1. Aerospace
- 6.2.2. Defense
- 6.2.3. Marine
- 6.2.4. Other End-user Industries
- 6.1. Market Analysis, Insights and Forecast - by Product Type
- 7. Asia Pacific Honeycomb Core Materials Market Analysis, Insights and Forecast, 2020-2032
- 7.1. Market Analysis, Insights and Forecast - by Product Type
- 7.1.1. Nomex
- 7.1.2. Aluminum
- 7.1.3. Thermoplastics
- 7.1.4. Other Product Types
- 7.2. Market Analysis, Insights and Forecast - by End-user Industry
- 7.2.1. Aerospace
- 7.2.2. Defense
- 7.2.3. Marine
- 7.2.4. Other End-user Industries
- 7.1. Market Analysis, Insights and Forecast - by Product Type
- 8. North America Honeycomb Core Materials Market Analysis, Insights and Forecast, 2020-2032
- 8.1. Market Analysis, Insights and Forecast - by Product Type
- 8.1.1. Nomex
- 8.1.2. Aluminum
- 8.1.3. Thermoplastics
- 8.1.4. Other Product Types
- 8.2. Market Analysis, Insights and Forecast - by End-user Industry
- 8.2.1. Aerospace
- 8.2.2. Defense
- 8.2.3. Marine
- 8.2.4. Other End-user Industries
- 8.1. Market Analysis, Insights and Forecast - by Product Type
- 9. Europe Honeycomb Core Materials Market Analysis, Insights and Forecast, 2020-2032
- 9.1. Market Analysis, Insights and Forecast - by Product Type
- 9.1.1. Nomex
- 9.1.2. Aluminum
- 9.1.3. Thermoplastics
- 9.1.4. Other Product Types
- 9.2. Market Analysis, Insights and Forecast - by End-user Industry
- 9.2.1. Aerospace
- 9.2.2. Defense
- 9.2.3. Marine
- 9.2.4. Other End-user Industries
- 9.1. Market Analysis, Insights and Forecast - by Product Type
- 10. South America Honeycomb Core Materials Market Analysis, Insights and Forecast, 2020-2032
- 10.1. Market Analysis, Insights and Forecast - by Product Type
- 10.1.1. Nomex
- 10.1.2. Aluminum
- 10.1.3. Thermoplastics
- 10.1.4. Other Product Types
- 10.2. Market Analysis, Insights and Forecast - by End-user Industry
- 10.2.1. Aerospace
- 10.2.2. Defense
- 10.2.3. Marine
- 10.2.4. Other End-user Industries
- 10.1. Market Analysis, Insights and Forecast - by Product Type
- 11. Middle East and Africa Honeycomb Core Materials Market Analysis, Insights and Forecast, 2020-2032
- 11.1. Market Analysis, Insights and Forecast - by Product Type
- 11.1.1. Nomex
- 11.1.2. Aluminum
- 11.1.3. Thermoplastics
- 11.1.4. Other Product Types
- 11.2. Market Analysis, Insights and Forecast - by End-user Industry
- 11.2.1. Aerospace
- 11.2.2. Defense
- 11.2.3. Marine
- 11.2.4. Other End-user Industries
- 11.1. Market Analysis, Insights and Forecast - by Product Type
- 12. Competitive Analysis
- 12.1. Company Profiles
- 12.1.1 Dufaylite Developments
- 12.1.1.1. Company Overview
- 12.1.1.2. Products
- 12.1.1.3. Company Financials
- 12.1.1.4. SWOT Analysis
- 12.1.2 Corinth Group
- 12.1.2.1. Company Overview
- 12.1.2.2. Products
- 12.1.2.3. Company Financials
- 12.1.2.4. SWOT Analysis
- 12.1.3 Honeycomb Cellpack
- 12.1.3.1. Company Overview
- 12.1.3.2. Products
- 12.1.3.3. Company Financials
- 12.1.3.4. SWOT Analysis
- 12.1.4 Honicel
- 12.1.4.1. Company Overview
- 12.1.4.2. Products
- 12.1.4.3. Company Financials
- 12.1.4.4. SWOT Analysis
- 12.1.5 Euro-Composites
- 12.1.5.1. Company Overview
- 12.1.5.2. Products
- 12.1.5.3. Company Financials
- 12.1.5.4. SWOT Analysis
- 12.1.6 Grigeo
- 12.1.6.1. Company Overview
- 12.1.6.2. Products
- 12.1.6.3. Company Financials
- 12.1.6.4. SWOT Analysis
- 12.1.7 Thermhex Waben GmbH
- 12.1.7.1. Company Overview
- 12.1.7.2. Products
- 12.1.7.3. Company Financials
- 12.1.7.4. SWOT Analysis
- 12.1.8 Samia Canada
- 12.1.8.1. Company Overview
- 12.1.8.2. Products
- 12.1.8.3. Company Financials
- 12.1.8.4. SWOT Analysis
- 12.1.9 The Gill Corporation
- 12.1.9.1. Company Overview
- 12.1.9.2. Products
- 12.1.9.3. Company Financials
- 12.1.9.4. SWOT Analysis
- 12.1.10 Hexcel Corporation
- 12.1.10.1. Company Overview
- 12.1.10.2. Products
- 12.1.10.3. Company Financials
- 12.1.10.4. SWOT Analysis
- 12.1.11 Argosy International
- 12.1.11.1. Company Overview
- 12.1.11.2. Products
- 12.1.11.3. Company Financials
- 12.1.11.4. SWOT Analysis
- 12.1.12 Koninklijke Ten Cate BV
- 12.1.12.1. Company Overview
- 12.1.12.2. Products
- 12.1.12.3. Company Financials
- 12.1.12.4. SWOT Analysis
- 12.1.13 Packaging Corporation of America
- 12.1.13.1. Company Overview
- 12.1.13.2. Products
- 12.1.13.3. Company Financials
- 12.1.13.4. SWOT Analysis
- 12.1.14 Axxion Group
- 12.1.14.1. Company Overview
- 12.1.14.2. Products
- 12.1.14.3. Company Financials
- 12.1.14.4. SWOT Analysis
- 12.1.15 Tubus Baer GmbH
- 12.1.15.1. Company Overview
- 12.1.15.2. Products
- 12.1.15.3. Company Financials
- 12.1.15.4. SWOT Analysis
- 12.1.1 Dufaylite Developments
- 12.2. Market Entropy
- 12.2.1 Company's Key Areas Served
- 12.2.2 Recent Developments
- 12.3. Company Market Share Analysis 2025
- 12.3.1 Top 5 Companies Market Share Analysis
- 12.3.2 Top 3 Companies Market Share Analysis
- 12.4. List of Potential Customers
- 13. Research Methodology
List of Figures
- Figure 1: Global Honeycomb Core Materials Market Revenue Breakdown (billion, %) by Region 2025 & 2033
- Figure 2: Global Honeycomb Core Materials Market Volume Breakdown (K Tons, %) by Region 2025 & 2033
- Figure 3: Asia Pacific Honeycomb Core Materials Market Revenue (billion), by Product Type 2025 & 2033
- Figure 4: Asia Pacific Honeycomb Core Materials Market Volume (K Tons), by Product Type 2025 & 2033
- Figure 5: Asia Pacific Honeycomb Core Materials Market Revenue Share (%), by Product Type 2025 & 2033
- Figure 6: Asia Pacific Honeycomb Core Materials Market Volume Share (%), by Product Type 2025 & 2033
- Figure 7: Asia Pacific Honeycomb Core Materials Market Revenue (billion), by End-user Industry 2025 & 2033
- Figure 8: Asia Pacific Honeycomb Core Materials Market Volume (K Tons), by End-user Industry 2025 & 2033
- Figure 9: Asia Pacific Honeycomb Core Materials Market Revenue Share (%), by End-user Industry 2025 & 2033
- Figure 10: Asia Pacific Honeycomb Core Materials Market Volume Share (%), by End-user Industry 2025 & 2033
- Figure 11: Asia Pacific Honeycomb Core Materials Market Revenue (billion), by Country 2025 & 2033
- Figure 12: Asia Pacific Honeycomb Core Materials Market Volume (K Tons), by Country 2025 & 2033
- Figure 13: Asia Pacific Honeycomb Core Materials Market Revenue Share (%), by Country 2025 & 2033
- Figure 14: Asia Pacific Honeycomb Core Materials Market Volume Share (%), by Country 2025 & 2033
- Figure 15: North America Honeycomb Core Materials Market Revenue (billion), by Product Type 2025 & 2033
- Figure 16: North America Honeycomb Core Materials Market Volume (K Tons), by Product Type 2025 & 2033
- Figure 17: North America Honeycomb Core Materials Market Revenue Share (%), by Product Type 2025 & 2033
- Figure 18: North America Honeycomb Core Materials Market Volume Share (%), by Product Type 2025 & 2033
- Figure 19: North America Honeycomb Core Materials Market Revenue (billion), by End-user Industry 2025 & 2033
- Figure 20: North America Honeycomb Core Materials Market Volume (K Tons), by End-user Industry 2025 & 2033
- Figure 21: North America Honeycomb Core Materials Market Revenue Share (%), by End-user Industry 2025 & 2033
- Figure 22: North America Honeycomb Core Materials Market Volume Share (%), by End-user Industry 2025 & 2033
- Figure 23: North America Honeycomb Core Materials Market Revenue (billion), by Country 2025 & 2033
- Figure 24: North America Honeycomb Core Materials Market Volume (K Tons), by Country 2025 & 2033
- Figure 25: North America Honeycomb Core Materials Market Revenue Share (%), by Country 2025 & 2033
- Figure 26: North America Honeycomb Core Materials Market Volume Share (%), by Country 2025 & 2033
- Figure 27: Europe Honeycomb Core Materials Market Revenue (billion), by Product Type 2025 & 2033
- Figure 28: Europe Honeycomb Core Materials Market Volume (K Tons), by Product Type 2025 & 2033
- Figure 29: Europe Honeycomb Core Materials Market Revenue Share (%), by Product Type 2025 & 2033
- Figure 30: Europe Honeycomb Core Materials Market Volume Share (%), by Product Type 2025 & 2033
- Figure 31: Europe Honeycomb Core Materials Market Revenue (billion), by End-user Industry 2025 & 2033
- Figure 32: Europe Honeycomb Core Materials Market Volume (K Tons), by End-user Industry 2025 & 2033
- Figure 33: Europe Honeycomb Core Materials Market Revenue Share (%), by End-user Industry 2025 & 2033
- Figure 34: Europe Honeycomb Core Materials Market Volume Share (%), by End-user Industry 2025 & 2033
- Figure 35: Europe Honeycomb Core Materials Market Revenue (billion), by Country 2025 & 2033
- Figure 36: Europe Honeycomb Core Materials Market Volume (K Tons), by Country 2025 & 2033
- Figure 37: Europe Honeycomb Core Materials Market Revenue Share (%), by Country 2025 & 2033
- Figure 38: Europe Honeycomb Core Materials Market Volume Share (%), by Country 2025 & 2033
- Figure 39: South America Honeycomb Core Materials Market Revenue (billion), by Product Type 2025 & 2033
- Figure 40: South America Honeycomb Core Materials Market Volume (K Tons), by Product Type 2025 & 2033
- Figure 41: South America Honeycomb Core Materials Market Revenue Share (%), by Product Type 2025 & 2033
- Figure 42: South America Honeycomb Core Materials Market Volume Share (%), by Product Type 2025 & 2033
- Figure 43: South America Honeycomb Core Materials Market Revenue (billion), by End-user Industry 2025 & 2033
- Figure 44: South America Honeycomb Core Materials Market Volume (K Tons), by End-user Industry 2025 & 2033
- Figure 45: South America Honeycomb Core Materials Market Revenue Share (%), by End-user Industry 2025 & 2033
- Figure 46: South America Honeycomb Core Materials Market Volume Share (%), by End-user Industry 2025 & 2033
- Figure 47: South America Honeycomb Core Materials Market Revenue (billion), by Country 2025 & 2033
- Figure 48: South America Honeycomb Core Materials Market Volume (K Tons), by Country 2025 & 2033
- Figure 49: South America Honeycomb Core Materials Market Revenue Share (%), by Country 2025 & 2033
- Figure 50: South America Honeycomb Core Materials Market Volume Share (%), by Country 2025 & 2033
- Figure 51: Middle East and Africa Honeycomb Core Materials Market Revenue (billion), by Product Type 2025 & 2033
- Figure 52: Middle East and Africa Honeycomb Core Materials Market Volume (K Tons), by Product Type 2025 & 2033
- Figure 53: Middle East and Africa Honeycomb Core Materials Market Revenue Share (%), by Product Type 2025 & 2033
- Figure 54: Middle East and Africa Honeycomb Core Materials Market Volume Share (%), by Product Type 2025 & 2033
- Figure 55: Middle East and Africa Honeycomb Core Materials Market Revenue (billion), by End-user Industry 2025 & 2033
- Figure 56: Middle East and Africa Honeycomb Core Materials Market Volume (K Tons), by End-user Industry 2025 & 2033
- Figure 57: Middle East and Africa Honeycomb Core Materials Market Revenue Share (%), by End-user Industry 2025 & 2033
- Figure 58: Middle East and Africa Honeycomb Core Materials Market Volume Share (%), by End-user Industry 2025 & 2033
- Figure 59: Middle East and Africa Honeycomb Core Materials Market Revenue (billion), by Country 2025 & 2033
- Figure 60: Middle East and Africa Honeycomb Core Materials Market Volume (K Tons), by Country 2025 & 2033
- Figure 61: Middle East and Africa Honeycomb Core Materials Market Revenue Share (%), by Country 2025 & 2033
- Figure 62: Middle East and Africa Honeycomb Core Materials Market Volume Share (%), by Country 2025 & 2033
List of Tables
- Table 1: Global Honeycomb Core Materials Market Revenue billion Forecast, by Product Type 2020 & 2033
- Table 2: Global Honeycomb Core Materials Market Volume K Tons Forecast, by Product Type 2020 & 2033
- Table 3: Global Honeycomb Core Materials Market Revenue billion Forecast, by End-user Industry 2020 & 2033
- Table 4: Global Honeycomb Core Materials Market Volume K Tons Forecast, by End-user Industry 2020 & 2033
- Table 5: Global Honeycomb Core Materials Market Revenue billion Forecast, by Region 2020 & 2033
- Table 6: Global Honeycomb Core Materials Market Volume K Tons Forecast, by Region 2020 & 2033
- Table 7: Global Honeycomb Core Materials Market Revenue billion Forecast, by Product Type 2020 & 2033
- Table 8: Global Honeycomb Core Materials Market Volume K Tons Forecast, by Product Type 2020 & 2033
- Table 9: Global Honeycomb Core Materials Market Revenue billion Forecast, by End-user Industry 2020 & 2033
- Table 10: Global Honeycomb Core Materials Market Volume K Tons Forecast, by End-user Industry 2020 & 2033
- Table 11: Global Honeycomb Core Materials Market Revenue billion Forecast, by Country 2020 & 2033
- Table 12: Global Honeycomb Core Materials Market Volume K Tons Forecast, by Country 2020 & 2033
- Table 13: China Honeycomb Core Materials Market Revenue (billion) Forecast, by Application 2020 & 2033
- Table 14: China Honeycomb Core Materials Market Volume (K Tons) Forecast, by Application 2020 & 2033
- Table 15: India Honeycomb Core Materials Market Revenue (billion) Forecast, by Application 2020 & 2033
- Table 16: India Honeycomb Core Materials Market Volume (K Tons) Forecast, by Application 2020 & 2033
- Table 17: Japan Honeycomb Core Materials Market Revenue (billion) Forecast, by Application 2020 & 2033
- Table 18: Japan Honeycomb Core Materials Market Volume (K Tons) Forecast, by Application 2020 & 2033
- Table 19: South Korea Honeycomb Core Materials Market Revenue (billion) Forecast, by Application 2020 & 2033
- Table 20: South Korea Honeycomb Core Materials Market Volume (K Tons) Forecast, by Application 2020 & 2033
- Table 21: Rest of Asia Pacific Honeycomb Core Materials Market Revenue (billion) Forecast, by Application 2020 & 2033
- Table 22: Rest of Asia Pacific Honeycomb Core Materials Market Volume (K Tons) Forecast, by Application 2020 & 2033
- Table 23: Global Honeycomb Core Materials Market Revenue billion Forecast, by Product Type 2020 & 2033
- Table 24: Global Honeycomb Core Materials Market Volume K Tons Forecast, by Product Type 2020 & 2033
- Table 25: Global Honeycomb Core Materials Market Revenue billion Forecast, by End-user Industry 2020 & 2033
- Table 26: Global Honeycomb Core Materials Market Volume K Tons Forecast, by End-user Industry 2020 & 2033
- Table 27: Global Honeycomb Core Materials Market Revenue billion Forecast, by Country 2020 & 2033
- Table 28: Global Honeycomb Core Materials Market Volume K Tons Forecast, by Country 2020 & 2033
- Table 29: United States Honeycomb Core Materials Market Revenue (billion) Forecast, by Application 2020 & 2033
- Table 30: United States Honeycomb Core Materials Market Volume (K Tons) Forecast, by Application 2020 & 2033
- Table 31: Canada Honeycomb Core Materials Market Revenue (billion) Forecast, by Application 2020 & 2033
- Table 32: Canada Honeycomb Core Materials Market Volume (K Tons) Forecast, by Application 2020 & 2033
- Table 33: Mexico Honeycomb Core Materials Market Revenue (billion) Forecast, by Application 2020 & 2033
- Table 34: Mexico Honeycomb Core Materials Market Volume (K Tons) Forecast, by Application 2020 & 2033
- Table 35: Global Honeycomb Core Materials Market Revenue billion Forecast, by Product Type 2020 & 2033
- Table 36: Global Honeycomb Core Materials Market Volume K Tons Forecast, by Product Type 2020 & 2033
- Table 37: Global Honeycomb Core Materials Market Revenue billion Forecast, by End-user Industry 2020 & 2033
- Table 38: Global Honeycomb Core Materials Market Volume K Tons Forecast, by End-user Industry 2020 & 2033
- Table 39: Global Honeycomb Core Materials Market Revenue billion Forecast, by Country 2020 & 2033
- Table 40: Global Honeycomb Core Materials Market Volume K Tons Forecast, by Country 2020 & 2033
- Table 41: Germany Honeycomb Core Materials Market Revenue (billion) Forecast, by Application 2020 & 2033
- Table 42: Germany Honeycomb Core Materials Market Volume (K Tons) Forecast, by Application 2020 & 2033
- Table 43: United Kingdom Honeycomb Core Materials Market Revenue (billion) Forecast, by Application 2020 & 2033
- Table 44: United Kingdom Honeycomb Core Materials Market Volume (K Tons) Forecast, by Application 2020 & 2033
- Table 45: Italy Honeycomb Core Materials Market Revenue (billion) Forecast, by Application 2020 & 2033
- Table 46: Italy Honeycomb Core Materials Market Volume (K Tons) Forecast, by Application 2020 & 2033
- Table 47: France Honeycomb Core Materials Market Revenue (billion) Forecast, by Application 2020 & 2033
- Table 48: France Honeycomb Core Materials Market Volume (K Tons) Forecast, by Application 2020 & 2033
- Table 49: Rest of Europe Honeycomb Core Materials Market Revenue (billion) Forecast, by Application 2020 & 2033
- Table 50: Rest of Europe Honeycomb Core Materials Market Volume (K Tons) Forecast, by Application 2020 & 2033
- Table 51: Global Honeycomb Core Materials Market Revenue billion Forecast, by Product Type 2020 & 2033
- Table 52: Global Honeycomb Core Materials Market Volume K Tons Forecast, by Product Type 2020 & 2033
- Table 53: Global Honeycomb Core Materials Market Revenue billion Forecast, by End-user Industry 2020 & 2033
- Table 54: Global Honeycomb Core Materials Market Volume K Tons Forecast, by End-user Industry 2020 & 2033
- Table 55: Global Honeycomb Core Materials Market Revenue billion Forecast, by Country 2020 & 2033
- Table 56: Global Honeycomb Core Materials Market Volume K Tons Forecast, by Country 2020 & 2033
- Table 57: Brazil Honeycomb Core Materials Market Revenue (billion) Forecast, by Application 2020 & 2033
- Table 58: Brazil Honeycomb Core Materials Market Volume (K Tons) Forecast, by Application 2020 & 2033
- Table 59: Argentina Honeycomb Core Materials Market Revenue (billion) Forecast, by Application 2020 & 2033
- Table 60: Argentina Honeycomb Core Materials Market Volume (K Tons) Forecast, by Application 2020 & 2033
- Table 61: Rest of South America Honeycomb Core Materials Market Revenue (billion) Forecast, by Application 2020 & 2033
- Table 62: Rest of South America Honeycomb Core Materials Market Volume (K Tons) Forecast, by Application 2020 & 2033
- Table 63: Global Honeycomb Core Materials Market Revenue billion Forecast, by Product Type 2020 & 2033
- Table 64: Global Honeycomb Core Materials Market Volume K Tons Forecast, by Product Type 2020 & 2033
- Table 65: Global Honeycomb Core Materials Market Revenue billion Forecast, by End-user Industry 2020 & 2033
- Table 66: Global Honeycomb Core Materials Market Volume K Tons Forecast, by End-user Industry 2020 & 2033
- Table 67: Global Honeycomb Core Materials Market Revenue billion Forecast, by Country 2020 & 2033
- Table 68: Global Honeycomb Core Materials Market Volume K Tons Forecast, by Country 2020 & 2033
- Table 69: Saudi Arabia Honeycomb Core Materials Market Revenue (billion) Forecast, by Application 2020 & 2033
- Table 70: Saudi Arabia Honeycomb Core Materials Market Volume (K Tons) Forecast, by Application 2020 & 2033
- Table 71: South Africa Honeycomb Core Materials Market Revenue (billion) Forecast, by Application 2020 & 2033
- Table 72: South Africa Honeycomb Core Materials Market Volume (K Tons) Forecast, by Application 2020 & 2033
- Table 73: Rest of Middle East and Africa Honeycomb Core Materials Market Revenue (billion) Forecast, by Application 2020 & 2033
- Table 74: Rest of Middle East and Africa Honeycomb Core Materials Market Volume (K Tons) Forecast, by Application 2020 & 2033
Frequently Asked Questions
1. What is the projected Compound Annual Growth Rate (CAGR) of the Honeycomb Core Materials Market?
The projected CAGR is approximately 9.63%.
2. Which companies are prominent players in the Honeycomb Core Materials Market?
Key companies in the market include Dufaylite Developments, Corinth Group, Honeycomb Cellpack, Honicel, Euro-Composites, Grigeo, Thermhex Waben GmbH, Samia Canada, The Gill Corporation, Hexcel Corporation, Argosy International, Koninklijke Ten Cate BV, Packaging Corporation of America, Axxion Group, Tubus Baer GmbH.
3. What are the main segments of the Honeycomb Core Materials Market?
The market segments include Product Type, End-user Industry.
4. Can you provide details about the market size?
The market size is estimated to be USD 3.4 billion as of 2022.
5. What are some drivers contributing to market growth?
Increasing Demand for Lightweight Materials for Fuel Efficiency; Other Drivers.
6. What are the notable trends driving market growth?
Aerospace Sector to Dominate the Market.
7. Are there any restraints impacting market growth?
Absorption of Water and Moisture; Significant Cost of the Products; Structural Limitations of Honeycomb Core Materials.
8. Can you provide examples of recent developments in the market?
In January 2022, FITS Air is currently being developed to TRL 6 technology readiness level, with panels measuring 1.28 m x 1.48 m and having optimum mechanical properties.
9. What pricing options are available for accessing the report?
Pricing options include single-user, multi-user, and enterprise licenses priced at USD 4750, USD 5250, and USD 8750 respectively.
10. Is the market size provided in terms of value or volume?
The market size is provided in terms of value, measured in billion and volume, measured in K Tons.
11. Are there any specific market keywords associated with the report?
Yes, the market keyword associated with the report is "Honeycomb Core Materials Market," which aids in identifying and referencing the specific market segment covered.
12. How do I determine which pricing option suits my needs best?
The pricing options vary based on user requirements and access needs. Individual users may opt for single-user licenses, while businesses requiring broader access may choose multi-user or enterprise licenses for cost-effective access to the report.
13. Are there any additional resources or data provided in the Honeycomb Core Materials Market report?
While the report offers comprehensive insights, it's advisable to review the specific contents or supplementary materials provided to ascertain if additional resources or data are available.
14. How can I stay updated on further developments or reports in the Honeycomb Core Materials Market?
To stay informed about further developments, trends, and reports in the Honeycomb Core Materials Market, consider subscribing to industry newsletters, following relevant companies and organizations, or regularly checking reputable industry news sources and publications.
Methodology
Step 1 - Identification of Relevant Samples Size from Population Database


Step 2 - Approaches for Defining Global Market Size (Value, Volume* & Price*)

Note*: In applicable scenarios
Step 3 - Data Sources
Primary Research
- Web Analytics
- Survey Reports
- Research Institute
- Latest Research Reports
- Opinion Leaders
Secondary Research
- Annual Reports
- White Paper
- Latest Press Release
- Industry Association
- Paid Database
- Investor Presentations

Step 4 - Data Triangulation
Involves using different sources of information in order to increase the validity of a study
These sources are likely to be stakeholders in a program - participants, other researchers, program staff, other community members, and so on.
Then we put all data in single framework & apply various statistical tools to find out the dynamic on the market.
During the analysis stage, feedback from the stakeholder groups would be compared to determine areas of agreement as well as areas of divergence