
Key Insights
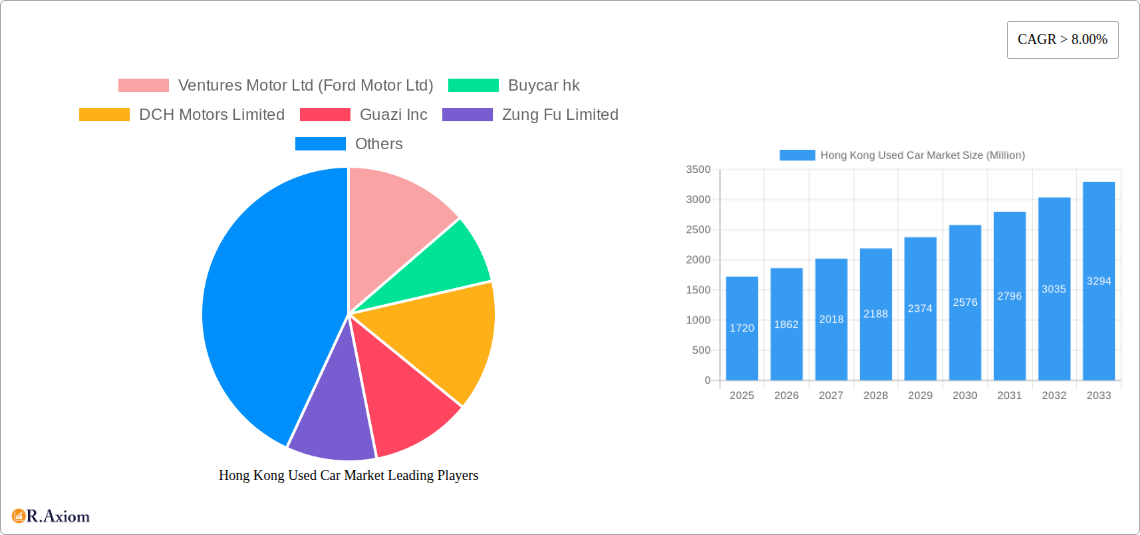
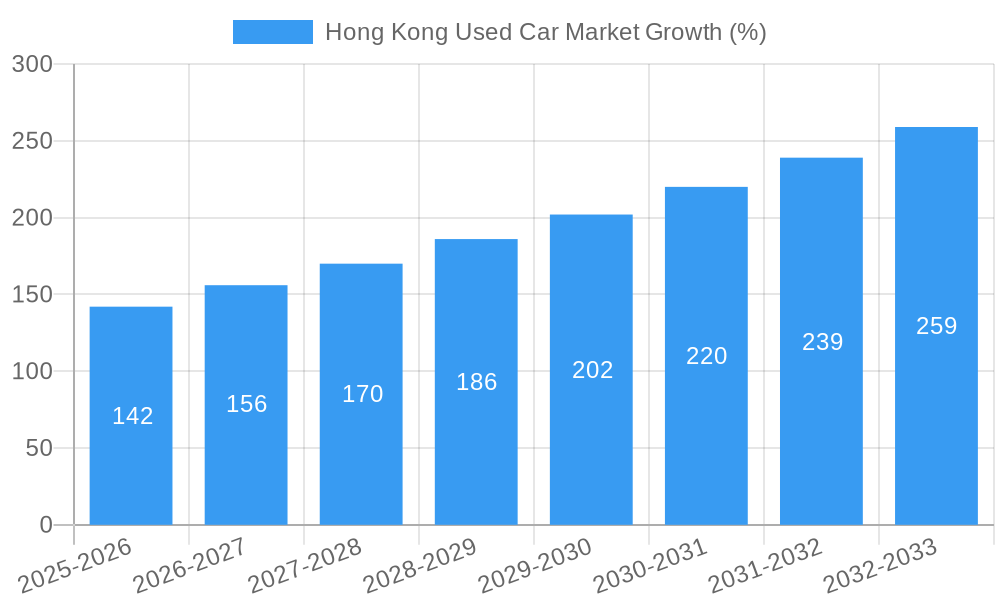
The Hong Kong used car market, valued at $1.72 billion in 2025, exhibits robust growth potential, projected to expand at a Compound Annual Growth Rate (CAGR) exceeding 8% from 2025 to 2033. This growth is fueled by several factors. Increasing vehicle ownership in Hong Kong, coupled with a preference for more affordable used vehicles compared to new cars, is a significant driver. Furthermore, the evolving preferences for specific vehicle types contribute to market dynamics. SUVs and MUVs are experiencing heightened demand due to their versatility and suitability for Hong Kong's urban and suburban landscapes. The market is segmented by vendor type (organized and unorganized dealerships), fuel type (gasoline, diesel, electric, and alternative fuels), and vehicle type (hatchbacks, sedans, SUVs, and MUVs). The organized sector is likely to see faster growth due to its ability to offer better financing options and after-sales services. The increasing adoption of electric vehicles, driven by government initiatives promoting sustainability, will influence market segmentation in the coming years. While challenges such as stringent import regulations and limited space for parking could restrain market growth to some extent, the overall outlook for the Hong Kong used car market remains optimistic, with strong potential for expansion throughout the forecast period. The competitive landscape includes both local and international players, highlighting a dynamic environment characterized by competition and innovation in sales strategies and customer service.
The dominance of gasoline and diesel vehicles is expected to gradually diminish as electric and alternative fuel vehicles gain traction. This shift will require adaptation from existing players and create opportunities for new entrants specializing in these emerging segments. The unorganized sector, while currently significant, might face increased challenges in adapting to stricter regulations and consumer expectations concerning vehicle quality and transparency. Therefore, strategic investments in technology, improved customer service, and environmentally friendly practices will be crucial for both organized and unorganized players to thrive in this evolving market. The continued growth in the used car market reflects a broader trend of greater affordability and accessibility to personal transportation in Hong Kong, with implications for overall economic activity and transportation patterns.
This comprehensive report provides an in-depth analysis of the Hong Kong used car market, covering market size, segmentation, key players, industry trends, and future growth prospects from 2019 to 2033. The report utilizes data from the historical period (2019-2024), the base year (2025), and the estimated year (2025) to forecast market trends until 2033. It is an essential resource for industry stakeholders, investors, and businesses seeking to understand and capitalize on opportunities within this dynamic market. The report’s value is further enhanced by the inclusion of actionable insights and detailed market segmentations, enabling informed decision-making.
Hong Kong Used Car Market Market Concentration & Innovation
The Hong Kong used car market exhibits a moderately concentrated landscape, with a few large organized players like DCH Motors Limited and Kam Lung Motor Group commanding significant market share. However, the unorganized sector remains substantial, comprising numerous smaller independent dealers. The market share of organized vendors is estimated at xx% in 2025, with a projected increase to xx% by 2033, driven by growing consumer preference for organized retail channels offering better transparency and assurance. Innovation in this sector is fueled by technological advancements such as online marketplaces (e.g., Buycar hk, Guazi Inc), improved vehicle inspection technologies, and the integration of fintech solutions for financing and insurance.
- Market Concentration: Organized sector xx% (2025), projected xx% (2033). Unorganized sector accounts for the remaining share.
- Innovation Drivers: Online marketplaces, fintech integration, advanced vehicle inspection technologies.
- Regulatory Framework: Stringent vehicle inspection and emission standards influence market dynamics.
- Product Substitutes: Public transportation and ride-hailing services offer alternatives to car ownership.
- End-User Trends: Growing preference for SUVs and electric vehicles.
- M&A Activities: The USD 60 Million deal between Jardine Cycle & Carriage and Carro in June 2023 highlights increasing M&A activity, with projected deal values reaching xx Million USD by 2033.
Hong Kong Used Car Market Industry Trends & Insights
The Hong Kong used car market is experiencing significant transformation. The Compound Annual Growth Rate (CAGR) during the forecast period (2025-2033) is estimated at xx%, driven primarily by rising disposable incomes, increasing urbanization, and a shift towards used car purchases as a more cost-effective option compared to new vehicles. Market penetration of organized vendors is expected to rise, driven by their enhanced services and consumer trust. Technological disruptions such as online platforms are improving transparency, access to information, and the overall efficiency of buying and selling used cars. Consumer preferences are shifting towards fuel-efficient vehicles, with a growing demand for electric vehicles (EVs). However, competitive dynamics remain intense, with both organized and unorganized players vying for market share. This intensifies the need for constant innovation, streamlined operations and superior customer service.
Dominant Markets & Segments in Hong Kong Used Car Market
The Hong Kong Island region dominates the used car market due to higher population density and purchasing power. Within the segmentation:
- Vendor Type: The organized sector is expected to witness faster growth than the unorganized sector driven by improved customer experience, financing options, and trust.
- Fuel Type: Gasoline remains the dominant fuel type in the used car segment, yet the electric vehicle (EV) segment is predicted to witness significant growth, driven by government initiatives promoting sustainable transportation.
- Vehicle Type: SUVs and sedans dominate the market in terms of volume and value. The demand for SUVs is driven by family-oriented buyers, while sedans remain a popular choice for smaller families and individuals. Growth in the MUV segment is limited by relatively smaller family sizes and limited affordability.
Key Drivers:
- Economic Policies: Government incentives for purchasing fuel-efficient vehicles influence market dynamics.
- Infrastructure: Availability of charging infrastructure is vital for the growth of the electric vehicle segment.
Hong Kong Used Car Market Product Developments
Technological advancements are driving product innovations in the Hong Kong used car market. Online platforms enhance transparency and convenience for buyers, while advancements in vehicle inspection technologies improve the assessment of used car condition. This, in turn, minimizes risk for buyers and improves trust in the overall market. The integration of fintech solutions is streamlining financing options. The market is also witnessing an increasing focus on fuel-efficient models, particularly EVs, driven by environmental concerns and government regulations.
Report Scope & Segmentation Analysis
This report segments the Hong Kong used car market by vendor type (organized and unorganized), fuel type (gasoline, diesel, electric, alternative fuel vehicles), and vehicle type (hatchback, sedan, SUV, MUV). Growth projections, market sizes, and competitive dynamics are analyzed for each segment. The report forecasts substantial growth in the organized sector, EV segment and SUVs across the 2025-2033 period. Competitive dynamics are influenced by the interplay between established players and emerging online platforms, and various government regulations.
Key Drivers of Hong Kong Used Car Market Growth
Several factors contribute to the growth of the Hong Kong used car market. Rising disposable incomes fuel demand, while the relative affordability of used cars compared to new ones drives purchases. Technological advancements enhance transparency and convenience, improving consumer confidence. Government policies promoting sustainable transportation drive the adoption of electric vehicles.
Challenges in the Hong Kong Used Car Market Sector
The Hong Kong used car market faces challenges including stringent vehicle inspection and emission standards, limited availability of affordable parking, and intense competition. Supply chain disruptions can also impact the availability of vehicles, increasing prices and potentially restricting market growth. The dominance of established players presents challenges for new entrants.
Emerging Opportunities in Hong Kong Used Car Market
Opportunities exist in the growing demand for electric vehicles, improved online marketplaces, and the integration of fintech solutions. The rising preference for fuel-efficient vehicles and a greater level of consumer trust in organized vendors presents ample scope for growth and expansion.
Leading Players in the Hong Kong Used Car Market Market
- Ventures Motor Ltd (Ford Motor Ltd)
- Buycar hk
- DCH Motors Limited
- Guazi Inc
- Zung Fu Limited
- VINS MOTORS COMPANY LTD
- Kam Lung Motor Group
- Hong Kong Motor City
- Lit Motors HK
- Dah Chong Hong Holdings Limite
Key Developments in Hong Kong Used Car Market Industry
- June 2023: Jardine Cycle & Carriage's USD 60 Million investment in Carro signifies a significant move towards online used car sales and market consolidation.
- September 2022: Cango's launch of the Haoche app expands the online used car trading platform, further enhancing market digitalization.
Strategic Outlook for Hong Kong Used Car Market Market
The Hong Kong used car market is poised for continued growth, driven by sustained economic growth, increasing urbanization, and technological advancements. The shift towards online platforms, the rise of electric vehicles, and improving regulatory frameworks present significant opportunities for market participants. Companies with strong online presence, efficient operations, and a focus on consumer experience are likely to succeed in this evolving landscape.
Hong Kong Used Car Market Segmentation
-
1. Vehicle Type
- 1.1. Hatchback
- 1.2. Sedan
- 1.3. Sport Utility Vehicles (SUVs)
- 1.4. Multi-Purpose Vehicles (MUVs)
-
2. Vendor Type
- 2.1. Organized
- 2.2. Unorganized
-
3. Fuel Type
- 3.1. Gasoline
- 3.2. Diesel
- 3.3. Electric
- 3.4. Alternative Fuel Vehicles
Hong Kong Used Car Market Segmentation By Geography
-
1. North America
- 1.1. United States
- 1.2. Canada
- 1.3. Mexico
-
2. South America
- 2.1. Brazil
- 2.2. Argentina
- 2.3. Rest of South America
-
3. Europe
- 3.1. United Kingdom
- 3.2. Germany
- 3.3. France
- 3.4. Italy
- 3.5. Spain
- 3.6. Russia
- 3.7. Benelux
- 3.8. Nordics
- 3.9. Rest of Europe
-
4. Middle East & Africa
- 4.1. Turkey
- 4.2. Israel
- 4.3. GCC
- 4.4. North Africa
- 4.5. South Africa
- 4.6. Rest of Middle East & Africa
-
5. Asia Pacific
- 5.1. China
- 5.2. India
- 5.3. Japan
- 5.4. South Korea
- 5.5. ASEAN
- 5.6. Oceania
- 5.7. Rest of Asia Pacific
Hong Kong Used Car Market REPORT HIGHLIGHTS
| Aspects | Details |
|---|---|
| Study Period | 2019-2033 |
| Base Year | 2024 |
| Estimated Year | 2025 |
| Forecast Period | 2025-2033 |
| Historical Period | 2019-2024 |
| Growth Rate | CAGR of > 8.00% from 2019-2033 |
| Segmentation |
|
Table of Contents
- 1. Introduction
- 1.1. Research Scope
- 1.2. Market Segmentation
- 1.3. Research Methodology
- 1.4. Definitions and Assumptions
- 2. Executive Summary
- 2.1. Introduction
- 3. Market Dynamics
- 3.1. Introduction
- 3.2. Market Drivers
- 3.2.1. Rise in Price of New Vehicles
- 3.3. Market Restrains
- 3.3.1. Trust And Transparency In Used Car Remained A Key Challenge For Consumers
- 3.4. Market Trends
- 3.4.1. Growing Used Car Financing Aiding Market Growth
- 4. Market Factor Analysis
- 4.1. Porters Five Forces
- 4.2. Supply/Value Chain
- 4.3. PESTEL analysis
- 4.4. Market Entropy
- 4.5. Patent/Trademark Analysis
- 5. Global Hong Kong Used Car Market Analysis, Insights and Forecast, 2019-2031
- 5.1. Market Analysis, Insights and Forecast - by Vehicle Type
- 5.1.1. Hatchback
- 5.1.2. Sedan
- 5.1.3. Sport Utility Vehicles (SUVs)
- 5.1.4. Multi-Purpose Vehicles (MUVs)
- 5.2. Market Analysis, Insights and Forecast - by Vendor Type
- 5.2.1. Organized
- 5.2.2. Unorganized
- 5.3. Market Analysis, Insights and Forecast - by Fuel Type
- 5.3.1. Gasoline
- 5.3.2. Diesel
- 5.3.3. Electric
- 5.3.4. Alternative Fuel Vehicles
- 5.4. Market Analysis, Insights and Forecast - by Region
- 5.4.1. North America
- 5.4.2. South America
- 5.4.3. Europe
- 5.4.4. Middle East & Africa
- 5.4.5. Asia Pacific
- 5.1. Market Analysis, Insights and Forecast - by Vehicle Type
- 6. North America Hong Kong Used Car Market Analysis, Insights and Forecast, 2019-2031
- 6.1. Market Analysis, Insights and Forecast - by Vehicle Type
- 6.1.1. Hatchback
- 6.1.2. Sedan
- 6.1.3. Sport Utility Vehicles (SUVs)
- 6.1.4. Multi-Purpose Vehicles (MUVs)
- 6.2. Market Analysis, Insights and Forecast - by Vendor Type
- 6.2.1. Organized
- 6.2.2. Unorganized
- 6.3. Market Analysis, Insights and Forecast - by Fuel Type
- 6.3.1. Gasoline
- 6.3.2. Diesel
- 6.3.3. Electric
- 6.3.4. Alternative Fuel Vehicles
- 6.1. Market Analysis, Insights and Forecast - by Vehicle Type
- 7. South America Hong Kong Used Car Market Analysis, Insights and Forecast, 2019-2031
- 7.1. Market Analysis, Insights and Forecast - by Vehicle Type
- 7.1.1. Hatchback
- 7.1.2. Sedan
- 7.1.3. Sport Utility Vehicles (SUVs)
- 7.1.4. Multi-Purpose Vehicles (MUVs)
- 7.2. Market Analysis, Insights and Forecast - by Vendor Type
- 7.2.1. Organized
- 7.2.2. Unorganized
- 7.3. Market Analysis, Insights and Forecast - by Fuel Type
- 7.3.1. Gasoline
- 7.3.2. Diesel
- 7.3.3. Electric
- 7.3.4. Alternative Fuel Vehicles
- 7.1. Market Analysis, Insights and Forecast - by Vehicle Type
- 8. Europe Hong Kong Used Car Market Analysis, Insights and Forecast, 2019-2031
- 8.1. Market Analysis, Insights and Forecast - by Vehicle Type
- 8.1.1. Hatchback
- 8.1.2. Sedan
- 8.1.3. Sport Utility Vehicles (SUVs)
- 8.1.4. Multi-Purpose Vehicles (MUVs)
- 8.2. Market Analysis, Insights and Forecast - by Vendor Type
- 8.2.1. Organized
- 8.2.2. Unorganized
- 8.3. Market Analysis, Insights and Forecast - by Fuel Type
- 8.3.1. Gasoline
- 8.3.2. Diesel
- 8.3.3. Electric
- 8.3.4. Alternative Fuel Vehicles
- 8.1. Market Analysis, Insights and Forecast - by Vehicle Type
- 9. Middle East & Africa Hong Kong Used Car Market Analysis, Insights and Forecast, 2019-2031
- 9.1. Market Analysis, Insights and Forecast - by Vehicle Type
- 9.1.1. Hatchback
- 9.1.2. Sedan
- 9.1.3. Sport Utility Vehicles (SUVs)
- 9.1.4. Multi-Purpose Vehicles (MUVs)
- 9.2. Market Analysis, Insights and Forecast - by Vendor Type
- 9.2.1. Organized
- 9.2.2. Unorganized
- 9.3. Market Analysis, Insights and Forecast - by Fuel Type
- 9.3.1. Gasoline
- 9.3.2. Diesel
- 9.3.3. Electric
- 9.3.4. Alternative Fuel Vehicles
- 9.1. Market Analysis, Insights and Forecast - by Vehicle Type
- 10. Asia Pacific Hong Kong Used Car Market Analysis, Insights and Forecast, 2019-2031
- 10.1. Market Analysis, Insights and Forecast - by Vehicle Type
- 10.1.1. Hatchback
- 10.1.2. Sedan
- 10.1.3. Sport Utility Vehicles (SUVs)
- 10.1.4. Multi-Purpose Vehicles (MUVs)
- 10.2. Market Analysis, Insights and Forecast - by Vendor Type
- 10.2.1. Organized
- 10.2.2. Unorganized
- 10.3. Market Analysis, Insights and Forecast - by Fuel Type
- 10.3.1. Gasoline
- 10.3.2. Diesel
- 10.3.3. Electric
- 10.3.4. Alternative Fuel Vehicles
- 10.1. Market Analysis, Insights and Forecast - by Vehicle Type
- 11. Competitive Analysis
- 11.1. Global Market Share Analysis 2024
- 11.2. Company Profiles
- 11.2.1 Ventures Motor Ltd (Ford Motor Ltd)
- 11.2.1.1. Overview
- 11.2.1.2. Products
- 11.2.1.3. SWOT Analysis
- 11.2.1.4. Recent Developments
- 11.2.1.5. Financials (Based on Availability)
- 11.2.2 Buycar hk
- 11.2.2.1. Overview
- 11.2.2.2. Products
- 11.2.2.3. SWOT Analysis
- 11.2.2.4. Recent Developments
- 11.2.2.5. Financials (Based on Availability)
- 11.2.3 DCH Motors Limited
- 11.2.3.1. Overview
- 11.2.3.2. Products
- 11.2.3.3. SWOT Analysis
- 11.2.3.4. Recent Developments
- 11.2.3.5. Financials (Based on Availability)
- 11.2.4 Guazi Inc
- 11.2.4.1. Overview
- 11.2.4.2. Products
- 11.2.4.3. SWOT Analysis
- 11.2.4.4. Recent Developments
- 11.2.4.5. Financials (Based on Availability)
- 11.2.5 Zung Fu Limited
- 11.2.5.1. Overview
- 11.2.5.2. Products
- 11.2.5.3. SWOT Analysis
- 11.2.5.4. Recent Developments
- 11.2.5.5. Financials (Based on Availability)
- 11.2.6 VINS MOTORS COMPANY LTD
- 11.2.6.1. Overview
- 11.2.6.2. Products
- 11.2.6.3. SWOT Analysis
- 11.2.6.4. Recent Developments
- 11.2.6.5. Financials (Based on Availability)
- 11.2.7 Kam Lung Motor Group
- 11.2.7.1. Overview
- 11.2.7.2. Products
- 11.2.7.3. SWOT Analysis
- 11.2.7.4. Recent Developments
- 11.2.7.5. Financials (Based on Availability)
- 11.2.8 Hong Kong Motor City
- 11.2.8.1. Overview
- 11.2.8.2. Products
- 11.2.8.3. SWOT Analysis
- 11.2.8.4. Recent Developments
- 11.2.8.5. Financials (Based on Availability)
- 11.2.9 Lit Motors HK
- 11.2.9.1. Overview
- 11.2.9.2. Products
- 11.2.9.3. SWOT Analysis
- 11.2.9.4. Recent Developments
- 11.2.9.5. Financials (Based on Availability)
- 11.2.10 Dah Chong Hong Holdings Limite
- 11.2.10.1. Overview
- 11.2.10.2. Products
- 11.2.10.3. SWOT Analysis
- 11.2.10.4. Recent Developments
- 11.2.10.5. Financials (Based on Availability)
- 11.2.1 Ventures Motor Ltd (Ford Motor Ltd)
List of Figures
- Figure 1: Global Hong Kong Used Car Market Revenue Breakdown (Million, %) by Region 2024 & 2032
- Figure 2: Hong Kong Hong Kong Used Car Market Revenue (Million), by Country 2024 & 2032
- Figure 3: Hong Kong Hong Kong Used Car Market Revenue Share (%), by Country 2024 & 2032
- Figure 4: North America Hong Kong Used Car Market Revenue (Million), by Vehicle Type 2024 & 2032
- Figure 5: North America Hong Kong Used Car Market Revenue Share (%), by Vehicle Type 2024 & 2032
- Figure 6: North America Hong Kong Used Car Market Revenue (Million), by Vendor Type 2024 & 2032
- Figure 7: North America Hong Kong Used Car Market Revenue Share (%), by Vendor Type 2024 & 2032
- Figure 8: North America Hong Kong Used Car Market Revenue (Million), by Fuel Type 2024 & 2032
- Figure 9: North America Hong Kong Used Car Market Revenue Share (%), by Fuel Type 2024 & 2032
- Figure 10: North America Hong Kong Used Car Market Revenue (Million), by Country 2024 & 2032
- Figure 11: North America Hong Kong Used Car Market Revenue Share (%), by Country 2024 & 2032
- Figure 12: South America Hong Kong Used Car Market Revenue (Million), by Vehicle Type 2024 & 2032
- Figure 13: South America Hong Kong Used Car Market Revenue Share (%), by Vehicle Type 2024 & 2032
- Figure 14: South America Hong Kong Used Car Market Revenue (Million), by Vendor Type 2024 & 2032
- Figure 15: South America Hong Kong Used Car Market Revenue Share (%), by Vendor Type 2024 & 2032
- Figure 16: South America Hong Kong Used Car Market Revenue (Million), by Fuel Type 2024 & 2032
- Figure 17: South America Hong Kong Used Car Market Revenue Share (%), by Fuel Type 2024 & 2032
- Figure 18: South America Hong Kong Used Car Market Revenue (Million), by Country 2024 & 2032
- Figure 19: South America Hong Kong Used Car Market Revenue Share (%), by Country 2024 & 2032
- Figure 20: Europe Hong Kong Used Car Market Revenue (Million), by Vehicle Type 2024 & 2032
- Figure 21: Europe Hong Kong Used Car Market Revenue Share (%), by Vehicle Type 2024 & 2032
- Figure 22: Europe Hong Kong Used Car Market Revenue (Million), by Vendor Type 2024 & 2032
- Figure 23: Europe Hong Kong Used Car Market Revenue Share (%), by Vendor Type 2024 & 2032
- Figure 24: Europe Hong Kong Used Car Market Revenue (Million), by Fuel Type 2024 & 2032
- Figure 25: Europe Hong Kong Used Car Market Revenue Share (%), by Fuel Type 2024 & 2032
- Figure 26: Europe Hong Kong Used Car Market Revenue (Million), by Country 2024 & 2032
- Figure 27: Europe Hong Kong Used Car Market Revenue Share (%), by Country 2024 & 2032
- Figure 28: Middle East & Africa Hong Kong Used Car Market Revenue (Million), by Vehicle Type 2024 & 2032
- Figure 29: Middle East & Africa Hong Kong Used Car Market Revenue Share (%), by Vehicle Type 2024 & 2032
- Figure 30: Middle East & Africa Hong Kong Used Car Market Revenue (Million), by Vendor Type 2024 & 2032
- Figure 31: Middle East & Africa Hong Kong Used Car Market Revenue Share (%), by Vendor Type 2024 & 2032
- Figure 32: Middle East & Africa Hong Kong Used Car Market Revenue (Million), by Fuel Type 2024 & 2032
- Figure 33: Middle East & Africa Hong Kong Used Car Market Revenue Share (%), by Fuel Type 2024 & 2032
- Figure 34: Middle East & Africa Hong Kong Used Car Market Revenue (Million), by Country 2024 & 2032
- Figure 35: Middle East & Africa Hong Kong Used Car Market Revenue Share (%), by Country 2024 & 2032
- Figure 36: Asia Pacific Hong Kong Used Car Market Revenue (Million), by Vehicle Type 2024 & 2032
- Figure 37: Asia Pacific Hong Kong Used Car Market Revenue Share (%), by Vehicle Type 2024 & 2032
- Figure 38: Asia Pacific Hong Kong Used Car Market Revenue (Million), by Vendor Type 2024 & 2032
- Figure 39: Asia Pacific Hong Kong Used Car Market Revenue Share (%), by Vendor Type 2024 & 2032
- Figure 40: Asia Pacific Hong Kong Used Car Market Revenue (Million), by Fuel Type 2024 & 2032
- Figure 41: Asia Pacific Hong Kong Used Car Market Revenue Share (%), by Fuel Type 2024 & 2032
- Figure 42: Asia Pacific Hong Kong Used Car Market Revenue (Million), by Country 2024 & 2032
- Figure 43: Asia Pacific Hong Kong Used Car Market Revenue Share (%), by Country 2024 & 2032
List of Tables
- Table 1: Global Hong Kong Used Car Market Revenue Million Forecast, by Region 2019 & 2032
- Table 2: Global Hong Kong Used Car Market Revenue Million Forecast, by Vehicle Type 2019 & 2032
- Table 3: Global Hong Kong Used Car Market Revenue Million Forecast, by Vendor Type 2019 & 2032
- Table 4: Global Hong Kong Used Car Market Revenue Million Forecast, by Fuel Type 2019 & 2032
- Table 5: Global Hong Kong Used Car Market Revenue Million Forecast, by Region 2019 & 2032
- Table 6: Global Hong Kong Used Car Market Revenue Million Forecast, by Country 2019 & 2032
- Table 7: Global Hong Kong Used Car Market Revenue Million Forecast, by Vehicle Type 2019 & 2032
- Table 8: Global Hong Kong Used Car Market Revenue Million Forecast, by Vendor Type 2019 & 2032
- Table 9: Global Hong Kong Used Car Market Revenue Million Forecast, by Fuel Type 2019 & 2032
- Table 10: Global Hong Kong Used Car Market Revenue Million Forecast, by Country 2019 & 2032
- Table 11: United States Hong Kong Used Car Market Revenue (Million) Forecast, by Application 2019 & 2032
- Table 12: Canada Hong Kong Used Car Market Revenue (Million) Forecast, by Application 2019 & 2032
- Table 13: Mexico Hong Kong Used Car Market Revenue (Million) Forecast, by Application 2019 & 2032
- Table 14: Global Hong Kong Used Car Market Revenue Million Forecast, by Vehicle Type 2019 & 2032
- Table 15: Global Hong Kong Used Car Market Revenue Million Forecast, by Vendor Type 2019 & 2032
- Table 16: Global Hong Kong Used Car Market Revenue Million Forecast, by Fuel Type 2019 & 2032
- Table 17: Global Hong Kong Used Car Market Revenue Million Forecast, by Country 2019 & 2032
- Table 18: Brazil Hong Kong Used Car Market Revenue (Million) Forecast, by Application 2019 & 2032
- Table 19: Argentina Hong Kong Used Car Market Revenue (Million) Forecast, by Application 2019 & 2032
- Table 20: Rest of South America Hong Kong Used Car Market Revenue (Million) Forecast, by Application 2019 & 2032
- Table 21: Global Hong Kong Used Car Market Revenue Million Forecast, by Vehicle Type 2019 & 2032
- Table 22: Global Hong Kong Used Car Market Revenue Million Forecast, by Vendor Type 2019 & 2032
- Table 23: Global Hong Kong Used Car Market Revenue Million Forecast, by Fuel Type 2019 & 2032
- Table 24: Global Hong Kong Used Car Market Revenue Million Forecast, by Country 2019 & 2032
- Table 25: United Kingdom Hong Kong Used Car Market Revenue (Million) Forecast, by Application 2019 & 2032
- Table 26: Germany Hong Kong Used Car Market Revenue (Million) Forecast, by Application 2019 & 2032
- Table 27: France Hong Kong Used Car Market Revenue (Million) Forecast, by Application 2019 & 2032
- Table 28: Italy Hong Kong Used Car Market Revenue (Million) Forecast, by Application 2019 & 2032
- Table 29: Spain Hong Kong Used Car Market Revenue (Million) Forecast, by Application 2019 & 2032
- Table 30: Russia Hong Kong Used Car Market Revenue (Million) Forecast, by Application 2019 & 2032
- Table 31: Benelux Hong Kong Used Car Market Revenue (Million) Forecast, by Application 2019 & 2032
- Table 32: Nordics Hong Kong Used Car Market Revenue (Million) Forecast, by Application 2019 & 2032
- Table 33: Rest of Europe Hong Kong Used Car Market Revenue (Million) Forecast, by Application 2019 & 2032
- Table 34: Global Hong Kong Used Car Market Revenue Million Forecast, by Vehicle Type 2019 & 2032
- Table 35: Global Hong Kong Used Car Market Revenue Million Forecast, by Vendor Type 2019 & 2032
- Table 36: Global Hong Kong Used Car Market Revenue Million Forecast, by Fuel Type 2019 & 2032
- Table 37: Global Hong Kong Used Car Market Revenue Million Forecast, by Country 2019 & 2032
- Table 38: Turkey Hong Kong Used Car Market Revenue (Million) Forecast, by Application 2019 & 2032
- Table 39: Israel Hong Kong Used Car Market Revenue (Million) Forecast, by Application 2019 & 2032
- Table 40: GCC Hong Kong Used Car Market Revenue (Million) Forecast, by Application 2019 & 2032
- Table 41: North Africa Hong Kong Used Car Market Revenue (Million) Forecast, by Application 2019 & 2032
- Table 42: South Africa Hong Kong Used Car Market Revenue (Million) Forecast, by Application 2019 & 2032
- Table 43: Rest of Middle East & Africa Hong Kong Used Car Market Revenue (Million) Forecast, by Application 2019 & 2032
- Table 44: Global Hong Kong Used Car Market Revenue Million Forecast, by Vehicle Type 2019 & 2032
- Table 45: Global Hong Kong Used Car Market Revenue Million Forecast, by Vendor Type 2019 & 2032
- Table 46: Global Hong Kong Used Car Market Revenue Million Forecast, by Fuel Type 2019 & 2032
- Table 47: Global Hong Kong Used Car Market Revenue Million Forecast, by Country 2019 & 2032
- Table 48: China Hong Kong Used Car Market Revenue (Million) Forecast, by Application 2019 & 2032
- Table 49: India Hong Kong Used Car Market Revenue (Million) Forecast, by Application 2019 & 2032
- Table 50: Japan Hong Kong Used Car Market Revenue (Million) Forecast, by Application 2019 & 2032
- Table 51: South Korea Hong Kong Used Car Market Revenue (Million) Forecast, by Application 2019 & 2032
- Table 52: ASEAN Hong Kong Used Car Market Revenue (Million) Forecast, by Application 2019 & 2032
- Table 53: Oceania Hong Kong Used Car Market Revenue (Million) Forecast, by Application 2019 & 2032
- Table 54: Rest of Asia Pacific Hong Kong Used Car Market Revenue (Million) Forecast, by Application 2019 & 2032
Frequently Asked Questions
1. What is the projected Compound Annual Growth Rate (CAGR) of the Hong Kong Used Car Market?
The projected CAGR is approximately > 8.00%.
2. Which companies are prominent players in the Hong Kong Used Car Market?
Key companies in the market include Ventures Motor Ltd (Ford Motor Ltd), Buycar hk, DCH Motors Limited, Guazi Inc, Zung Fu Limited, VINS MOTORS COMPANY LTD, Kam Lung Motor Group, Hong Kong Motor City, Lit Motors HK, Dah Chong Hong Holdings Limite.
3. What are the main segments of the Hong Kong Used Car Market?
The market segments include Vehicle Type, Vendor Type, Fuel Type.
4. Can you provide details about the market size?
The market size is estimated to be USD 1.72 Million as of 2022.
5. What are some drivers contributing to market growth?
Rise in Price of New Vehicles.
6. What are the notable trends driving market growth?
Growing Used Car Financing Aiding Market Growth.
7. Are there any restraints impacting market growth?
Trust And Transparency In Used Car Remained A Key Challenge For Consumers.
8. Can you provide examples of recent developments in the market?
June 2023: Jardine Cycle & Carriage, the investment arm of Hong Kong-based conglomerate Jardine Matheson, collaborated with Carro, Singapore's online automotive marketplace. The company signed a deal for USD 60 million to enhance used car sales in Hing Kong.
9. What pricing options are available for accessing the report?
Pricing options include single-user, multi-user, and enterprise licenses priced at USD 3800, USD 4500, and USD 5800 respectively.
10. Is the market size provided in terms of value or volume?
The market size is provided in terms of value, measured in Million.
11. Are there any specific market keywords associated with the report?
Yes, the market keyword associated with the report is "Hong Kong Used Car Market," which aids in identifying and referencing the specific market segment covered.
12. How do I determine which pricing option suits my needs best?
The pricing options vary based on user requirements and access needs. Individual users may opt for single-user licenses, while businesses requiring broader access may choose multi-user or enterprise licenses for cost-effective access to the report.
13. Are there any additional resources or data provided in the Hong Kong Used Car Market report?
While the report offers comprehensive insights, it's advisable to review the specific contents or supplementary materials provided to ascertain if additional resources or data are available.
14. How can I stay updated on further developments or reports in the Hong Kong Used Car Market?
To stay informed about further developments, trends, and reports in the Hong Kong Used Car Market, consider subscribing to industry newsletters, following relevant companies and organizations, or regularly checking reputable industry news sources and publications.
Methodology
Step 1 - Identification of Relevant Samples Size from Population Database


Step 2 - Approaches for Defining Global Market Size (Value, Volume* & Price*)

Note*: In applicable scenarios
Step 3 - Data Sources
Primary Research
- Web Analytics
- Survey Reports
- Research Institute
- Latest Research Reports
- Opinion Leaders
Secondary Research
- Annual Reports
- White Paper
- Latest Press Release
- Industry Association
- Paid Database
- Investor Presentations

Step 4 - Data Triangulation
Involves using different sources of information in order to increase the validity of a study
These sources are likely to be stakeholders in a program - participants, other researchers, program staff, other community members, and so on.
Then we put all data in single framework & apply various statistical tools to find out the dynamic on the market.
During the analysis stage, feedback from the stakeholder groups would be compared to determine areas of agreement as well as areas of divergence


