
Key Insights
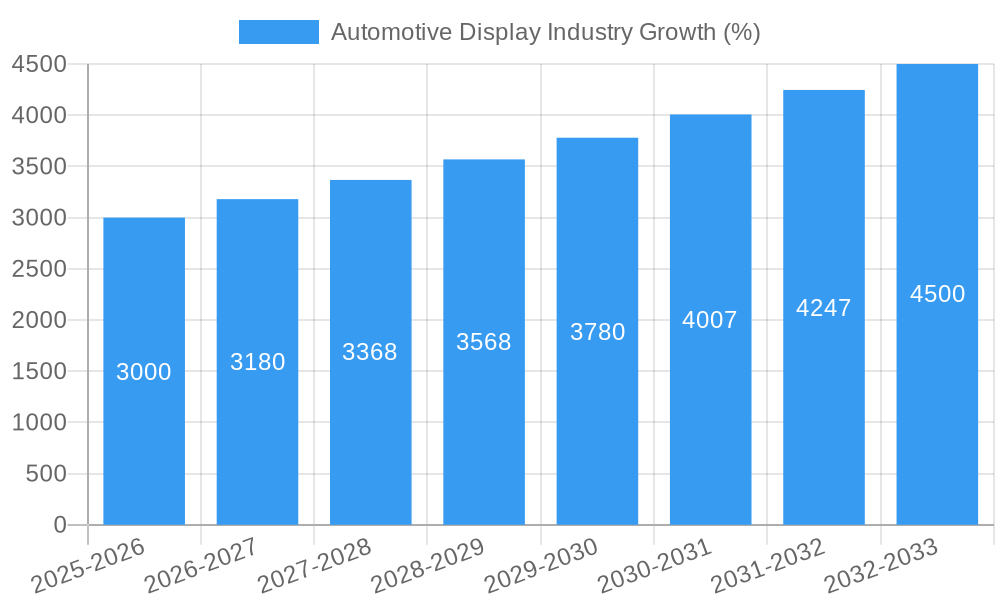
The automotive display market is experiencing robust growth, driven by the increasing demand for advanced driver-assistance systems (ADAS), infotainment features, and enhanced user experience within vehicles. The market's Compound Annual Growth Rate (CAGR) exceeding 6% signifies a significant upward trajectory, projected to reach substantial value over the forecast period (2025-2033). Key drivers include the rising adoption of connected cars, the integration of larger, higher-resolution displays, and the shift towards more sophisticated human-machine interfaces (HMI). Technological advancements, such as the transition from LCD to OLED displays offering superior image quality and energy efficiency, are further fueling market expansion. Segment-wise, the center stack display segment currently holds a dominant position, followed by instrument cluster displays, reflecting the increasing integration of infotainment and driver information systems. However, the head-up display (HUD) segment is witnessing rapid growth due to its ability to project crucial driving information directly onto the windshield, improving safety and driver convenience. Regional analysis indicates that North America and Asia Pacific are leading the market, driven by strong automotive manufacturing bases and high consumer demand for advanced vehicle features. While the market faces certain restraints, such as the high initial investment costs associated with advanced display technologies and potential supply chain disruptions, the overall growth outlook remains positive.
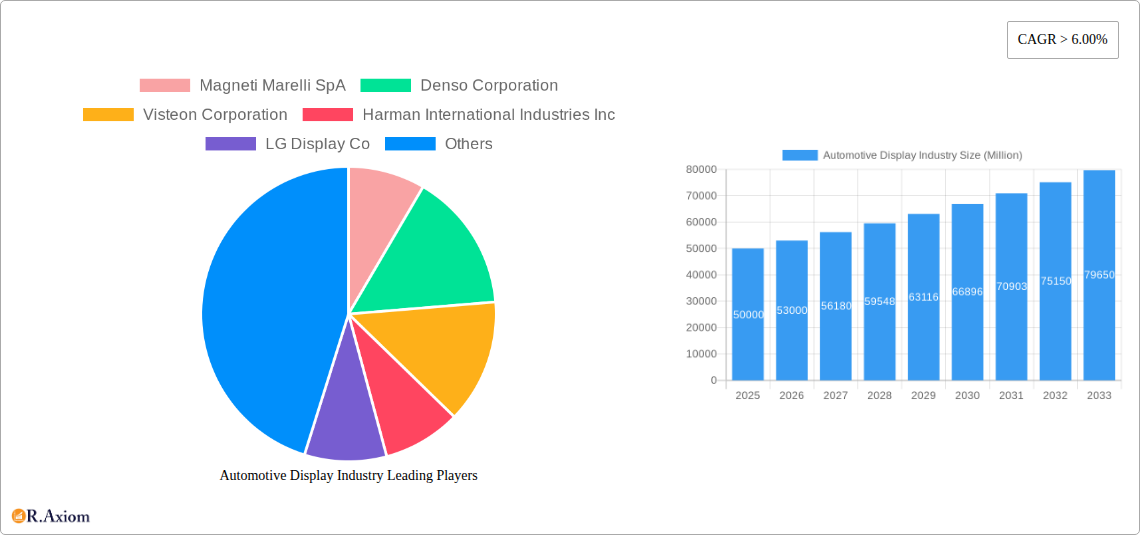
The competitive landscape is characterized by the presence of established automotive component suppliers, display manufacturers, and electronics companies. Key players like Magneti Marelli, Denso, Visteon, Harman, LG Display, and others are engaged in intense competition, focusing on innovation, strategic partnerships, and product differentiation. Future growth will be influenced by the continuous evolution of display technologies, such as mini-LED and micro-LED, and the increasing integration of artificial intelligence (AI) and augmented reality (AR) features within automotive displays. The integration of 5G connectivity will also play a pivotal role in shaping future market trends, enabling seamless data transfer and the delivery of advanced in-car services. The market is likely to witness further consolidation as companies strive to capitalize on the expanding opportunities presented by the evolving automotive landscape.
This comprehensive report provides an in-depth analysis of the automotive display industry, covering market trends, key players, technological advancements, and future growth prospects. The study period spans from 2019 to 2033, with 2025 serving as the base and estimated year. The report projects market values in Millions (USD).
Automotive Display Industry Market Concentration & Innovation
The automotive display market is characterized by a moderately concentrated landscape, with several major players controlling a significant portion of the market share. Companies like Denso Corporation, Visteon Corporation, Harman International Industries Inc, LG Display Co, Continental AG, and Robert Bosch GmbH hold substantial market share, estimated collectively at xx Million in 2025. However, the market is also witnessing increased competition from new entrants and emerging technologies. Innovation is a key driver, fueled by advancements in display technologies (OLED, mini-LED, MicroLED), augmented reality (AR) HUDs, and improved user interfaces. Stringent safety and regulatory requirements, particularly concerning driver distraction, are shaping product development. The market also experiences substitution pressures from alternative infotainment systems and evolving consumer preferences. M&A activity remains significant, with recent deals valued at approximately xx Million, indicating consolidation and strategic expansion within the sector. Key metrics such as market concentration ratios (e.g., CR4, CR8) and Herfindahl-Hirschman Index (HHI) will be analyzed in the full report to provide a quantitative assessment of market competitiveness.
Automotive Display Industry Industry Trends & Insights
The automotive display market is experiencing robust growth, projected to reach xx Million by 2033, exhibiting a Compound Annual Growth Rate (CAGR) of xx% during the forecast period (2025-2033). This growth is driven by several factors, including the rising adoption of advanced driver-assistance systems (ADAS), the increasing demand for enhanced in-car entertainment and connectivity features, and the proliferation of electric vehicles (EVs). Technological disruptions, such as the transition from LCD to OLED displays and the integration of AR technology, are significantly impacting market dynamics. Consumer preferences are shifting towards larger, higher-resolution displays with improved user interfaces and intuitive functionalities. The competitive landscape is evolving, with established players focusing on innovation and strategic partnerships to maintain their market position. Market penetration of advanced display technologies is increasing rapidly, particularly in premium vehicle segments, with OLED and HUD technologies gaining traction. The integration of AI and machine learning algorithms further enhances the in-vehicle experience, driving growth. The report offers a detailed analysis of these trends, providing granular insights into market segments and regional variations.
Dominant Markets & Segments in Automotive Display Industry
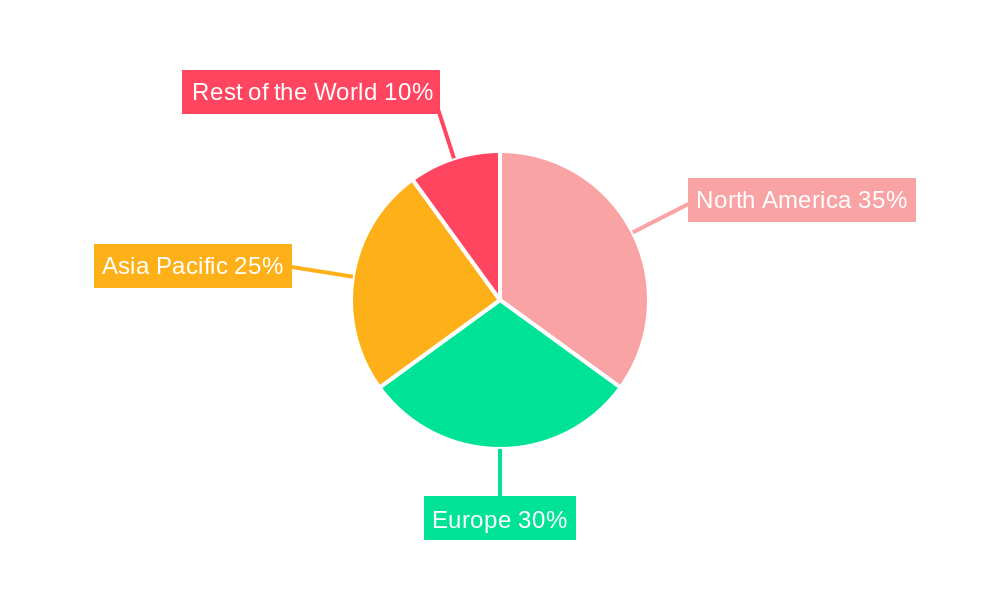
Leading Region: North America is projected to dominate the market in 2025, accounting for xx% of global revenue, driven by high vehicle production volumes, technological advancements, and strong consumer demand. Europe and Asia-Pacific are expected to show significant growth during the forecast period.
Dominant Product Type: The Center Stack Display segment is projected to lead in 2025, followed closely by the Instrument Cluster Display. The Head-Up Display (HUD) segment is experiencing rapid growth due to increasing adoption of ADAS features.
Dominant Display Technology: OLED displays are gaining popularity due to their superior image quality and energy efficiency, despite their higher cost compared to LCDs. The LCD technology still maintains a significant market share, particularly in the lower vehicle segments, due to cost advantages.
Key Drivers for Regional Dominance:
- North America: Strong automotive manufacturing base, high consumer spending power, technological innovation, and stringent safety regulations.
- Europe: Stringent emission regulations promoting electric vehicles, early adoption of advanced technologies, and a well-established automotive industry.
- Asia-Pacific: Rapid economic growth, increasing vehicle production, expanding middle class, and high demand for advanced features in emerging markets.
Automotive Display Industry Product Developments
Recent innovations in automotive displays focus on improving visual clarity, user experience, and safety. The integration of 3D sensing capabilities, as demonstrated by TouchNetix's aXiom chip, is revolutionizing human-machine interaction within vehicles, leading to touchless controls and improved ergonomics. Advances in mini-LED and MicroLED technologies offer increased brightness and enhanced contrast ratios, enhancing visibility under various lighting conditions. The development of flexible displays also allows for more creative and customizable instrument cluster and infotainment designs. These advancements cater to the growing demand for personalized and immersive in-car experiences.
Report Scope & Segmentation Analysis
This report segments the automotive display market based on product type (Center Stack Display, Instrument Cluster Display, Head-Up Display, Rear Seat Entertainment Display) and display technology (LCD, OLED). Each segment's market size, growth projections, and competitive dynamics are analyzed in detail. The report also considers regional variations, offering a comprehensive understanding of the market's structure and future trajectory.
Key Drivers of Automotive Display Industry Growth
Technological advancements (OLED, AR HUDs), rising demand for enhanced user experience and in-car entertainment, increasing vehicle production, especially EVs, stringent safety regulations mandating advanced driver assistance systems, and government initiatives promoting automotive technology are key drivers boosting industry expansion.
Challenges in the Automotive Display Industry Sector
Supply chain disruptions, intense competition, high raw material costs, the complexity of integrating advanced features into existing vehicle architectures, and maintaining a high level of quality while reducing costs pose significant challenges to the industry. The automotive display sector is also sensitive to macroeconomic factors affecting vehicle sales.
Emerging Opportunities in Automotive Display Industry
The increasing adoption of autonomous vehicles opens new opportunities for larger, more sophisticated displays offering improved driver monitoring and situational awareness. The integration of augmented reality (AR) and virtual reality (VR) technologies into automotive displays presents another area of potential growth. Expansion into emerging markets with growing vehicle ownership rates will fuel market expansion.
Leading Players in the Automotive Display Industry Market
- Magneti Marelli SpA
- Denso Corporation
- Visteon Corporation
- Harman International Industries Inc
- LG Display Co
- Nippon Seiki Co Lt
- Continental AG
- Robert Bosch GmbH
- Yazaki Corporation
- Panasonic Corporation
Key Developments in Automotive Display Industry Industry
- June 2021: Visteon Company secured a contract for its microZone™ display technology with a North American OEM for premium vehicles launching in 2024.
- April 2022: TouchNetix launched the aXiom touchscreen chip with 3D sensing, enabling touchless functionalities in automotive applications.
- May 2022: Nippon Seiki Co., Ltd. began HUD production at its new Polish plant, addressing rising European demand.
- May 2022: Faurecia showcased advanced perceptual image processing and immersive user experience solutions, including its MyDisplay platform, at SID Display Week.
Strategic Outlook for Automotive Display Industry Market
The automotive display market is poised for continued robust growth driven by technological innovation, the rising demand for advanced features, and the expansion of the electric vehicle market. Opportunities exist in developing innovative display technologies, expanding into new markets, and forging strategic partnerships to enhance market reach and competitiveness. The integration of AI, AR/VR, and improved user interfaces will further drive market expansion.
Automotive Display Industry Segmentation
-
1. Product Type
- 1.1. Center Stack Display
- 1.2. Instrument Cluster Display
- 1.3. Head-Up Display
- 1.4. Rear Seat Entertainment Display
-
2. Display Technology
- 2.1. LCD
- 2.2. OLED
Automotive Display Industry Segmentation By Geography
-
1. North America
- 1.1. United States
- 1.2. Canada
- 1.3. Rest of North America
-
2. Europe
- 2.1. Germany
- 2.2. United Kingdom
- 2.3. France
- 2.4. Rest of Europe
-
3. Asia Pacific
- 3.1. China
- 3.2. Japan
- 3.3. India
- 3.4. South Korea
- 3.5. Rest of Asia Pacific
-
4. Rest of the World
- 4.1. South America
- 4.2. Middle East and Africa
Automotive Display Industry REPORT HIGHLIGHTS
| Aspects | Details |
|---|---|
| Study Period | 2019-2033 |
| Base Year | 2024 |
| Estimated Year | 2025 |
| Forecast Period | 2025-2033 |
| Historical Period | 2019-2024 |
| Growth Rate | CAGR of > 6.00% from 2019-2033 |
| Segmentation |
|
Table of Contents
- 1. Introduction
- 1.1. Research Scope
- 1.2. Market Segmentation
- 1.3. Research Methodology
- 1.4. Definitions and Assumptions
- 2. Executive Summary
- 2.1. Introduction
- 3. Market Dynamics
- 3.1. Introduction
- 3.2. Market Drivers
- 3.2.1. Increasing Demand For Electric School Buses
- 3.3. Market Restrains
- 3.3.1. Uncertainty of The Global Pandemic
- 3.4. Market Trends
- 3.4.1. Increasing Demand of OLED Displays in the Luxury Vehicle is Expected to Witness Faster Growth Rate
- 4. Market Factor Analysis
- 4.1. Porters Five Forces
- 4.2. Supply/Value Chain
- 4.3. PESTEL analysis
- 4.4. Market Entropy
- 4.5. Patent/Trademark Analysis
- 5. Global Automotive Display Industry Analysis, Insights and Forecast, 2019-2031
- 5.1. Market Analysis, Insights and Forecast - by Product Type
- 5.1.1. Center Stack Display
- 5.1.2. Instrument Cluster Display
- 5.1.3. Head-Up Display
- 5.1.4. Rear Seat Entertainment Display
- 5.2. Market Analysis, Insights and Forecast - by Display Technology
- 5.2.1. LCD
- 5.2.2. OLED
- 5.3. Market Analysis, Insights and Forecast - by Region
- 5.3.1. North America
- 5.3.2. Europe
- 5.3.3. Asia Pacific
- 5.3.4. Rest of the World
- 5.1. Market Analysis, Insights and Forecast - by Product Type
- 6. North America Automotive Display Industry Analysis, Insights and Forecast, 2019-2031
- 6.1. Market Analysis, Insights and Forecast - by Product Type
- 6.1.1. Center Stack Display
- 6.1.2. Instrument Cluster Display
- 6.1.3. Head-Up Display
- 6.1.4. Rear Seat Entertainment Display
- 6.2. Market Analysis, Insights and Forecast - by Display Technology
- 6.2.1. LCD
- 6.2.2. OLED
- 6.1. Market Analysis, Insights and Forecast - by Product Type
- 7. Europe Automotive Display Industry Analysis, Insights and Forecast, 2019-2031
- 7.1. Market Analysis, Insights and Forecast - by Product Type
- 7.1.1. Center Stack Display
- 7.1.2. Instrument Cluster Display
- 7.1.3. Head-Up Display
- 7.1.4. Rear Seat Entertainment Display
- 7.2. Market Analysis, Insights and Forecast - by Display Technology
- 7.2.1. LCD
- 7.2.2. OLED
- 7.1. Market Analysis, Insights and Forecast - by Product Type
- 8. Asia Pacific Automotive Display Industry Analysis, Insights and Forecast, 2019-2031
- 8.1. Market Analysis, Insights and Forecast - by Product Type
- 8.1.1. Center Stack Display
- 8.1.2. Instrument Cluster Display
- 8.1.3. Head-Up Display
- 8.1.4. Rear Seat Entertainment Display
- 8.2. Market Analysis, Insights and Forecast - by Display Technology
- 8.2.1. LCD
- 8.2.2. OLED
- 8.1. Market Analysis, Insights and Forecast - by Product Type
- 9. Rest of the World Automotive Display Industry Analysis, Insights and Forecast, 2019-2031
- 9.1. Market Analysis, Insights and Forecast - by Product Type
- 9.1.1. Center Stack Display
- 9.1.2. Instrument Cluster Display
- 9.1.3. Head-Up Display
- 9.1.4. Rear Seat Entertainment Display
- 9.2. Market Analysis, Insights and Forecast - by Display Technology
- 9.2.1. LCD
- 9.2.2. OLED
- 9.1. Market Analysis, Insights and Forecast - by Product Type
- 10. North America Automotive Display Industry Analysis, Insights and Forecast, 2019-2031
- 10.1. Market Analysis, Insights and Forecast - By Country/Sub-region
- 10.1.1 United States
- 10.1.2 Canada
- 10.1.3 Rest of North America
- 11. Europe Automotive Display Industry Analysis, Insights and Forecast, 2019-2031
- 11.1. Market Analysis, Insights and Forecast - By Country/Sub-region
- 11.1.1 Germany
- 11.1.2 United Kingdom
- 11.1.3 France
- 11.1.4 Rest of Europe
- 12. Asia Pacific Automotive Display Industry Analysis, Insights and Forecast, 2019-2031
- 12.1. Market Analysis, Insights and Forecast - By Country/Sub-region
- 12.1.1 China
- 12.1.2 Japan
- 12.1.3 India
- 12.1.4 South Korea
- 12.1.5 Rest of Asia Pacific
- 13. Rest of the World Automotive Display Industry Analysis, Insights and Forecast, 2019-2031
- 13.1. Market Analysis, Insights and Forecast - By Country/Sub-region
- 13.1.1 South America
- 13.1.2 Middle East and Africa
- 14. Competitive Analysis
- 14.1. Global Market Share Analysis 2024
- 14.2. Company Profiles
- 14.2.1 Magneti Marelli SpA
- 14.2.1.1. Overview
- 14.2.1.2. Products
- 14.2.1.3. SWOT Analysis
- 14.2.1.4. Recent Developments
- 14.2.1.5. Financials (Based on Availability)
- 14.2.2 Denso Corporation
- 14.2.2.1. Overview
- 14.2.2.2. Products
- 14.2.2.3. SWOT Analysis
- 14.2.2.4. Recent Developments
- 14.2.2.5. Financials (Based on Availability)
- 14.2.3 Visteon Corporation
- 14.2.3.1. Overview
- 14.2.3.2. Products
- 14.2.3.3. SWOT Analysis
- 14.2.3.4. Recent Developments
- 14.2.3.5. Financials (Based on Availability)
- 14.2.4 Harman International Industries Inc
- 14.2.4.1. Overview
- 14.2.4.2. Products
- 14.2.4.3. SWOT Analysis
- 14.2.4.4. Recent Developments
- 14.2.4.5. Financials (Based on Availability)
- 14.2.5 LG Display Co
- 14.2.5.1. Overview
- 14.2.5.2. Products
- 14.2.5.3. SWOT Analysis
- 14.2.5.4. Recent Developments
- 14.2.5.5. Financials (Based on Availability)
- 14.2.6 Nippon Seiki Co Lt
- 14.2.6.1. Overview
- 14.2.6.2. Products
- 14.2.6.3. SWOT Analysis
- 14.2.6.4. Recent Developments
- 14.2.6.5. Financials (Based on Availability)
- 14.2.7 Continental AG
- 14.2.7.1. Overview
- 14.2.7.2. Products
- 14.2.7.3. SWOT Analysis
- 14.2.7.4. Recent Developments
- 14.2.7.5. Financials (Based on Availability)
- 14.2.8 Robert Bosch GmbH
- 14.2.8.1. Overview
- 14.2.8.2. Products
- 14.2.8.3. SWOT Analysis
- 14.2.8.4. Recent Developments
- 14.2.8.5. Financials (Based on Availability)
- 14.2.9 Yazaki Corporation
- 14.2.9.1. Overview
- 14.2.9.2. Products
- 14.2.9.3. SWOT Analysis
- 14.2.9.4. Recent Developments
- 14.2.9.5. Financials (Based on Availability)
- 14.2.10 Panasonic Corporation
- 14.2.10.1. Overview
- 14.2.10.2. Products
- 14.2.10.3. SWOT Analysis
- 14.2.10.4. Recent Developments
- 14.2.10.5. Financials (Based on Availability)
- 14.2.1 Magneti Marelli SpA
List of Figures
- Figure 1: Global Automotive Display Industry Revenue Breakdown (Million, %) by Region 2024 & 2032
- Figure 2: North America Automotive Display Industry Revenue (Million), by Country 2024 & 2032
- Figure 3: North America Automotive Display Industry Revenue Share (%), by Country 2024 & 2032
- Figure 4: Europe Automotive Display Industry Revenue (Million), by Country 2024 & 2032
- Figure 5: Europe Automotive Display Industry Revenue Share (%), by Country 2024 & 2032
- Figure 6: Asia Pacific Automotive Display Industry Revenue (Million), by Country 2024 & 2032
- Figure 7: Asia Pacific Automotive Display Industry Revenue Share (%), by Country 2024 & 2032
- Figure 8: Rest of the World Automotive Display Industry Revenue (Million), by Country 2024 & 2032
- Figure 9: Rest of the World Automotive Display Industry Revenue Share (%), by Country 2024 & 2032
- Figure 10: North America Automotive Display Industry Revenue (Million), by Product Type 2024 & 2032
- Figure 11: North America Automotive Display Industry Revenue Share (%), by Product Type 2024 & 2032
- Figure 12: North America Automotive Display Industry Revenue (Million), by Display Technology 2024 & 2032
- Figure 13: North America Automotive Display Industry Revenue Share (%), by Display Technology 2024 & 2032
- Figure 14: North America Automotive Display Industry Revenue (Million), by Country 2024 & 2032
- Figure 15: North America Automotive Display Industry Revenue Share (%), by Country 2024 & 2032
- Figure 16: Europe Automotive Display Industry Revenue (Million), by Product Type 2024 & 2032
- Figure 17: Europe Automotive Display Industry Revenue Share (%), by Product Type 2024 & 2032
- Figure 18: Europe Automotive Display Industry Revenue (Million), by Display Technology 2024 & 2032
- Figure 19: Europe Automotive Display Industry Revenue Share (%), by Display Technology 2024 & 2032
- Figure 20: Europe Automotive Display Industry Revenue (Million), by Country 2024 & 2032
- Figure 21: Europe Automotive Display Industry Revenue Share (%), by Country 2024 & 2032
- Figure 22: Asia Pacific Automotive Display Industry Revenue (Million), by Product Type 2024 & 2032
- Figure 23: Asia Pacific Automotive Display Industry Revenue Share (%), by Product Type 2024 & 2032
- Figure 24: Asia Pacific Automotive Display Industry Revenue (Million), by Display Technology 2024 & 2032
- Figure 25: Asia Pacific Automotive Display Industry Revenue Share (%), by Display Technology 2024 & 2032
- Figure 26: Asia Pacific Automotive Display Industry Revenue (Million), by Country 2024 & 2032
- Figure 27: Asia Pacific Automotive Display Industry Revenue Share (%), by Country 2024 & 2032
- Figure 28: Rest of the World Automotive Display Industry Revenue (Million), by Product Type 2024 & 2032
- Figure 29: Rest of the World Automotive Display Industry Revenue Share (%), by Product Type 2024 & 2032
- Figure 30: Rest of the World Automotive Display Industry Revenue (Million), by Display Technology 2024 & 2032
- Figure 31: Rest of the World Automotive Display Industry Revenue Share (%), by Display Technology 2024 & 2032
- Figure 32: Rest of the World Automotive Display Industry Revenue (Million), by Country 2024 & 2032
- Figure 33: Rest of the World Automotive Display Industry Revenue Share (%), by Country 2024 & 2032
List of Tables
- Table 1: Global Automotive Display Industry Revenue Million Forecast, by Region 2019 & 2032
- Table 2: Global Automotive Display Industry Revenue Million Forecast, by Product Type 2019 & 2032
- Table 3: Global Automotive Display Industry Revenue Million Forecast, by Display Technology 2019 & 2032
- Table 4: Global Automotive Display Industry Revenue Million Forecast, by Region 2019 & 2032
- Table 5: Global Automotive Display Industry Revenue Million Forecast, by Country 2019 & 2032
- Table 6: United States Automotive Display Industry Revenue (Million) Forecast, by Application 2019 & 2032
- Table 7: Canada Automotive Display Industry Revenue (Million) Forecast, by Application 2019 & 2032
- Table 8: Rest of North America Automotive Display Industry Revenue (Million) Forecast, by Application 2019 & 2032
- Table 9: Global Automotive Display Industry Revenue Million Forecast, by Country 2019 & 2032
- Table 10: Germany Automotive Display Industry Revenue (Million) Forecast, by Application 2019 & 2032
- Table 11: United Kingdom Automotive Display Industry Revenue (Million) Forecast, by Application 2019 & 2032
- Table 12: France Automotive Display Industry Revenue (Million) Forecast, by Application 2019 & 2032
- Table 13: Rest of Europe Automotive Display Industry Revenue (Million) Forecast, by Application 2019 & 2032
- Table 14: Global Automotive Display Industry Revenue Million Forecast, by Country 2019 & 2032
- Table 15: China Automotive Display Industry Revenue (Million) Forecast, by Application 2019 & 2032
- Table 16: Japan Automotive Display Industry Revenue (Million) Forecast, by Application 2019 & 2032
- Table 17: India Automotive Display Industry Revenue (Million) Forecast, by Application 2019 & 2032
- Table 18: South Korea Automotive Display Industry Revenue (Million) Forecast, by Application 2019 & 2032
- Table 19: Rest of Asia Pacific Automotive Display Industry Revenue (Million) Forecast, by Application 2019 & 2032
- Table 20: Global Automotive Display Industry Revenue Million Forecast, by Country 2019 & 2032
- Table 21: South America Automotive Display Industry Revenue (Million) Forecast, by Application 2019 & 2032
- Table 22: Middle East and Africa Automotive Display Industry Revenue (Million) Forecast, by Application 2019 & 2032
- Table 23: Global Automotive Display Industry Revenue Million Forecast, by Product Type 2019 & 2032
- Table 24: Global Automotive Display Industry Revenue Million Forecast, by Display Technology 2019 & 2032
- Table 25: Global Automotive Display Industry Revenue Million Forecast, by Country 2019 & 2032
- Table 26: United States Automotive Display Industry Revenue (Million) Forecast, by Application 2019 & 2032
- Table 27: Canada Automotive Display Industry Revenue (Million) Forecast, by Application 2019 & 2032
- Table 28: Rest of North America Automotive Display Industry Revenue (Million) Forecast, by Application 2019 & 2032
- Table 29: Global Automotive Display Industry Revenue Million Forecast, by Product Type 2019 & 2032
- Table 30: Global Automotive Display Industry Revenue Million Forecast, by Display Technology 2019 & 2032
- Table 31: Global Automotive Display Industry Revenue Million Forecast, by Country 2019 & 2032
- Table 32: Germany Automotive Display Industry Revenue (Million) Forecast, by Application 2019 & 2032
- Table 33: United Kingdom Automotive Display Industry Revenue (Million) Forecast, by Application 2019 & 2032
- Table 34: France Automotive Display Industry Revenue (Million) Forecast, by Application 2019 & 2032
- Table 35: Rest of Europe Automotive Display Industry Revenue (Million) Forecast, by Application 2019 & 2032
- Table 36: Global Automotive Display Industry Revenue Million Forecast, by Product Type 2019 & 2032
- Table 37: Global Automotive Display Industry Revenue Million Forecast, by Display Technology 2019 & 2032
- Table 38: Global Automotive Display Industry Revenue Million Forecast, by Country 2019 & 2032
- Table 39: China Automotive Display Industry Revenue (Million) Forecast, by Application 2019 & 2032
- Table 40: Japan Automotive Display Industry Revenue (Million) Forecast, by Application 2019 & 2032
- Table 41: India Automotive Display Industry Revenue (Million) Forecast, by Application 2019 & 2032
- Table 42: South Korea Automotive Display Industry Revenue (Million) Forecast, by Application 2019 & 2032
- Table 43: Rest of Asia Pacific Automotive Display Industry Revenue (Million) Forecast, by Application 2019 & 2032
- Table 44: Global Automotive Display Industry Revenue Million Forecast, by Product Type 2019 & 2032
- Table 45: Global Automotive Display Industry Revenue Million Forecast, by Display Technology 2019 & 2032
- Table 46: Global Automotive Display Industry Revenue Million Forecast, by Country 2019 & 2032
- Table 47: South America Automotive Display Industry Revenue (Million) Forecast, by Application 2019 & 2032
- Table 48: Middle East and Africa Automotive Display Industry Revenue (Million) Forecast, by Application 2019 & 2032
Frequently Asked Questions
1. What is the projected Compound Annual Growth Rate (CAGR) of the Automotive Display Industry?
The projected CAGR is approximately > 6.00%.
2. Which companies are prominent players in the Automotive Display Industry?
Key companies in the market include Magneti Marelli SpA, Denso Corporation, Visteon Corporation, Harman International Industries Inc, LG Display Co, Nippon Seiki Co Lt, Continental AG, Robert Bosch GmbH, Yazaki Corporation, Panasonic Corporation.
3. What are the main segments of the Automotive Display Industry?
The market segments include Product Type, Display Technology.
4. Can you provide details about the market size?
The market size is estimated to be USD XX Million as of 2022.
5. What are some drivers contributing to market growth?
Increasing Demand For Electric School Buses.
6. What are the notable trends driving market growth?
Increasing Demand of OLED Displays in the Luxury Vehicle is Expected to Witness Faster Growth Rate.
7. Are there any restraints impacting market growth?
Uncertainty of The Global Pandemic.
8. Can you provide examples of recent developments in the market?
April 2022: TouchNetix announced fully integrated aXiom touchscreen chips that offer new 3D sensing capabilities by detecting air gestures allowing touchless functions in automotive, industrial, and consumer environments, among others. aXiom provides more than 100 times higher Signal-to-Noise Ratio (SNR) than the traditional touchscreen controllers on the market.
9. What pricing options are available for accessing the report?
Pricing options include single-user, multi-user, and enterprise licenses priced at USD 4750, USD 5250, and USD 8750 respectively.
10. Is the market size provided in terms of value or volume?
The market size is provided in terms of value, measured in Million.
11. Are there any specific market keywords associated with the report?
Yes, the market keyword associated with the report is "Automotive Display Industry," which aids in identifying and referencing the specific market segment covered.
12. How do I determine which pricing option suits my needs best?
The pricing options vary based on user requirements and access needs. Individual users may opt for single-user licenses, while businesses requiring broader access may choose multi-user or enterprise licenses for cost-effective access to the report.
13. Are there any additional resources or data provided in the Automotive Display Industry report?
While the report offers comprehensive insights, it's advisable to review the specific contents or supplementary materials provided to ascertain if additional resources or data are available.
14. How can I stay updated on further developments or reports in the Automotive Display Industry?
To stay informed about further developments, trends, and reports in the Automotive Display Industry, consider subscribing to industry newsletters, following relevant companies and organizations, or regularly checking reputable industry news sources and publications.
Methodology
Step 1 - Identification of Relevant Samples Size from Population Database


Step 2 - Approaches for Defining Global Market Size (Value, Volume* & Price*)

Note*: In applicable scenarios
Step 3 - Data Sources
Primary Research
- Web Analytics
- Survey Reports
- Research Institute
- Latest Research Reports
- Opinion Leaders
Secondary Research
- Annual Reports
- White Paper
- Latest Press Release
- Industry Association
- Paid Database
- Investor Presentations

Step 4 - Data Triangulation
Involves using different sources of information in order to increase the validity of a study
These sources are likely to be stakeholders in a program - participants, other researchers, program staff, other community members, and so on.
Then we put all data in single framework & apply various statistical tools to find out the dynamic on the market.
During the analysis stage, feedback from the stakeholder groups would be compared to determine areas of agreement as well as areas of divergence


