

Key Insights
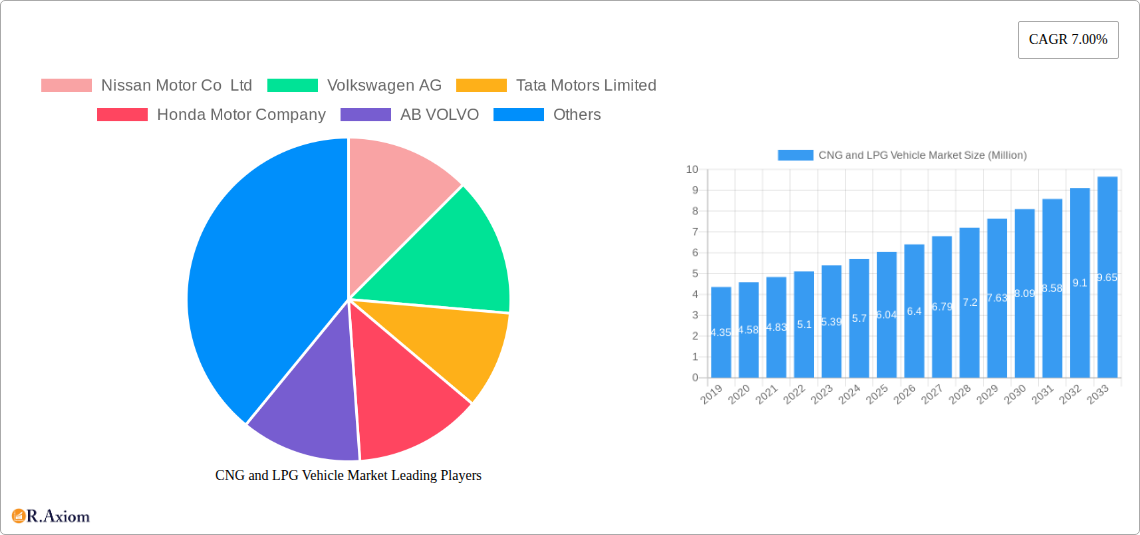
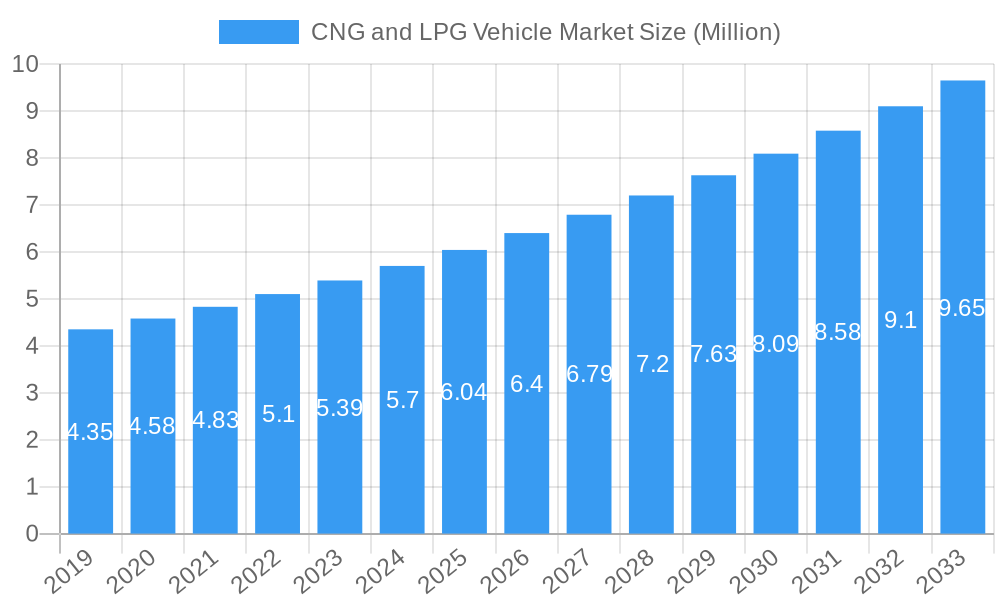
The global market for Compressed Natural Gas (CNG) and Liquefied Petroleum Gas (LPG) vehicles is poised for significant expansion, projected to reach USD 6.73 billion with a robust Compound Annual Growth Rate (CAGR) of 7.00% over the forecast period of 2025-2033. This growth is underpinned by a confluence of factors, including increasing environmental regulations driving the adoption of cleaner fuels, government incentives promoting the use of alternative fuel vehicles, and the inherent cost-effectiveness of CNG and LPG compared to traditional gasoline and diesel. The market is witnessing a discernible shift towards passenger cars and commercial vehicles powered by these alternative fuels, fueled by growing consumer awareness of their environmental benefits and reduced running costs. Key players such as Nissan Motor Co Ltd, Volkswagen AG, Tata Motors Limited, and Hyundai Motor Company are actively investing in research and development to expand their portfolios of CNG and LPG-compatible vehicles, further accelerating market penetration.
CNG and LPG Vehicle Market Market Size (In Million)
The market's trajectory is further shaped by emerging trends like the development of more efficient and powerful CNG and LPG engine technologies, alongside the expansion of refueling infrastructure. While the inherent cost savings and environmental advantages are significant drivers, potential restraints include fluctuations in the price of natural gas and LPG, and the initial higher cost of CNG/LPG vehicles compared to their conventional counterparts. However, ongoing technological advancements and economies of scale are expected to mitigate these concerns. Geographically, Asia Pacific, particularly India and China, is anticipated to lead the market expansion due to supportive government policies and a large consumer base seeking affordable and environmentally friendly transportation options. Europe and North America are also expected to contribute substantially, driven by stringent emission standards and a growing demand for sustainable mobility solutions. The sales channel landscape is evolving, with a balanced contribution expected from Original Equipment Manufacturers (OEMs) offering factory-fitted CNG/LPG vehicles and the retrofitting segment, catering to a diverse range of market needs.
CNG and LPG Vehicle Market Company Market Share
This in-depth report provides a detailed examination of the global Compressed Natural Gas (CNG) and Liquefied Petroleum Gas (LPG) vehicle market. Analyzing trends from 2019 to 2033, with a base year of 2025, this report offers critical insights into market dynamics, growth drivers, challenges, and future opportunities. Delving into segments such as Fuel Type (CNG, LPG), Vehicle Type (Passenger Cars, Commercial Vehicles), and Sales Channel (OEM, Retrofitting), this analysis is crucial for stakeholders seeking to understand and capitalize on the evolving alternative fuel vehicle landscape. With an estimated market size of USD XXX Million in 2025, projected to reach USD XXX Million by 2033, exhibiting a Compound Annual Growth Rate (CAGR) of XX.X%, this report equips industry leaders with actionable intelligence for strategic decision-making.
CNG and LPG Vehicle Market Market Concentration & Innovation
The CNG and LPG vehicle market exhibits a moderate level of concentration, with several key global automotive manufacturers holding significant market share. Innovation within this sector is primarily driven by the pursuit of cost-effective and environmentally friendly transportation solutions. Regulatory frameworks, particularly those promoting reduced emissions and energy independence, are paramount in fostering innovation and adoption. Product substitutes, such as battery electric vehicles (BEVs) and hybrid vehicles, present a continuous challenge, necessitating ongoing advancements in CNG and LPG technology to maintain competitive parity. End-user trends are increasingly favoring vehicles with lower running costs and reduced environmental impact, directly benefiting the CNG and LPG segments. Mergers and acquisitions (M&A) activity, while not as pronounced as in other automotive sectors, are present as companies seek to consolidate expertise and expand their alternative fuel offerings. M&A deal values in this specific niche are estimated to be in the range of USD XX Million to USD XXX Million. The market share distribution sees major players like Volkswagen AG and Tata Motors Limited vying for leadership, alongside specialized manufacturers.
CNG and LPG Vehicle Market Industry Trends & Insights
The CNG and LPG vehicle market is experiencing robust growth, fueled by a confluence of economic, environmental, and geopolitical factors. A significant driver is the ongoing push for cleaner transportation alternatives to combat air pollution and reduce greenhouse gas emissions, particularly in densely populated urban areas. The relatively lower cost of CNG and LPG compared to traditional gasoline and diesel fuels continues to be a compelling factor for consumers and fleet operators, leading to increased adoption rates. Technological advancements are playing a crucial role, with manufacturers continuously improving engine efficiency, emission control systems, and refueling infrastructure. For instance, the development of dual-fuel capabilities and enhanced storage solutions for CNG are making these vehicles more practical and appealing. Consumer preferences are shifting towards sustainability and lower operational expenditures, making CNG and LPG vehicles an attractive option. The competitive landscape is dynamic, with established automotive giants expanding their portfolios and new entrants focusing on niche segments. The market penetration of CNG and LPG vehicles is steadily increasing, though significant regional variations exist due to differing fuel availability and governmental support. The market is projected to witness a CAGR of XX.X% during the forecast period, reaching an estimated market size of USD XXX Million by 2033.
Dominant Markets & Segments in CNG and LPG Vehicle Market
The dominance within the CNG and LPG vehicle market is significantly influenced by regional policies, economic viability, and existing energy infrastructure.
Fuel Type Dominance:
- Compressed Natural Gas (CNG): CNG holds a prominent position, particularly in regions with well-developed natural gas distribution networks. Key drivers for CNG dominance include its lower cost of operation, reduced emissions compared to traditional fuels, and government incentives aimed at promoting its use. Countries like India, Pakistan, and Argentina have seen substantial growth in CNG vehicle adoption due to favorable policies and extensive refueling infrastructure development.
- Liquefied Petroleum Gas (LPG): LPG is also a significant player, often favored for its ease of storage and transportability. Its dominance is notable in regions where natural gas infrastructure is less developed. Factors contributing to LPG's market share include its availability as a byproduct of oil refining and its widespread use in domestic applications, facilitating easier integration into the automotive sector.
Vehicle Type Dominance:
- Commercial Vehicles: Commercial vehicles, including buses, trucks, and taxis, represent a dominant segment. The primary drivers for this dominance are the substantial operational cost savings offered by CNG and LPG, leading to a quicker return on investment for fleet operators. The high mileage driven by commercial vehicles amplifies these savings, making alternative fuels a strategic choice for businesses looking to optimize expenses and comply with stricter emission regulations.
- Passenger Cars: While commercial vehicles lead, passenger car adoption is also on a significant upward trajectory. Growing environmental awareness among consumers, coupled with the availability of more stylish and technologically advanced CNG and LPG passenger car models, is fueling this growth.
Sales Channel Dominance:
- OEM (Original Equipment Manufacturer): The OEM channel is progressively becoming the dominant sales channel for factory-fitted CNG and LPG vehicles. This trend is driven by manufacturers integrating these fuel options directly into their production lines, offering warranty support and ensuring seamless integration of fuel systems. This provides consumers with greater assurance and convenience compared to aftermarket solutions.
- Retrofitting: Retrofitting remains a crucial sales channel, particularly in markets where factory-fitted options are limited or for older vehicle models. This segment caters to a price-sensitive customer base seeking to convert their existing gasoline or diesel vehicles to run on CNG or LPG. The availability of skilled retrofitting centers and cost-effective conversion kits are key enablers for this channel.
CNG and LPG Vehicle Market Product Developments
Product developments in the CNG and LPG vehicle market are centered on enhancing performance, efficiency, and user experience. Manufacturers are introducing advanced dual-fuel systems that seamlessly switch between CNG/LPG and gasoline, offering greater flexibility. Innovations in engine technology, such as multi-point fuel injection and improved ignition systems, are boosting fuel economy and reducing emissions. Lighter and more robust CNG cylinders are being developed to optimize vehicle weight and passenger/cargo space. Competitive advantages are being carved out through improved mileage, lower maintenance costs, and compliance with stringent emission standards. The focus is on making CNG and LPG vehicles as convenient and cost-effective as their traditional counterparts, while offering a distinct environmental benefit.
Report Scope & Segmentation Analysis
This report meticulously segments the CNG and LPG Vehicle Market across critical dimensions to provide granular insights. The Fuel Type segmentation analyzes the distinct market dynamics and growth trajectories of Compressed Natural Gas (CNG) vehicles versus Liquefied Petroleum Gas (LPG) vehicles. The Vehicle Type segmentation differentiates between Passenger Cars and Commercial Vehicles, highlighting the varied adoption rates and influencing factors for each category. Furthermore, the Sales Channel segmentation explores the market share and growth potential of vehicles sold through Original Equipment Manufacturers (OEM) versus those that have undergone Retrofitting. Each segment is analyzed for its estimated market size in 2025, projected growth rates, and competitive landscapes, offering a comprehensive view of the market's intricate structure.
Key Drivers of CNG and LPG Vehicle Market Growth
The growth of the CNG and LPG vehicle market is propelled by several interconnected factors. Firstly, the economic advantage of lower fuel costs compared to gasoline and diesel remains a primary motivator for consumers and fleet operators. Secondly, stringent environmental regulations and government mandates aimed at reducing vehicular emissions are compelling a shift towards cleaner alternatives like CNG and LPG. Thirdly, the expansion of refueling infrastructure, particularly for CNG, is crucial for alleviating range anxiety and enhancing the practicality of these vehicles. Initiatives by governments to promote domestic gas production and reduce reliance on imported fossil fuels also contribute to market expansion. Finally, continuous technological advancements in engine efficiency and fuel system integration are making CNG and LPG vehicles more appealing and competitive.
Challenges in the CNG and LPG Vehicle Market Sector
Despite its growth potential, the CNG and LPG vehicle market faces several significant challenges. The limited and uneven distribution of refueling infrastructure, especially for CNG, remains a major barrier to widespread adoption, particularly in rural areas. Higher initial purchase costs for factory-fitted CNG and LPG vehicles compared to their gasoline counterparts can deter some consumers, despite lower running costs. Safety concerns and regulatory complexities associated with the storage and handling of compressed or liquefied gases, though often managed through strict standards, can still influence public perception. Additionally, the availability of alternative fuels, such as electric vehicles, poses increasing competition, necessitating continuous innovation and competitive pricing strategies. Supply chain disruptions for critical components also present a risk.
Emerging Opportunities in CNG and LPG Vehicle Market
The CNG and LPG vehicle market is ripe with emerging opportunities. The increasing focus on decarbonization and sustainable transportation globally creates a fertile ground for these cleaner fuel alternatives. Government initiatives to promote the use of natural gas in transportation, through subsidies, tax incentives, and infrastructure development, are significant growth catalysts. The rising price of crude oil further enhances the economic attractiveness of CNG and LPG. Opportunities also lie in the expansion of LPG as a fuel in developing economies where natural gas infrastructure is nascent. Furthermore, the development of advanced dual-fuel and bi-fuel technologies offers consumers greater flexibility and addresses range anxiety, opening up new market segments. The potential for utilizing biogas and renewable natural gas as feedstocks for CNG production presents a pathway towards a more sustainable and circular economy within the automotive sector.
Leading Players in the CNG and LPG Vehicle Market Market
- Nissan Motor Co Ltd
- Volkswagen AG
- Tata Motors Limited
- Honda Motor Company
- AB VOLVO
- Hyundai Motor Company
- Traton SE
- Suzuki Motor Corporation
- IVECO SpA
- Ford Motor Company
Key Developments in CNG and LPG Vehicle Market Industry
- November 2023: The government of India committed to significantly expanding the network of CNG stations, setting an ambitious target to increase the count from 6,000 to 17,700 by 2030. In October, this initiative gained further momentum with the launch of the 12th City Gas Distribution (CGD) bidding round. This strategic move is aimed at closing the gaps in the existing gas infrastructure, a step that is expected to substantially drive the growth of the CNG vehicle market.
- June 2023: The National Economic Council (NEC) has given its approval to the initiative proposed by the National Automotive Design and Development Council (NADDC) for initiating large-scale production of electric vehicles and vehicles powered by compressed natural gas in Nigeria.
- January 2023: Suzuki Motor Corporation (SMC) revealed its plan to power its CNG vehicles using cow dung. This announcement came alongside the disclosure of an MoU signed between Maruti Suzuki and the National Dairy Development Board (NDDB), which is the largest dairy manufacturer in Asia. This initiative forms a part of SMC's growth strategy, which is looking ahead to 2030.
- March 2022: Maruti Suzuki India Limited launched Dzire with S-CNG technology. Powered by an advanced K-series Dual Jet, Dual VVT 1.2L engine, Dzire S-CNG delivers a peak power of 57kW at 6000 rpm and 98.5 Nm torque, and an incredible mileage of 31.12 km/kg.
Strategic Outlook for CNG and LPG Vehicle Market Market
The strategic outlook for the CNG and LPG vehicle market is exceptionally positive, driven by a sustained global push towards alternative fuels and a commitment to reducing carbon footprints. The increasing governmental support and policy interventions favoring cleaner fuels, coupled with the growing awareness of environmental sustainability among consumers and corporations, will continue to fuel demand. The economic viability offered by lower operational costs will remain a critical growth catalyst, especially for commercial fleets. Innovations in infrastructure development and vehicle technology, including the integration of renewable natural gas, will further enhance the appeal and practicality of CNG and LPG vehicles. Companies that strategically invest in expanding their CNG and LPG product lines, fortify their supply chains, and leverage emerging markets will be well-positioned to capitalize on the substantial growth opportunities projected in the coming years, leading to a projected market valuation of USD XXX Million by 2033.
CNG and LPG Vehicle Market Segmentation
-
1. Fuel Type
- 1.1. Compressed Natural Gas (CNG)
- 1.2. Liquefied Petroleum Gas (LPG)
-
2. Vehicle Type
- 2.1. Passenger Cars
- 2.2. Commercial Vehicles
-
3. Sales Channel
- 3.1. OEM
- 3.2. Retrofitting
CNG and LPG Vehicle Market Segmentation By Geography
-
1. North America
- 1.1. United States
- 1.2. Canada
- 1.3. Rest of North America
-
2. Europe
- 2.1. Germany
- 2.2. United Kingdom
- 2.3. France
- 2.4. Italy
- 2.5. Spain
- 2.6. Rest of Europe
-
3. Asia Pacific
- 3.1. India
- 3.2. China
- 3.3. Japan
- 3.4. South Korea
- 3.5. Rest of Asia Pacific
-
4. Rest of the World
- 4.1. South America
- 4.2. Middle East and Africa
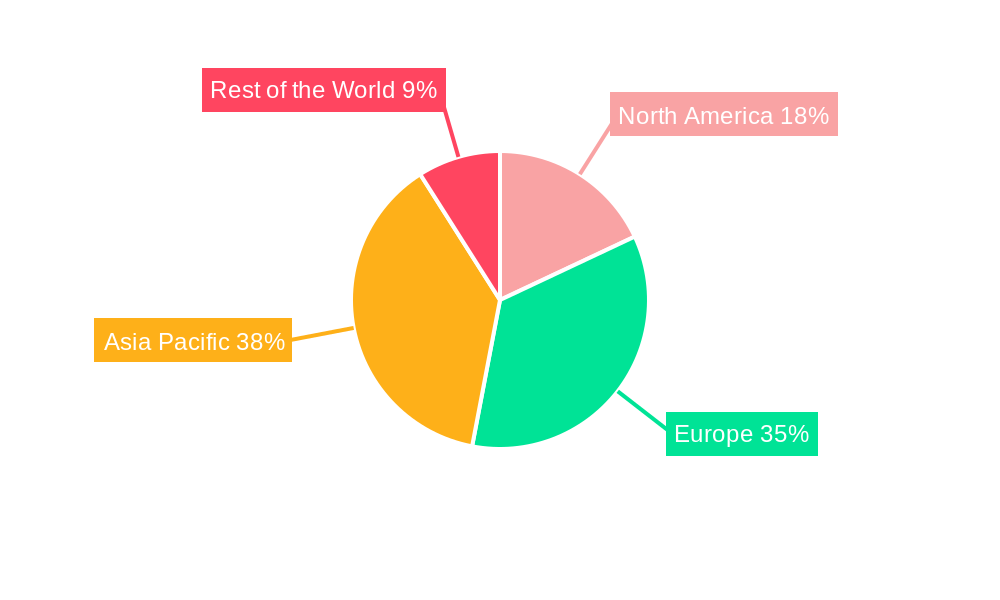
CNG and LPG Vehicle Market Regional Market Share
Geographic Coverage of CNG and LPG Vehicle Market
CNG and LPG Vehicle Market REPORT HIGHLIGHTS
| Aspects | Details |
|---|---|
| Study Period | 2020-2034 |
| Base Year | 2025 |
| Estimated Year | 2026 |
| Forecast Period | 2026-2034 |
| Historical Period | 2020-2025 |
| Growth Rate | CAGR of 4.75% from 2020-2034 |
| Segmentation |
|
Table of Contents
- 1. Introduction
- 1.1. Research Scope
- 1.2. Market Segmentation
- 1.3. Research Objective
- 1.4. Definitions and Assumptions
- 2. Executive Summary
- 2.1. Market Snapshot
- 3. Market Dynamics
- 3.1. Market Drivers
- 3.2. Market Restrains
- 3.3. Market Trends
- 3.4. Market Opportunities
- 4. Market Factor Analysis
- 4.1. Porters Five Forces
- 4.1.1. Bargaining Power of Suppliers
- 4.1.2. Bargaining Power of Buyers
- 4.1.3. Threat of New Entrants
- 4.1.4. Threat of Substitutes
- 4.1.5. Competitive Rivalry
- 4.2. PESTEL analysis
- 4.3. BCG Analysis
- 4.3.1. Stars (High Growth, High Market Share)
- 4.3.2. Cash Cows (Low Growth, High Market Share)
- 4.3.3. Question Mark (High Growth, Low Market Share)
- 4.3.4. Dogs (Low Growth, Low Market Share)
- 4.4. Ansoff Matrix Analysis
- 4.5. Supply Chain Analysis
- 4.6. Regulatory Landscape
- 4.7. Current Market Potential and Opportunity Assessment (TAM–SAM–SOM Framework)
- 4.8. RAX Analyst Note
- 4.1. Porters Five Forces
- 5. Market Analysis, Insights and Forecast 2021-2033
- 5.1. Market Analysis, Insights and Forecast - by Fuel Type
- 5.1.1. Compressed Natural Gas (CNG)
- 5.1.2. Liquefied Petroleum Gas (LPG)
- 5.2. Market Analysis, Insights and Forecast - by Vehicle Type
- 5.2.1. Passenger Cars
- 5.2.2. Commercial Vehicles
- 5.3. Market Analysis, Insights and Forecast - by Sales Channel
- 5.3.1. OEM
- 5.3.2. Retrofitting
- 5.4. Market Analysis, Insights and Forecast - by Region
- 5.4.1. North America
- 5.4.2. Europe
- 5.4.3. Asia Pacific
- 5.4.4. Rest of the World
- 5.1. Market Analysis, Insights and Forecast - by Fuel Type
- 6. Global CNG and LPG Vehicle Market Analysis, Insights and Forecast, 2021-2033
- 6.1. Market Analysis, Insights and Forecast - by Fuel Type
- 6.1.1. Compressed Natural Gas (CNG)
- 6.1.2. Liquefied Petroleum Gas (LPG)
- 6.2. Market Analysis, Insights and Forecast - by Vehicle Type
- 6.2.1. Passenger Cars
- 6.2.2. Commercial Vehicles
- 6.3. Market Analysis, Insights and Forecast - by Sales Channel
- 6.3.1. OEM
- 6.3.2. Retrofitting
- 6.1. Market Analysis, Insights and Forecast - by Fuel Type
- 7. North America CNG and LPG Vehicle Market Analysis, Insights and Forecast, 2020-2032
- 7.1. Market Analysis, Insights and Forecast - by Fuel Type
- 7.1.1. Compressed Natural Gas (CNG)
- 7.1.2. Liquefied Petroleum Gas (LPG)
- 7.2. Market Analysis, Insights and Forecast - by Vehicle Type
- 7.2.1. Passenger Cars
- 7.2.2. Commercial Vehicles
- 7.3. Market Analysis, Insights and Forecast - by Sales Channel
- 7.3.1. OEM
- 7.3.2. Retrofitting
- 7.1. Market Analysis, Insights and Forecast - by Fuel Type
- 8. Europe CNG and LPG Vehicle Market Analysis, Insights and Forecast, 2020-2032
- 8.1. Market Analysis, Insights and Forecast - by Fuel Type
- 8.1.1. Compressed Natural Gas (CNG)
- 8.1.2. Liquefied Petroleum Gas (LPG)
- 8.2. Market Analysis, Insights and Forecast - by Vehicle Type
- 8.2.1. Passenger Cars
- 8.2.2. Commercial Vehicles
- 8.3. Market Analysis, Insights and Forecast - by Sales Channel
- 8.3.1. OEM
- 8.3.2. Retrofitting
- 8.1. Market Analysis, Insights and Forecast - by Fuel Type
- 9. Asia Pacific CNG and LPG Vehicle Market Analysis, Insights and Forecast, 2020-2032
- 9.1. Market Analysis, Insights and Forecast - by Fuel Type
- 9.1.1. Compressed Natural Gas (CNG)
- 9.1.2. Liquefied Petroleum Gas (LPG)
- 9.2. Market Analysis, Insights and Forecast - by Vehicle Type
- 9.2.1. Passenger Cars
- 9.2.2. Commercial Vehicles
- 9.3. Market Analysis, Insights and Forecast - by Sales Channel
- 9.3.1. OEM
- 9.3.2. Retrofitting
- 9.1. Market Analysis, Insights and Forecast - by Fuel Type
- 10. Rest of the World CNG and LPG Vehicle Market Analysis, Insights and Forecast, 2020-2032
- 10.1. Market Analysis, Insights and Forecast - by Fuel Type
- 10.1.1. Compressed Natural Gas (CNG)
- 10.1.2. Liquefied Petroleum Gas (LPG)
- 10.2. Market Analysis, Insights and Forecast - by Vehicle Type
- 10.2.1. Passenger Cars
- 10.2.2. Commercial Vehicles
- 10.3. Market Analysis, Insights and Forecast - by Sales Channel
- 10.3.1. OEM
- 10.3.2. Retrofitting
- 10.1. Market Analysis, Insights and Forecast - by Fuel Type
- 11. Competitive Analysis
- 11.1. Company Profiles
- 11.1.1 Nissan Motor Co Ltd
- 11.1.1.1. Company Overview
- 11.1.1.2. Products
- 11.1.1.3. Company Financials
- 11.1.1.4. SWOT Analysis
- 11.1.2 Volkswagen AG
- 11.1.2.1. Company Overview
- 11.1.2.2. Products
- 11.1.2.3. Company Financials
- 11.1.2.4. SWOT Analysis
- 11.1.3 Tata Motors Limited
- 11.1.3.1. Company Overview
- 11.1.3.2. Products
- 11.1.3.3. Company Financials
- 11.1.3.4. SWOT Analysis
- 11.1.4 Honda Motor Company
- 11.1.4.1. Company Overview
- 11.1.4.2. Products
- 11.1.4.3. Company Financials
- 11.1.4.4. SWOT Analysis
- 11.1.5 AB VOLVO
- 11.1.5.1. Company Overview
- 11.1.5.2. Products
- 11.1.5.3. Company Financials
- 11.1.5.4. SWOT Analysis
- 11.1.6 Hyundai Motor Company
- 11.1.6.1. Company Overview
- 11.1.6.2. Products
- 11.1.6.3. Company Financials
- 11.1.6.4. SWOT Analysis
- 11.1.7 Traton SE*List Not Exhaustive
- 11.1.7.1. Company Overview
- 11.1.7.2. Products
- 11.1.7.3. Company Financials
- 11.1.7.4. SWOT Analysis
- 11.1.8 Suzuki Motor Corporation
- 11.1.8.1. Company Overview
- 11.1.8.2. Products
- 11.1.8.3. Company Financials
- 11.1.8.4. SWOT Analysis
- 11.1.9 IVECO SpA
- 11.1.9.1. Company Overview
- 11.1.9.2. Products
- 11.1.9.3. Company Financials
- 11.1.9.4. SWOT Analysis
- 11.1.10 Ford Motor Company
- 11.1.10.1. Company Overview
- 11.1.10.2. Products
- 11.1.10.3. Company Financials
- 11.1.10.4. SWOT Analysis
- 11.1.1 Nissan Motor Co Ltd
- 11.2. Market Entropy
- 11.2.1 Company's Key Areas Served
- 11.2.2 Recent Developments
- 11.3. Company Market Share Analysis 2025
- 11.3.1 Top 5 Companies Market Share Analysis
- 11.3.2 Top 3 Companies Market Share Analysis
- 11.4. List of Potential Customers
- 12. Research Methodology
List of Figures
- Figure 1: Global CNG and LPG Vehicle Market Revenue Breakdown (billion, %) by Region 2025 & 2033
- Figure 2: North America CNG and LPG Vehicle Market Revenue (billion), by Fuel Type 2025 & 2033
- Figure 3: North America CNG and LPG Vehicle Market Revenue Share (%), by Fuel Type 2025 & 2033
- Figure 4: North America CNG and LPG Vehicle Market Revenue (billion), by Vehicle Type 2025 & 2033
- Figure 5: North America CNG and LPG Vehicle Market Revenue Share (%), by Vehicle Type 2025 & 2033
- Figure 6: North America CNG and LPG Vehicle Market Revenue (billion), by Sales Channel 2025 & 2033
- Figure 7: North America CNG and LPG Vehicle Market Revenue Share (%), by Sales Channel 2025 & 2033
- Figure 8: North America CNG and LPG Vehicle Market Revenue (billion), by Country 2025 & 2033
- Figure 9: North America CNG and LPG Vehicle Market Revenue Share (%), by Country 2025 & 2033
- Figure 10: Europe CNG and LPG Vehicle Market Revenue (billion), by Fuel Type 2025 & 2033
- Figure 11: Europe CNG and LPG Vehicle Market Revenue Share (%), by Fuel Type 2025 & 2033
- Figure 12: Europe CNG and LPG Vehicle Market Revenue (billion), by Vehicle Type 2025 & 2033
- Figure 13: Europe CNG and LPG Vehicle Market Revenue Share (%), by Vehicle Type 2025 & 2033
- Figure 14: Europe CNG and LPG Vehicle Market Revenue (billion), by Sales Channel 2025 & 2033
- Figure 15: Europe CNG and LPG Vehicle Market Revenue Share (%), by Sales Channel 2025 & 2033
- Figure 16: Europe CNG and LPG Vehicle Market Revenue (billion), by Country 2025 & 2033
- Figure 17: Europe CNG and LPG Vehicle Market Revenue Share (%), by Country 2025 & 2033
- Figure 18: Asia Pacific CNG and LPG Vehicle Market Revenue (billion), by Fuel Type 2025 & 2033
- Figure 19: Asia Pacific CNG and LPG Vehicle Market Revenue Share (%), by Fuel Type 2025 & 2033
- Figure 20: Asia Pacific CNG and LPG Vehicle Market Revenue (billion), by Vehicle Type 2025 & 2033
- Figure 21: Asia Pacific CNG and LPG Vehicle Market Revenue Share (%), by Vehicle Type 2025 & 2033
- Figure 22: Asia Pacific CNG and LPG Vehicle Market Revenue (billion), by Sales Channel 2025 & 2033
- Figure 23: Asia Pacific CNG and LPG Vehicle Market Revenue Share (%), by Sales Channel 2025 & 2033
- Figure 24: Asia Pacific CNG and LPG Vehicle Market Revenue (billion), by Country 2025 & 2033
- Figure 25: Asia Pacific CNG and LPG Vehicle Market Revenue Share (%), by Country 2025 & 2033
- Figure 26: Rest of the World CNG and LPG Vehicle Market Revenue (billion), by Fuel Type 2025 & 2033
- Figure 27: Rest of the World CNG and LPG Vehicle Market Revenue Share (%), by Fuel Type 2025 & 2033
- Figure 28: Rest of the World CNG and LPG Vehicle Market Revenue (billion), by Vehicle Type 2025 & 2033
- Figure 29: Rest of the World CNG and LPG Vehicle Market Revenue Share (%), by Vehicle Type 2025 & 2033
- Figure 30: Rest of the World CNG and LPG Vehicle Market Revenue (billion), by Sales Channel 2025 & 2033
- Figure 31: Rest of the World CNG and LPG Vehicle Market Revenue Share (%), by Sales Channel 2025 & 2033
- Figure 32: Rest of the World CNG and LPG Vehicle Market Revenue (billion), by Country 2025 & 2033
- Figure 33: Rest of the World CNG and LPG Vehicle Market Revenue Share (%), by Country 2025 & 2033
List of Tables
- Table 1: Global CNG and LPG Vehicle Market Revenue billion Forecast, by Fuel Type 2020 & 2033
- Table 2: Global CNG and LPG Vehicle Market Revenue billion Forecast, by Vehicle Type 2020 & 2033
- Table 3: Global CNG and LPG Vehicle Market Revenue billion Forecast, by Sales Channel 2020 & 2033
- Table 4: Global CNG and LPG Vehicle Market Revenue billion Forecast, by Region 2020 & 2033
- Table 5: Global CNG and LPG Vehicle Market Revenue billion Forecast, by Fuel Type 2020 & 2033
- Table 6: Global CNG and LPG Vehicle Market Revenue billion Forecast, by Vehicle Type 2020 & 2033
- Table 7: Global CNG and LPG Vehicle Market Revenue billion Forecast, by Sales Channel 2020 & 2033
- Table 8: Global CNG and LPG Vehicle Market Revenue billion Forecast, by Country 2020 & 2033
- Table 9: United States CNG and LPG Vehicle Market Revenue (billion) Forecast, by Application 2020 & 2033
- Table 10: Canada CNG and LPG Vehicle Market Revenue (billion) Forecast, by Application 2020 & 2033
- Table 11: Rest of North America CNG and LPG Vehicle Market Revenue (billion) Forecast, by Application 2020 & 2033
- Table 12: Global CNG and LPG Vehicle Market Revenue billion Forecast, by Fuel Type 2020 & 2033
- Table 13: Global CNG and LPG Vehicle Market Revenue billion Forecast, by Vehicle Type 2020 & 2033
- Table 14: Global CNG and LPG Vehicle Market Revenue billion Forecast, by Sales Channel 2020 & 2033
- Table 15: Global CNG and LPG Vehicle Market Revenue billion Forecast, by Country 2020 & 2033
- Table 16: Germany CNG and LPG Vehicle Market Revenue (billion) Forecast, by Application 2020 & 2033
- Table 17: United Kingdom CNG and LPG Vehicle Market Revenue (billion) Forecast, by Application 2020 & 2033
- Table 18: France CNG and LPG Vehicle Market Revenue (billion) Forecast, by Application 2020 & 2033
- Table 19: Italy CNG and LPG Vehicle Market Revenue (billion) Forecast, by Application 2020 & 2033
- Table 20: Spain CNG and LPG Vehicle Market Revenue (billion) Forecast, by Application 2020 & 2033
- Table 21: Rest of Europe CNG and LPG Vehicle Market Revenue (billion) Forecast, by Application 2020 & 2033
- Table 22: Global CNG and LPG Vehicle Market Revenue billion Forecast, by Fuel Type 2020 & 2033
- Table 23: Global CNG and LPG Vehicle Market Revenue billion Forecast, by Vehicle Type 2020 & 2033
- Table 24: Global CNG and LPG Vehicle Market Revenue billion Forecast, by Sales Channel 2020 & 2033
- Table 25: Global CNG and LPG Vehicle Market Revenue billion Forecast, by Country 2020 & 2033
- Table 26: India CNG and LPG Vehicle Market Revenue (billion) Forecast, by Application 2020 & 2033
- Table 27: China CNG and LPG Vehicle Market Revenue (billion) Forecast, by Application 2020 & 2033
- Table 28: Japan CNG and LPG Vehicle Market Revenue (billion) Forecast, by Application 2020 & 2033
- Table 29: South Korea CNG and LPG Vehicle Market Revenue (billion) Forecast, by Application 2020 & 2033
- Table 30: Rest of Asia Pacific CNG and LPG Vehicle Market Revenue (billion) Forecast, by Application 2020 & 2033
- Table 31: Global CNG and LPG Vehicle Market Revenue billion Forecast, by Fuel Type 2020 & 2033
- Table 32: Global CNG and LPG Vehicle Market Revenue billion Forecast, by Vehicle Type 2020 & 2033
- Table 33: Global CNG and LPG Vehicle Market Revenue billion Forecast, by Sales Channel 2020 & 2033
- Table 34: Global CNG and LPG Vehicle Market Revenue billion Forecast, by Country 2020 & 2033
- Table 35: South America CNG and LPG Vehicle Market Revenue (billion) Forecast, by Application 2020 & 2033
- Table 36: Middle East and Africa CNG and LPG Vehicle Market Revenue (billion) Forecast, by Application 2020 & 2033
Frequently Asked Questions
1. What is the projected Compound Annual Growth Rate (CAGR) of the CNG and LPG Vehicle Market?
The projected CAGR is approximately 4.75%.
2. Which companies are prominent players in the CNG and LPG Vehicle Market?
Key companies in the market include Nissan Motor Co Ltd, Volkswagen AG, Tata Motors Limited, Honda Motor Company, AB VOLVO, Hyundai Motor Company, Traton SE*List Not Exhaustive, Suzuki Motor Corporation, IVECO SpA, Ford Motor Company.
3. What are the main segments of the CNG and LPG Vehicle Market?
The market segments include Fuel Type, Vehicle Type, Sales Channel.
4. Can you provide details about the market size?
The market size is estimated to be USD 6.05 billion as of 2022.
5. What are some drivers contributing to market growth?
Increase in Demand for Clean Energy Driving the Market.
6. What are the notable trends driving market growth?
Commercial Vehicles Fueling the Demand for CNG and LPG Vehicle.
7. Are there any restraints impacting market growth?
Rising Safety Concerns is Antcipated to Restrain the Market.
8. Can you provide examples of recent developments in the market?
November 2023: The government of India committed to significantly expanding the network of CNG stations, setting an ambitious target to increase the count from 6,000 to 17,700 by 2030. In October, this initiative gained further momentum with the launch of the 12th City Gas Distribution (CGD) bidding round. This strategic move is aimed at closing the gaps in the existing gas infrastructure, a step that is expected to substantially drive the growth of the CNG vehicle market.
9. What pricing options are available for accessing the report?
Pricing options include single-user, multi-user, and enterprise licenses priced at USD 4750, USD 5250, and USD 8750 respectively.
10. Is the market size provided in terms of value or volume?
The market size is provided in terms of value, measured in billion.
11. Are there any specific market keywords associated with the report?
Yes, the market keyword associated with the report is "CNG and LPG Vehicle Market," which aids in identifying and referencing the specific market segment covered.
12. How do I determine which pricing option suits my needs best?
The pricing options vary based on user requirements and access needs. Individual users may opt for single-user licenses, while businesses requiring broader access may choose multi-user or enterprise licenses for cost-effective access to the report.
13. Are there any additional resources or data provided in the CNG and LPG Vehicle Market report?
While the report offers comprehensive insights, it's advisable to review the specific contents or supplementary materials provided to ascertain if additional resources or data are available.
14. How can I stay updated on further developments or reports in the CNG and LPG Vehicle Market?
To stay informed about further developments, trends, and reports in the CNG and LPG Vehicle Market, consider subscribing to industry newsletters, following relevant companies and organizations, or regularly checking reputable industry news sources and publications.
Methodology
Step 1 - Identification of Relevant Samples Size from Population Database


Step 2 - Approaches for Defining Global Market Size (Value, Volume* & Price*)

Note*: In applicable scenarios
Step 3 - Data Sources
Primary Research
- Web Analytics
- Survey Reports
- Research Institute
- Latest Research Reports
- Opinion Leaders
Secondary Research
- Annual Reports
- White Paper
- Latest Press Release
- Industry Association
- Paid Database
- Investor Presentations

Step 4 - Data Triangulation
Involves using different sources of information in order to increase the validity of a study
These sources are likely to be stakeholders in a program - participants, other researchers, program staff, other community members, and so on.
Then we put all data in single framework & apply various statistical tools to find out the dynamic on the market.
During the analysis stage, feedback from the stakeholder groups would be compared to determine areas of agreement as well as areas of divergence