

Key Insights
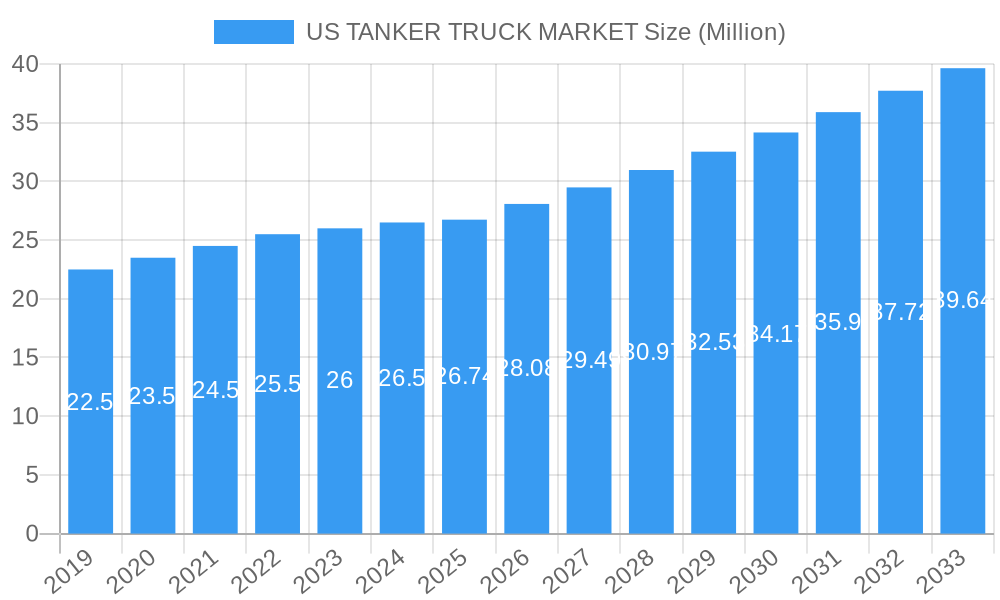
The US tanker truck market is poised for robust growth, projected to reach a substantial $26.74 million by 2025. This expansion is fueled by a steady Compound Annual Growth Rate (CAGR) of 5.03%, indicating a healthy and consistent upward trajectory. The increasing demand across diverse sectors is a primary driver. The oil and gas industry, a cornerstone of the US economy, continues to require significant transportation of crude oil and refined products. Simultaneously, the food and beverage sector relies heavily on tanker trucks for transporting liquids like milk, juices, and edible oils, with growing consumer demand bolstering this segment. Furthermore, the healthcare sector's need for transporting specialized liquids, such as medical gases and sterile solutions, is also contributing to market expansion, driven by advancements in medical technology and an aging population.
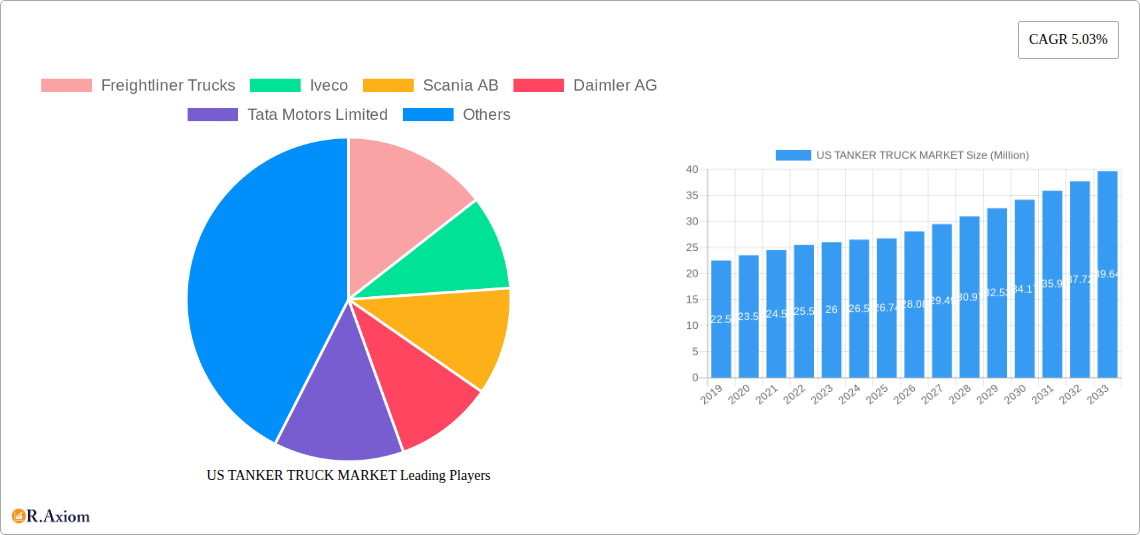
US TANKER TRUCK MARKET Market Size (In Million)
The market is further segmented by capacity, with a notable demand for trucks ranging from 1,000 to 4,000 gallons, catering to a wide array of logistical needs. The crucial role of tanker trucks in water treatment facilities, ensuring the safe and efficient transport of potable water and wastewater, cannot be overstated, especially in light of increasing regulatory scrutiny and the need for infrastructure upgrades. The chemical industry also presents a significant opportunity, with the ongoing production and distribution of various chemicals requiring specialized tanker solutions. While the market is strong, potential restraints could emerge from fluctuating fuel prices, stringent environmental regulations, and the high initial investment cost of specialized tanker trucks. However, technological advancements in truck design, such as improved fuel efficiency and enhanced safety features, coupled with the continuous need for critical resource transportation, are expected to largely offset these challenges, ensuring sustained market vitality.
US TANKER TRUCK MARKET Company Market Share
US TANKER TRUCK MARKET Market Concentration & Innovation
The US tanker truck market exhibits a moderate to high degree of market concentration, with a few major global manufacturers dominating significant market share. Companies like Daimler AG, Volvo Group, and Navistar International Corporation hold substantial positions, driven by their established manufacturing capabilities, extensive distribution networks, and comprehensive product portfolios. Innovation in this sector is primarily fueled by the increasing demand for specialized tanker trucks, advancements in materials science for enhanced durability and safety, and the burgeoning trend towards electric and alternative fuel vehicles. Regulatory frameworks, particularly those concerning emissions standards and safety protocols for hazardous material transport, play a pivotal role in shaping product development and market entry. The availability of product substitutes, such as rail or pipeline transportation for certain bulk commodities, influences the demand for tanker trucks. End-user trends are increasingly leaning towards fuel efficiency, reduced environmental impact, and advanced telematics for optimized logistics. Mergers and acquisitions (M&A) activities, while not as frequent as in some other industries, are strategic moves aimed at consolidating market share, acquiring new technologies, or expanding geographical reach. Recent M&A deals in related commercial vehicle sectors suggest a continued interest in acquiring companies with strong niche capabilities or innovative technologies. The market value for M&A transactions in this specific segment is estimated to be in the range of $500 Million to $1.2 Billion over the historical period.
US TANKER TRUCK MARKET Industry Trends & Insights
The US tanker truck market is poised for robust growth, driven by several interconnected trends and insights. A key growth driver is the expanding industrial base across sectors such as oil and gas, chemicals, and food and beverage, all of which rely heavily on efficient bulk liquid and gas transportation. The increasing infrastructure development and construction activities nationwide also necessitate the transport of various materials like cement, water, and chemicals via specialized tanker trucks, contributing significantly to market expansion. Furthermore, the growing demand for renewable energy sources, including biofuels and compressed natural gas (CNG), is creating new avenues for tanker truck utilization. Technological disruptions are primarily focused on enhancing safety, efficiency, and sustainability. The integration of advanced driver-assistance systems (ADAS), real-time tracking and telematics, and lightweight composite materials for tanker construction are becoming standard. The proactive push towards electrification of commercial fleets, with manufacturers like Daimler Truck introducing electric medium-duty trucks, is set to revolutionize the sector, although adoption for heavy-duty tanker applications will likely see a gradual increase. Consumer preferences, particularly from fleet operators, are shifting towards lower operating costs, improved fuel efficiency, enhanced driver safety, and compliance with stringent environmental regulations. The competitive dynamics of the market are characterized by intense competition among established global players and emerging niche manufacturers. The market is projected to experience a Compound Annual Growth Rate (CAGR) of approximately 6.5% during the forecast period of 2025–2033, with an estimated market penetration of over 85% for advanced safety features in new tanker truck sales by 2033. The total market size in the base year of 2025 is estimated at $15 Billion.
Dominant Markets & Segments in US TANKER TRUCK MARKET
The US tanker truck market's dominance is multifaceted, encompassing leading geographic regions and critical industry segments. Geographically, the Southern United States and the Midwest regions are considered dominant markets due to their significant presence in the oil and gas industry, extensive agricultural activities, and robust manufacturing bases. States like Texas, Oklahoma, and North Dakota, with their vast oil and gas reserves, are major consumers of tanker trucks for crude oil and refined product transportation. Similarly, agricultural heartlands in the Midwest drive demand for tanker trucks used in the transport of fertilizers, animal feed, and liquid milk.
Sector-wise dominance is clearly established within the Oil and Gas Industry. This sector consistently represents the largest share of the US tanker truck market, owing to the continuous need for transporting crude oil, refined petroleum products, natural gas, and other related chemicals. The infrastructure required for exploration, extraction, refining, and distribution inherently relies on a massive fleet of specialized tanker trucks.
The Chemical Industry also holds a significant and growing share, driven by the diverse range of chemicals that require specialized handling and transport, including acids, solvents, industrial gases, and specialty chemicals. Stringent safety regulations and the need for corrosion-resistant materials make this a demanding but lucrative segment.
The Food Sector is another dominant player, with tanker trucks essential for transporting bulk food items like milk, edible oils, juices, and liquid sweeteners. Maintaining product integrity and adhering to strict hygiene standards are paramount in this segment.
While not as large in volume as oil and gas or chemicals, the Water Treatment Facilities and Waste Management sectors are critical and growing segments. These segments rely on tanker trucks for transporting potable water, wastewater, and various types of industrial and municipal waste, often requiring specialized containment and disposal capabilities.
Segment Dominance Breakdown:
- Capacity: More Than 4,000 Gallons
- Key Drivers: Economies of scale in bulk transportation, efficiency in long-haul logistics for industries like oil and gas, and the need to minimize per-unit transportation costs.
- Dominance Analysis: This capacity segment is the largest and most dominant, particularly for bulk commodities like crude oil, refined fuels, and industrial chemicals. The ability to transport larger volumes per trip directly translates to higher operational efficiency and cost savings for major industries. Infrastructure at refineries, distribution centers, and large industrial plants are designed to accommodate these larger capacity trucks.
- Sector Type: Oil and Gas Industry
- Key Drivers: Consistent demand for energy, ongoing exploration and production activities, and the vast network of pipelines and distribution centers requiring fluid transportation.
- Dominance Analysis: The Oil and Gas industry's demand for tanker trucks is unwavering. The continuous flow of crude oil from extraction sites to refineries, and the subsequent distribution of refined products to end markets, creates a perpetual need for specialized tanker trucks, including those designed for hazardous materials. The market size for this segment is estimated to be $7 Billion in the base year.
- Sector Type: Chemical Industry
- Key Drivers: Growth in manufacturing, increasing demand for petrochemicals, and the expansion of specialty chemical production.
- Dominance Analysis: The chemical industry's reliance on tanker trucks is driven by the diverse nature of chemicals transported. This segment demands highly specialized tanker trucks built with specific materials (e.g., stainless steel, specialized linings) to handle corrosive, flammable, or toxic substances safely. The forecast period anticipates significant growth in this segment due to increasing industrial output and new chemical product development.
US TANKER TRUCK MARKET Product Developments
Product developments in the US tanker truck market are increasingly focused on enhancing safety, efficiency, and environmental sustainability. Innovations include the use of lightweight yet durable composite materials for tanker construction, reducing fuel consumption and increasing payload capacity. Advanced insulation technologies are being integrated for temperature-sensitive cargo like food products and chemicals. Furthermore, the incorporation of smart technologies, such as real-time temperature monitoring, leak detection systems, and GPS tracking, provides greater control and security over transported goods. The trend towards alternative fuels and electric powertrains is also driving the development of specialized tanker trucks designed to accommodate these new energy sources. These developments aim to provide competitive advantages by meeting stringent regulatory requirements and catering to the evolving needs of diverse end-user industries.
Report Scope & Segmentation Analysis
This report provides a comprehensive analysis of the US tanker truck market, segmented by capacity and sector type. The market is analyzed across the following key segments:
- Capacity: Less Than 1,000 Gallons: This segment primarily caters to niche applications, local deliveries, and specialized services requiring smaller volumes of liquids or gases. Its market size is estimated at $800 Million for 2025, with a projected CAGR of 5.5%.
- Capacity: Between 1,000 Gallons and 4,000 Gallons: This is a versatile segment serving a broad range of industries including food and beverage, specialized chemicals, and local distribution of various commodities. Its market size is estimated at $4.5 Billion for 2025, with a projected CAGR of 6.2%.
- Capacity: More Than 4,000 Gallons: As discussed in the Dominant Markets section, this segment represents the largest share, crucial for bulk commodity transport in sectors like oil and gas and chemicals, with a market size of $9.7 Billion for 2025 and a projected CAGR of 6.8%.
- Sector Type: Oil and Gas Industry: The largest sector, with a market size of $7 Billion in 2025 and a projected CAGR of 6.0%.
- Sector Type: Food Sector: This segment is characterized by specific hygiene and temperature control requirements, with a market size of $2.5 Billion for 2025 and a projected CAGR of 5.8%.
- Sector Type: Healthcare Sector: Primarily for the transport of medical gases and specialized fluids, this niche segment is valued at $300 Million for 2025, with a projected CAGR of 5.0%.
- Sector Type: Water Treatment Facilities: Essential for potable water and wastewater transport, this segment is valued at $1.2 Billion for 2025, with a projected CAGR of 5.7%.
- Sector Type: Chemical Industry: A high-growth segment requiring specialized equipment, with a market size of $3.8 Billion for 2025 and a projected CAGR of 6.5%.
- Sector Type: Construction: For transporting materials like cement, water, and asphalt, this segment is valued at $700 Million for 2025, with a projected CAGR of 5.3%.
- Sector Type: Waste Management: Crucial for environmental services, with a market size of $800 Million for 2025, and a projected CAGR of 5.6%.
- Sector Type: Other Sectors: Encompassing various specialized industrial applications, this segment is valued at $500 Million for 2025, with a projected CAGR of 5.2%.
Key Drivers of US TANKER TRUCK MARKET Growth
The growth of the US tanker truck market is propelled by several key drivers. Economic expansion and industrial output across vital sectors like oil and gas, chemicals, and agriculture are primary catalysts, creating sustained demand for bulk liquid and gas transportation. Infrastructure development and government investments in transportation networks further stimulate the need for construction-related materials and fuel delivery. Stringent environmental regulations and safety standards are also driving innovation, pushing manufacturers to develop more efficient, cleaner, and safer tanker truck technologies. The increasing focus on supply chain optimization and efficiency encourages the adoption of advanced telematics and larger capacity vehicles. Furthermore, the growing demand for renewable energy sources like biofuels and CNG is opening new markets for specialized tanker truck applications.
Challenges in the US TANKER TRUCK MARKET Sector
Despite robust growth prospects, the US tanker truck market faces several challenges. Increasingly stringent emission standards and fuel efficiency mandates necessitate significant R&D investments and can lead to higher initial vehicle costs. Fluctuations in fuel prices directly impact operating expenses for tanker truck fleets, influencing purchasing decisions. Labor shortages in the trucking industry, particularly for skilled drivers, can affect operational capacity and efficiency. Supply chain disruptions, as seen in recent years, can lead to delays in component availability and impact manufacturing timelines. High initial investment costs for specialized tanker trucks, especially those equipped with advanced safety features or alternative fuel powertrains, can be a barrier for smaller operators. The long replacement cycles for heavy-duty vehicles also mean that market penetration of new technologies can be gradual.
Emerging Opportunities in US TANKER TRUCK MARKET
Emerging opportunities in the US tanker truck market are significant and varied. The transition towards electric and alternative fuel vehicles presents a major growth avenue, with increasing demand for electric tanker trucks for local and regional distribution, as well as those designed for hydrogen and CNG transport. The expansion of the renewable energy sector, including biofuels and advanced materials for solar and wind energy projects, will require specialized transport solutions. Technological advancements in smart trucking, such as autonomous driving capabilities and predictive maintenance, offer opportunities for enhanced efficiency and safety. The growing demand for specialized chemical transport, driven by advancements in specialty chemicals and pharmaceuticals, will fuel the need for highly customized tanker trucks. Furthermore, the increasing focus on sustainable logistics and circular economy principles is creating opportunities for tanker trucks involved in waste management, recycling, and water reclamation.
Leading Players in the US TANKER TRUCK MARKET Market
- Freightliner Trucks
- Iveco
- Scania AB
- Daimler AG
- Tata Motors Limited
- Volvo Group
- Navistar International Corporation
- Hyundai Motor Company
- Polar Tank Trailer
- Kenworth
- MAN Truck & Bus AG
Key Developments in US TANKER TRUCK MARKET Industry
- December 2023: Trina Solar introduced its latest lineup of Trina-branded trucks for transporting photovoltaic (PV) modules for large-scale solar projects across the United States. This initiative is part of their fleet strategy, with plans to transition to electric vehicles for deliveries starting in 2024. Currently, Trina utilizes these trucks for over 35% of its utility projects.
- April 2023: Daimler Truck unveiled Rizon, a new brand of medium-duty electric trucks specifically designed for the US market. This development signals a significant push towards electrification in the commercial vehicle segment.
Strategic Outlook for US TANKER TRUCK MARKET Market
The strategic outlook for the US tanker truck market is overwhelmingly positive, driven by a confluence of ongoing industrial growth, technological innovation, and a growing commitment to sustainability. The market will continue to be shaped by the demand for efficient and safe transportation of essential commodities, with a discernible shift towards greener technologies. Manufacturers focusing on electric and alternative fuel solutions, alongside those offering advanced safety and telematics features, are well-positioned for future success. Strategic investments in expanding manufacturing capabilities for specialized tanker designs and building robust after-sales service networks will be crucial. Furthermore, companies that can adapt to evolving regulatory landscapes and capitalize on emerging opportunities in sectors like renewable energy and specialized chemical transport will secure a significant competitive advantage in this dynamic market. The projected market size of $25 Billion by 2033 underscores the substantial growth potential.
US TANKER TRUCK MARKET Segmentation
-
1. Capacity
- 1.1. Less Than 1, 000 Gallons
- 1.2. Between 1, 000 Gallons and 4, 000 Gallons
- 1.3. More Than 4, 000 Gallons
-
2. Sector Type
- 2.1. Oil and Gas Industry
- 2.2. Food Sector
- 2.3. Healthcare Sector
- 2.4. Water Treatment Facilities
- 2.5. Chemical Industry
- 2.6. Construction
- 2.7. Waste Management
- 2.8. Other Sectors
US TANKER TRUCK MARKET Segmentation By Geography
-
1. North America
- 1.1. United States
- 1.2. Canada
- 1.3. Mexico
-
2. South America
- 2.1. Brazil
- 2.2. Argentina
- 2.3. Rest of South America
-
3. Europe
- 3.1. United Kingdom
- 3.2. Germany
- 3.3. France
- 3.4. Italy
- 3.5. Spain
- 3.6. Russia
- 3.7. Benelux
- 3.8. Nordics
- 3.9. Rest of Europe
-
4. Middle East & Africa
- 4.1. Turkey
- 4.2. Israel
- 4.3. GCC
- 4.4. North Africa
- 4.5. South Africa
- 4.6. Rest of Middle East & Africa
-
5. Asia Pacific
- 5.1. China
- 5.2. India
- 5.3. Japan
- 5.4. South Korea
- 5.5. ASEAN
- 5.6. Oceania
- 5.7. Rest of Asia Pacific
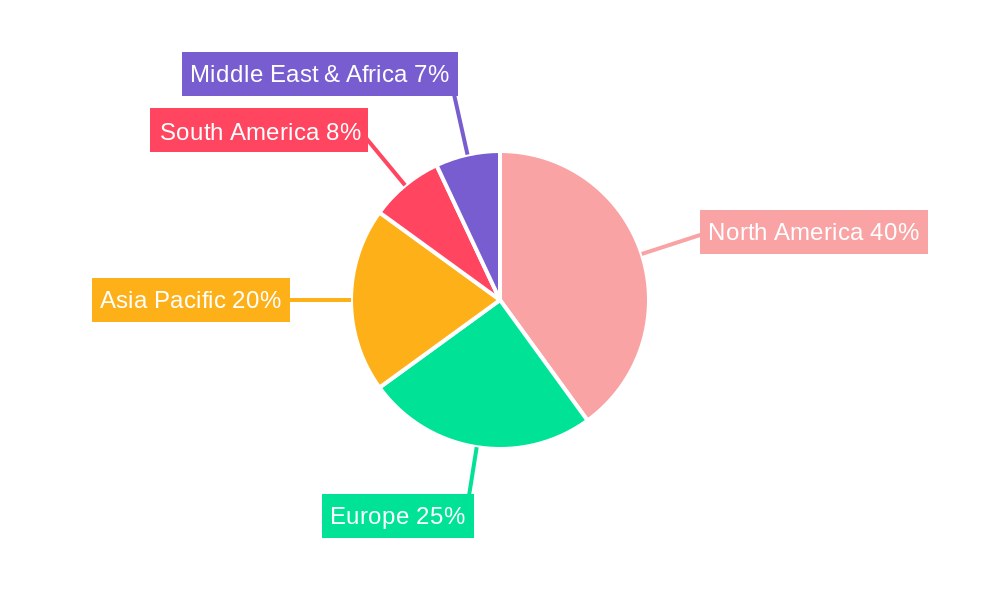
US TANKER TRUCK MARKET Regional Market Share
Geographic Coverage of US TANKER TRUCK MARKET
US TANKER TRUCK MARKET REPORT HIGHLIGHTS
| Aspects | Details |
|---|---|
| Study Period | 2020-2034 |
| Base Year | 2025 |
| Estimated Year | 2026 |
| Forecast Period | 2026-2034 |
| Historical Period | 2020-2025 |
| Growth Rate | CAGR of 5.03% from 2020-2034 |
| Segmentation |
|
Table of Contents
- 1. Introduction
- 1.1. Research Scope
- 1.2. Market Segmentation
- 1.3. Research Objective
- 1.4. Definitions and Assumptions
- 2. Executive Summary
- 2.1. Market Snapshot
- 3. Market Dynamics
- 3.1. Market Drivers
- 3.2. Market Restrains
- 3.3. Market Trends
- 3.4. Market Opportunities
- 4. Market Factor Analysis
- 4.1. Porters Five Forces
- 4.1.1. Bargaining Power of Suppliers
- 4.1.2. Bargaining Power of Buyers
- 4.1.3. Threat of New Entrants
- 4.1.4. Threat of Substitutes
- 4.1.5. Competitive Rivalry
- 4.2. PESTEL analysis
- 4.3. BCG Analysis
- 4.3.1. Stars (High Growth, High Market Share)
- 4.3.2. Cash Cows (Low Growth, High Market Share)
- 4.3.3. Question Mark (High Growth, Low Market Share)
- 4.3.4. Dogs (Low Growth, Low Market Share)
- 4.4. Ansoff Matrix Analysis
- 4.5. Supply Chain Analysis
- 4.6. Regulatory Landscape
- 4.7. Current Market Potential and Opportunity Assessment (TAM–SAM–SOM Framework)
- 4.8. RAX Analyst Note
- 4.1. Porters Five Forces
- 5. Market Analysis, Insights and Forecast 2021-2033
- 5.1. Market Analysis, Insights and Forecast - by Capacity
- 5.1.1. Less Than 1, 000 Gallons
- 5.1.2. Between 1, 000 Gallons and 4, 000 Gallons
- 5.1.3. More Than 4, 000 Gallons
- 5.2. Market Analysis, Insights and Forecast - by Sector Type
- 5.2.1. Oil and Gas Industry
- 5.2.2. Food Sector
- 5.2.3. Healthcare Sector
- 5.2.4. Water Treatment Facilities
- 5.2.5. Chemical Industry
- 5.2.6. Construction
- 5.2.7. Waste Management
- 5.2.8. Other Sectors
- 5.3. Market Analysis, Insights and Forecast - by Region
- 5.3.1. North America
- 5.3.2. South America
- 5.3.3. Europe
- 5.3.4. Middle East & Africa
- 5.3.5. Asia Pacific
- 5.1. Market Analysis, Insights and Forecast - by Capacity
- 6. Global US TANKER TRUCK MARKET Analysis, Insights and Forecast, 2021-2033
- 6.1. Market Analysis, Insights and Forecast - by Capacity
- 6.1.1. Less Than 1, 000 Gallons
- 6.1.2. Between 1, 000 Gallons and 4, 000 Gallons
- 6.1.3. More Than 4, 000 Gallons
- 6.2. Market Analysis, Insights and Forecast - by Sector Type
- 6.2.1. Oil and Gas Industry
- 6.2.2. Food Sector
- 6.2.3. Healthcare Sector
- 6.2.4. Water Treatment Facilities
- 6.2.5. Chemical Industry
- 6.2.6. Construction
- 6.2.7. Waste Management
- 6.2.8. Other Sectors
- 6.1. Market Analysis, Insights and Forecast - by Capacity
- 7. North America US TANKER TRUCK MARKET Analysis, Insights and Forecast, 2020-2032
- 7.1. Market Analysis, Insights and Forecast - by Capacity
- 7.1.1. Less Than 1, 000 Gallons
- 7.1.2. Between 1, 000 Gallons and 4, 000 Gallons
- 7.1.3. More Than 4, 000 Gallons
- 7.2. Market Analysis, Insights and Forecast - by Sector Type
- 7.2.1. Oil and Gas Industry
- 7.2.2. Food Sector
- 7.2.3. Healthcare Sector
- 7.2.4. Water Treatment Facilities
- 7.2.5. Chemical Industry
- 7.2.6. Construction
- 7.2.7. Waste Management
- 7.2.8. Other Sectors
- 7.1. Market Analysis, Insights and Forecast - by Capacity
- 8. South America US TANKER TRUCK MARKET Analysis, Insights and Forecast, 2020-2032
- 8.1. Market Analysis, Insights and Forecast - by Capacity
- 8.1.1. Less Than 1, 000 Gallons
- 8.1.2. Between 1, 000 Gallons and 4, 000 Gallons
- 8.1.3. More Than 4, 000 Gallons
- 8.2. Market Analysis, Insights and Forecast - by Sector Type
- 8.2.1. Oil and Gas Industry
- 8.2.2. Food Sector
- 8.2.3. Healthcare Sector
- 8.2.4. Water Treatment Facilities
- 8.2.5. Chemical Industry
- 8.2.6. Construction
- 8.2.7. Waste Management
- 8.2.8. Other Sectors
- 8.1. Market Analysis, Insights and Forecast - by Capacity
- 9. Europe US TANKER TRUCK MARKET Analysis, Insights and Forecast, 2020-2032
- 9.1. Market Analysis, Insights and Forecast - by Capacity
- 9.1.1. Less Than 1, 000 Gallons
- 9.1.2. Between 1, 000 Gallons and 4, 000 Gallons
- 9.1.3. More Than 4, 000 Gallons
- 9.2. Market Analysis, Insights and Forecast - by Sector Type
- 9.2.1. Oil and Gas Industry
- 9.2.2. Food Sector
- 9.2.3. Healthcare Sector
- 9.2.4. Water Treatment Facilities
- 9.2.5. Chemical Industry
- 9.2.6. Construction
- 9.2.7. Waste Management
- 9.2.8. Other Sectors
- 9.1. Market Analysis, Insights and Forecast - by Capacity
- 10. Middle East & Africa US TANKER TRUCK MARKET Analysis, Insights and Forecast, 2020-2032
- 10.1. Market Analysis, Insights and Forecast - by Capacity
- 10.1.1. Less Than 1, 000 Gallons
- 10.1.2. Between 1, 000 Gallons and 4, 000 Gallons
- 10.1.3. More Than 4, 000 Gallons
- 10.2. Market Analysis, Insights and Forecast - by Sector Type
- 10.2.1. Oil and Gas Industry
- 10.2.2. Food Sector
- 10.2.3. Healthcare Sector
- 10.2.4. Water Treatment Facilities
- 10.2.5. Chemical Industry
- 10.2.6. Construction
- 10.2.7. Waste Management
- 10.2.8. Other Sectors
- 10.1. Market Analysis, Insights and Forecast - by Capacity
- 11. Asia Pacific US TANKER TRUCK MARKET Analysis, Insights and Forecast, 2020-2032
- 11.1. Market Analysis, Insights and Forecast - by Capacity
- 11.1.1. Less Than 1, 000 Gallons
- 11.1.2. Between 1, 000 Gallons and 4, 000 Gallons
- 11.1.3. More Than 4, 000 Gallons
- 11.2. Market Analysis, Insights and Forecast - by Sector Type
- 11.2.1. Oil and Gas Industry
- 11.2.2. Food Sector
- 11.2.3. Healthcare Sector
- 11.2.4. Water Treatment Facilities
- 11.2.5. Chemical Industry
- 11.2.6. Construction
- 11.2.7. Waste Management
- 11.2.8. Other Sectors
- 11.1. Market Analysis, Insights and Forecast - by Capacity
- 12. Competitive Analysis
- 12.1. Company Profiles
- 12.1.1 Freightliner Trucks
- 12.1.1.1. Company Overview
- 12.1.1.2. Products
- 12.1.1.3. Company Financials
- 12.1.1.4. SWOT Analysis
- 12.1.2 Iveco
- 12.1.2.1. Company Overview
- 12.1.2.2. Products
- 12.1.2.3. Company Financials
- 12.1.2.4. SWOT Analysis
- 12.1.3 Scania AB
- 12.1.3.1. Company Overview
- 12.1.3.2. Products
- 12.1.3.3. Company Financials
- 12.1.3.4. SWOT Analysis
- 12.1.4 Daimler AG
- 12.1.4.1. Company Overview
- 12.1.4.2. Products
- 12.1.4.3. Company Financials
- 12.1.4.4. SWOT Analysis
- 12.1.5 Tata Motors Limited
- 12.1.5.1. Company Overview
- 12.1.5.2. Products
- 12.1.5.3. Company Financials
- 12.1.5.4. SWOT Analysis
- 12.1.6 Volvo Group
- 12.1.6.1. Company Overview
- 12.1.6.2. Products
- 12.1.6.3. Company Financials
- 12.1.6.4. SWOT Analysis
- 12.1.7 Navistar International Corporation
- 12.1.7.1. Company Overview
- 12.1.7.2. Products
- 12.1.7.3. Company Financials
- 12.1.7.4. SWOT Analysis
- 12.1.8 Hyundai Motor Company
- 12.1.8.1. Company Overview
- 12.1.8.2. Products
- 12.1.8.3. Company Financials
- 12.1.8.4. SWOT Analysis
- 12.1.9 Polar Tank Trailer*List Not Exhaustive
- 12.1.9.1. Company Overview
- 12.1.9.2. Products
- 12.1.9.3. Company Financials
- 12.1.9.4. SWOT Analysis
- 12.1.10 Kenworth
- 12.1.10.1. Company Overview
- 12.1.10.2. Products
- 12.1.10.3. Company Financials
- 12.1.10.4. SWOT Analysis
- 12.1.11 MAN Truck & Bus AG
- 12.1.11.1. Company Overview
- 12.1.11.2. Products
- 12.1.11.3. Company Financials
- 12.1.11.4. SWOT Analysis
- 12.1.1 Freightliner Trucks
- 12.2. Market Entropy
- 12.2.1 Company's Key Areas Served
- 12.2.2 Recent Developments
- 12.3. Company Market Share Analysis 2025
- 12.3.1 Top 5 Companies Market Share Analysis
- 12.3.2 Top 3 Companies Market Share Analysis
- 12.4. List of Potential Customers
- 13. Research Methodology
List of Figures
- Figure 1: Global US TANKER TRUCK MARKET Revenue Breakdown (Million, %) by Region 2025 & 2033
- Figure 2: North America US TANKER TRUCK MARKET Revenue (Million), by Capacity 2025 & 2033
- Figure 3: North America US TANKER TRUCK MARKET Revenue Share (%), by Capacity 2025 & 2033
- Figure 4: North America US TANKER TRUCK MARKET Revenue (Million), by Sector Type 2025 & 2033
- Figure 5: North America US TANKER TRUCK MARKET Revenue Share (%), by Sector Type 2025 & 2033
- Figure 6: North America US TANKER TRUCK MARKET Revenue (Million), by Country 2025 & 2033
- Figure 7: North America US TANKER TRUCK MARKET Revenue Share (%), by Country 2025 & 2033
- Figure 8: South America US TANKER TRUCK MARKET Revenue (Million), by Capacity 2025 & 2033
- Figure 9: South America US TANKER TRUCK MARKET Revenue Share (%), by Capacity 2025 & 2033
- Figure 10: South America US TANKER TRUCK MARKET Revenue (Million), by Sector Type 2025 & 2033
- Figure 11: South America US TANKER TRUCK MARKET Revenue Share (%), by Sector Type 2025 & 2033
- Figure 12: South America US TANKER TRUCK MARKET Revenue (Million), by Country 2025 & 2033
- Figure 13: South America US TANKER TRUCK MARKET Revenue Share (%), by Country 2025 & 2033
- Figure 14: Europe US TANKER TRUCK MARKET Revenue (Million), by Capacity 2025 & 2033
- Figure 15: Europe US TANKER TRUCK MARKET Revenue Share (%), by Capacity 2025 & 2033
- Figure 16: Europe US TANKER TRUCK MARKET Revenue (Million), by Sector Type 2025 & 2033
- Figure 17: Europe US TANKER TRUCK MARKET Revenue Share (%), by Sector Type 2025 & 2033
- Figure 18: Europe US TANKER TRUCK MARKET Revenue (Million), by Country 2025 & 2033
- Figure 19: Europe US TANKER TRUCK MARKET Revenue Share (%), by Country 2025 & 2033
- Figure 20: Middle East & Africa US TANKER TRUCK MARKET Revenue (Million), by Capacity 2025 & 2033
- Figure 21: Middle East & Africa US TANKER TRUCK MARKET Revenue Share (%), by Capacity 2025 & 2033
- Figure 22: Middle East & Africa US TANKER TRUCK MARKET Revenue (Million), by Sector Type 2025 & 2033
- Figure 23: Middle East & Africa US TANKER TRUCK MARKET Revenue Share (%), by Sector Type 2025 & 2033
- Figure 24: Middle East & Africa US TANKER TRUCK MARKET Revenue (Million), by Country 2025 & 2033
- Figure 25: Middle East & Africa US TANKER TRUCK MARKET Revenue Share (%), by Country 2025 & 2033
- Figure 26: Asia Pacific US TANKER TRUCK MARKET Revenue (Million), by Capacity 2025 & 2033
- Figure 27: Asia Pacific US TANKER TRUCK MARKET Revenue Share (%), by Capacity 2025 & 2033
- Figure 28: Asia Pacific US TANKER TRUCK MARKET Revenue (Million), by Sector Type 2025 & 2033
- Figure 29: Asia Pacific US TANKER TRUCK MARKET Revenue Share (%), by Sector Type 2025 & 2033
- Figure 30: Asia Pacific US TANKER TRUCK MARKET Revenue (Million), by Country 2025 & 2033
- Figure 31: Asia Pacific US TANKER TRUCK MARKET Revenue Share (%), by Country 2025 & 2033
List of Tables
- Table 1: Global US TANKER TRUCK MARKET Revenue Million Forecast, by Capacity 2020 & 2033
- Table 2: Global US TANKER TRUCK MARKET Revenue Million Forecast, by Sector Type 2020 & 2033
- Table 3: Global US TANKER TRUCK MARKET Revenue Million Forecast, by Region 2020 & 2033
- Table 4: Global US TANKER TRUCK MARKET Revenue Million Forecast, by Capacity 2020 & 2033
- Table 5: Global US TANKER TRUCK MARKET Revenue Million Forecast, by Sector Type 2020 & 2033
- Table 6: Global US TANKER TRUCK MARKET Revenue Million Forecast, by Country 2020 & 2033
- Table 7: United States US TANKER TRUCK MARKET Revenue (Million) Forecast, by Application 2020 & 2033
- Table 8: Canada US TANKER TRUCK MARKET Revenue (Million) Forecast, by Application 2020 & 2033
- Table 9: Mexico US TANKER TRUCK MARKET Revenue (Million) Forecast, by Application 2020 & 2033
- Table 10: Global US TANKER TRUCK MARKET Revenue Million Forecast, by Capacity 2020 & 2033
- Table 11: Global US TANKER TRUCK MARKET Revenue Million Forecast, by Sector Type 2020 & 2033
- Table 12: Global US TANKER TRUCK MARKET Revenue Million Forecast, by Country 2020 & 2033
- Table 13: Brazil US TANKER TRUCK MARKET Revenue (Million) Forecast, by Application 2020 & 2033
- Table 14: Argentina US TANKER TRUCK MARKET Revenue (Million) Forecast, by Application 2020 & 2033
- Table 15: Rest of South America US TANKER TRUCK MARKET Revenue (Million) Forecast, by Application 2020 & 2033
- Table 16: Global US TANKER TRUCK MARKET Revenue Million Forecast, by Capacity 2020 & 2033
- Table 17: Global US TANKER TRUCK MARKET Revenue Million Forecast, by Sector Type 2020 & 2033
- Table 18: Global US TANKER TRUCK MARKET Revenue Million Forecast, by Country 2020 & 2033
- Table 19: United Kingdom US TANKER TRUCK MARKET Revenue (Million) Forecast, by Application 2020 & 2033
- Table 20: Germany US TANKER TRUCK MARKET Revenue (Million) Forecast, by Application 2020 & 2033
- Table 21: France US TANKER TRUCK MARKET Revenue (Million) Forecast, by Application 2020 & 2033
- Table 22: Italy US TANKER TRUCK MARKET Revenue (Million) Forecast, by Application 2020 & 2033
- Table 23: Spain US TANKER TRUCK MARKET Revenue (Million) Forecast, by Application 2020 & 2033
- Table 24: Russia US TANKER TRUCK MARKET Revenue (Million) Forecast, by Application 2020 & 2033
- Table 25: Benelux US TANKER TRUCK MARKET Revenue (Million) Forecast, by Application 2020 & 2033
- Table 26: Nordics US TANKER TRUCK MARKET Revenue (Million) Forecast, by Application 2020 & 2033
- Table 27: Rest of Europe US TANKER TRUCK MARKET Revenue (Million) Forecast, by Application 2020 & 2033
- Table 28: Global US TANKER TRUCK MARKET Revenue Million Forecast, by Capacity 2020 & 2033
- Table 29: Global US TANKER TRUCK MARKET Revenue Million Forecast, by Sector Type 2020 & 2033
- Table 30: Global US TANKER TRUCK MARKET Revenue Million Forecast, by Country 2020 & 2033
- Table 31: Turkey US TANKER TRUCK MARKET Revenue (Million) Forecast, by Application 2020 & 2033
- Table 32: Israel US TANKER TRUCK MARKET Revenue (Million) Forecast, by Application 2020 & 2033
- Table 33: GCC US TANKER TRUCK MARKET Revenue (Million) Forecast, by Application 2020 & 2033
- Table 34: North Africa US TANKER TRUCK MARKET Revenue (Million) Forecast, by Application 2020 & 2033
- Table 35: South Africa US TANKER TRUCK MARKET Revenue (Million) Forecast, by Application 2020 & 2033
- Table 36: Rest of Middle East & Africa US TANKER TRUCK MARKET Revenue (Million) Forecast, by Application 2020 & 2033
- Table 37: Global US TANKER TRUCK MARKET Revenue Million Forecast, by Capacity 2020 & 2033
- Table 38: Global US TANKER TRUCK MARKET Revenue Million Forecast, by Sector Type 2020 & 2033
- Table 39: Global US TANKER TRUCK MARKET Revenue Million Forecast, by Country 2020 & 2033
- Table 40: China US TANKER TRUCK MARKET Revenue (Million) Forecast, by Application 2020 & 2033
- Table 41: India US TANKER TRUCK MARKET Revenue (Million) Forecast, by Application 2020 & 2033
- Table 42: Japan US TANKER TRUCK MARKET Revenue (Million) Forecast, by Application 2020 & 2033
- Table 43: South Korea US TANKER TRUCK MARKET Revenue (Million) Forecast, by Application 2020 & 2033
- Table 44: ASEAN US TANKER TRUCK MARKET Revenue (Million) Forecast, by Application 2020 & 2033
- Table 45: Oceania US TANKER TRUCK MARKET Revenue (Million) Forecast, by Application 2020 & 2033
- Table 46: Rest of Asia Pacific US TANKER TRUCK MARKET Revenue (Million) Forecast, by Application 2020 & 2033
Frequently Asked Questions
1. What is the projected Compound Annual Growth Rate (CAGR) of the US TANKER TRUCK MARKET?
The projected CAGR is approximately 5.03%.
2. Which companies are prominent players in the US TANKER TRUCK MARKET?
Key companies in the market include Freightliner Trucks, Iveco, Scania AB, Daimler AG, Tata Motors Limited, Volvo Group, Navistar International Corporation, Hyundai Motor Company, Polar Tank Trailer*List Not Exhaustive, Kenworth, MAN Truck & Bus AG.
3. What are the main segments of the US TANKER TRUCK MARKET?
The market segments include Capacity, Sector Type.
4. Can you provide details about the market size?
The market size is estimated to be USD 26.74 Million as of 2022.
5. What are some drivers contributing to market growth?
Increased Vehicle Sales to Fuel Market Growth.
6. What are the notable trends driving market growth?
Between 1. 000 Gallons and 4. 000 Gallons Tanker Truck is Dominating the Market.
7. Are there any restraints impacting market growth?
N/A
8. Can you provide examples of recent developments in the market?
In December 2023, Trina Solar, a provider of intelligent solar solutions, introduced its latest lineup of Trina-branded trucks to transport photovoltaic (PV) modules for large-scale solar projects across the United States.
9. What pricing options are available for accessing the report?
Pricing options include single-user, multi-user, and enterprise licenses priced at USD 3800, USD 4500, and USD 5800 respectively.
10. Is the market size provided in terms of value or volume?
The market size is provided in terms of value, measured in Million.
11. Are there any specific market keywords associated with the report?
Yes, the market keyword associated with the report is "US TANKER TRUCK MARKET," which aids in identifying and referencing the specific market segment covered.
12. How do I determine which pricing option suits my needs best?
The pricing options vary based on user requirements and access needs. Individual users may opt for single-user licenses, while businesses requiring broader access may choose multi-user or enterprise licenses for cost-effective access to the report.
13. Are there any additional resources or data provided in the US TANKER TRUCK MARKET report?
While the report offers comprehensive insights, it's advisable to review the specific contents or supplementary materials provided to ascertain if additional resources or data are available.
14. How can I stay updated on further developments or reports in the US TANKER TRUCK MARKET?
To stay informed about further developments, trends, and reports in the US TANKER TRUCK MARKET, consider subscribing to industry newsletters, following relevant companies and organizations, or regularly checking reputable industry news sources and publications.
Methodology
Step 1 - Identification of Relevant Samples Size from Population Database


Step 2 - Approaches for Defining Global Market Size (Value, Volume* & Price*)

Note*: In applicable scenarios
Step 3 - Data Sources
Primary Research
- Web Analytics
- Survey Reports
- Research Institute
- Latest Research Reports
- Opinion Leaders
Secondary Research
- Annual Reports
- White Paper
- Latest Press Release
- Industry Association
- Paid Database
- Investor Presentations

Step 4 - Data Triangulation
Involves using different sources of information in order to increase the validity of a study
These sources are likely to be stakeholders in a program - participants, other researchers, program staff, other community members, and so on.
Then we put all data in single framework & apply various statistical tools to find out the dynamic on the market.
During the analysis stage, feedback from the stakeholder groups would be compared to determine areas of agreement as well as areas of divergence