

Key Insights
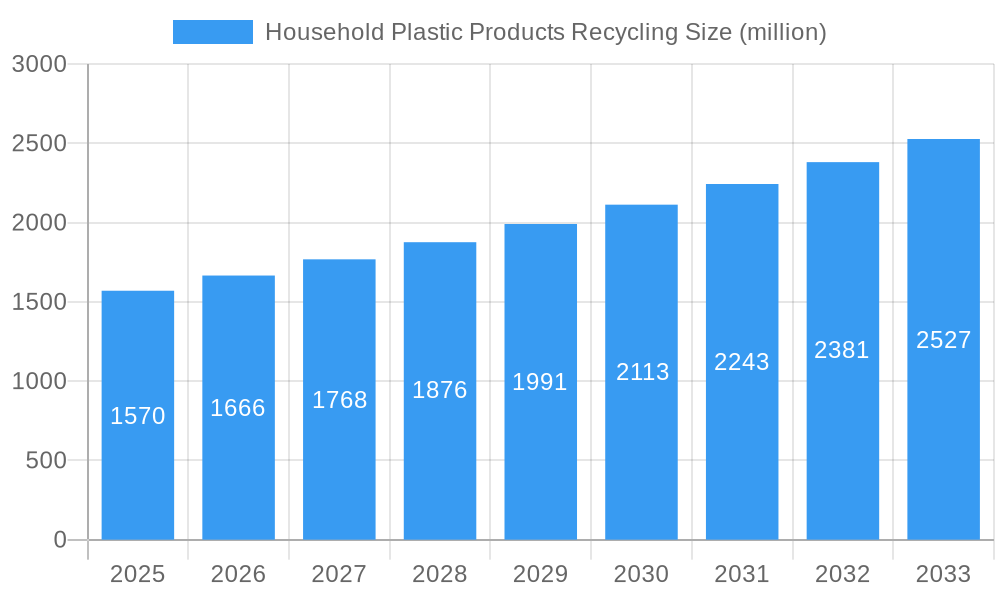
The global household plastic products recycling market, valued at $1570 million in 2025, is projected to experience robust growth, driven by increasing environmental concerns, stringent government regulations promoting sustainable waste management, and rising consumer awareness regarding plastic pollution. A Compound Annual Growth Rate (CAGR) of 5.8% from 2025 to 2033 indicates a significant expansion of this market. Key drivers include the escalating demand for recycled plastics in various applications, technological advancements improving recycling efficiency, and the emergence of innovative recycling technologies like chemical recycling. Companies like Indorama Ventures, Far Eastern New Century, and Veolia are at the forefront of this growth, investing heavily in infrastructure and R&D to enhance recycling capabilities and expand their market share. However, challenges persist, including the heterogeneous nature of household plastic waste, the cost associated with sorting and processing different plastic types, and the lack of widespread recycling infrastructure in certain regions.
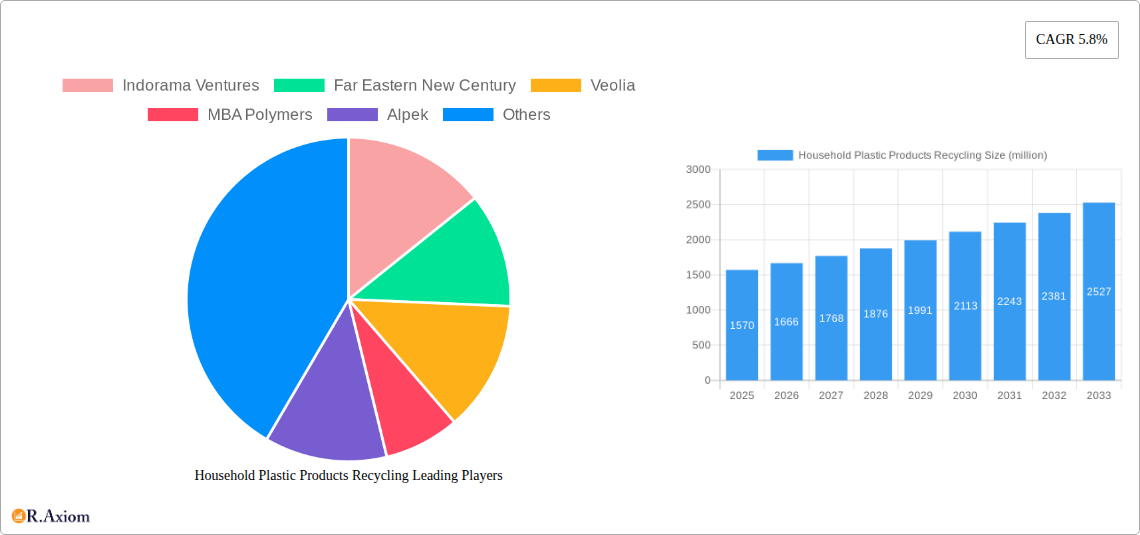
Household Plastic Products Recycling Market Size (In Billion)
Despite these restraints, the market is expected to witness a shift towards higher-value recycled plastics, driven by brands committed to incorporating recycled content in their products. The increasing adoption of Extended Producer Responsibility (EPR) schemes globally will further stimulate growth by incentivizing producers to design for recyclability and manage end-of-life plastic waste. Segmentation within the market is likely to reflect variations in recycling technology employed (mechanical vs. chemical), types of plastics recycled (PET, HDPE, etc.), and geographic distribution. Future growth will depend on overcoming technological limitations, improving collection efficiency, and fostering collaboration between governments, businesses, and consumers to achieve sustainable plastic waste management. The forecast period from 2025 to 2033 promises significant growth opportunities for companies involved in collection, sorting, processing, and the utilization of recycled household plastics.
Household Plastic Products Recycling Company Market Share
Household Plastic Products Recycling Market: 2019-2033 Forecast & Analysis
This comprehensive report provides a detailed analysis of the global household plastic products recycling market, offering actionable insights for industry stakeholders, investors, and policymakers. The study period covers 2019-2033, with a base year of 2025 and a forecast period of 2025-2033. The report utilizes data from the historical period (2019-2024) to project future market trends, covering market size (in millions), CAGR, market share, and key developments. The market is segmented by various factors and key players like Indorama Ventures, Far Eastern New Century, Veolia, MBA Polymers, Alpek, Plastipak Holdings, Greentech, SUEZ, Biffa, Visy, Kingfa, and INTCO are profiled extensively.
Household Plastic Products Recycling Market Concentration & Innovation
This section analyzes the market concentration, examining the market share of leading players like Indorama Ventures, Veolia, and Far Eastern New Century. The report details the innovative technologies driving growth, such as advanced sorting and recycling processes. We explore the influence of regulatory frameworks, including extended producer responsibility (EPR) schemes, and their impact on market dynamics. The analysis also considers the role of product substitutes (e.g., biodegradable plastics) and evolving end-user trends, incorporating data on mergers and acquisitions (M&A) activities within the sector. The total M&A deal value for the period 2019-2024 is estimated at $xx million. Key metrics include:
- Market Share of Top 5 Players: xx% (2025)
- Average M&A Deal Value: $xx million (2019-2024)
- Number of M&A deals: xx (2019-2024)
- Key Innovation Areas: Chemical Recycling, Advanced Sorting Technologies
Household Plastic Products Recycling Industry Trends & Insights
This section provides a detailed overview of the household plastic products recycling market, examining key growth drivers like increasing environmental awareness and stringent regulations. The report analyzes technological disruptions such as the emergence of chemical recycling methods and their impact on market penetration. Consumer preferences for recycled products and their influence on demand are also discussed, alongside an in-depth assessment of competitive dynamics. Key metrics include:
- Market Size (2025): $xx million
- CAGR (2025-2033): xx%
- Market Penetration of Recycled Plastics: xx% (2025)
Dominant Markets & Segments in Household Plastic Products Recycling
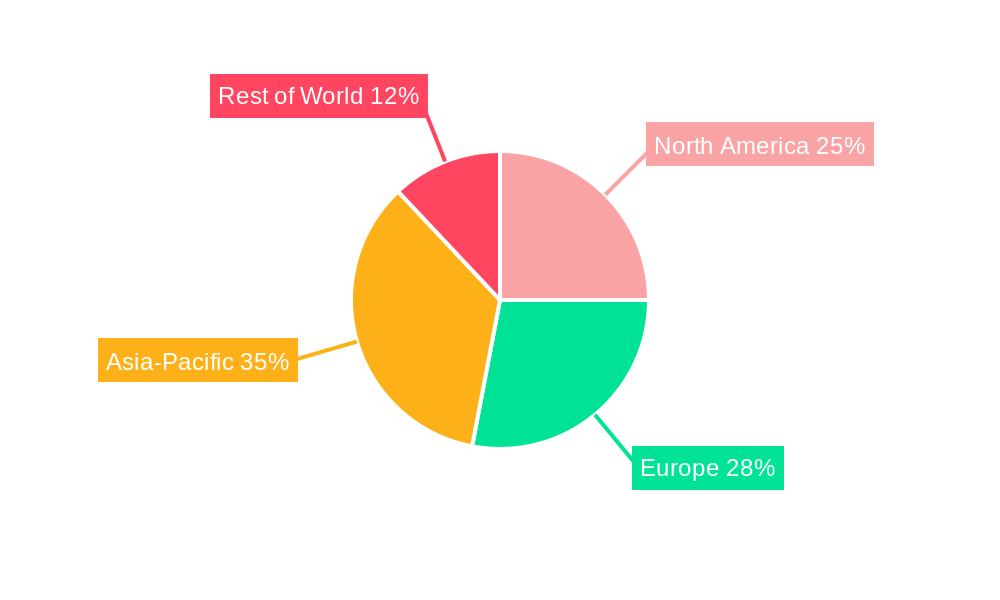
This section identifies the leading regions and segments within the household plastic products recycling market. The analysis pinpoints the dominant regions and countries based on factors such as robust recycling infrastructure, supportive government policies, and high consumer awareness.
- Key Drivers in Dominant Regions:
- Strong Government Regulations and Incentives
- Well-Developed Recycling Infrastructure
- High Consumer Demand for Recycled Products
- Technological Advancements in Recycling Processes
The report provides a detailed analysis of the dominance, focusing on economic policies, infrastructure development, and consumer behavior.
Household Plastic Products Recycling Product Developments
This section summarizes recent innovations in household plastic products recycling, including advancements in material recovery technologies and the development of new applications for recycled plastics. The focus is on technological trends and their market fit, highlighting the competitive advantages offered by these innovations. The shift towards more sustainable and circular economy models is driving the demand for innovative recycling solutions and creating opportunities for new players.
Report Scope & Segmentation Analysis
This report segments the household plastic products recycling market based on plastic type (PET, HDPE, PP, etc.), recycling method (mechanical, chemical), and geography (North America, Europe, Asia-Pacific, etc.). Each segment’s growth projections, market size estimates for 2025 and 2033, and competitive landscape are detailed. For instance, the mechanical recycling segment is expected to hold a significant market share in 2025, driven by its cost-effectiveness and scalability. However, the chemical recycling segment is projected to experience faster growth during the forecast period due to its potential to handle more complex plastic waste streams.
Key Drivers of Household Plastic Products Recycling Growth
Several factors are driving the growth of the household plastic products recycling market. These include:
- Stringent environmental regulations and policies globally promoting plastic waste reduction.
- Rising consumer awareness of environmental issues and preference for sustainable products.
- Technological advancements leading to improved recycling efficiency and cost-effectiveness.
- Growing demand for recycled plastics from various industries.
Challenges in the Household Plastic Products Recycling Sector
Despite significant growth potential, the household plastic products recycling sector faces considerable challenges:
- The inconsistent quality of recycled plastic materials remains a significant issue.
- Scaling up recycling infrastructure and technology requires significant investment.
- Economic viability of recycling processes remains a concern for many companies.
- The lack of harmonized standards and regulations across regions hinders progress.
Emerging Opportunities in Household Plastic Products Recycling
Despite challenges, significant opportunities exist in the market:
- Development and deployment of advanced recycling technologies, such as chemical recycling.
- Expansion of recycling infrastructure in developing economies.
- Increased demand for recycled plastics in various industries, including packaging and construction.
- Growing collaborations between government agencies and private companies.
Leading Players in the Household Plastic Products Recycling Market
- Indorama Ventures
- Far Eastern New Century
- Veolia
- MBA Polymers
- Alpek
- Plastipak Holdings
- Greentech
- SUEZ
- Biffa
- Visy
- Kingfa
- INTCO
Key Developments in Household Plastic Products Recycling Industry
- January 2023: Veolia announces a new chemical recycling facility in France.
- March 2022: Indorama Ventures invests $xx million in a new plastic recycling plant in the US.
- June 2021: New EPR regulations are implemented in the European Union, impacting household plastic recycling.
Strategic Outlook for Household Plastic Products Recycling Market
The household plastic products recycling market is poised for substantial growth over the forecast period, driven by increasing environmental concerns, supportive government policies, and technological advancements. The shift toward a circular economy and the development of innovative recycling technologies will further fuel market expansion. Significant opportunities exist for companies that can develop cost-effective and scalable recycling solutions. Continued investment in research and development, along with strategic partnerships, will be crucial for success in this rapidly evolving market.
Household Plastic Products Recycling Segmentation
-
1. Application
- 1.1. Packaging & Consumer Goods
- 1.2. Construction
- 1.3. Textile
- 1.4. Others
-
2. Type
- 2.1. PET
- 2.2. PP
- 2.3. PE
- 2.4. Others
Household Plastic Products Recycling Segmentation By Geography
-
1. North America
- 1.1. United States
- 1.2. Canada
- 1.3. Mexico
-
2. South America
- 2.1. Brazil
- 2.2. Argentina
- 2.3. Rest of South America
-
3. Europe
- 3.1. United Kingdom
- 3.2. Germany
- 3.3. France
- 3.4. Italy
- 3.5. Spain
- 3.6. Russia
- 3.7. Benelux
- 3.8. Nordics
- 3.9. Rest of Europe
-
4. Middle East & Africa
- 4.1. Turkey
- 4.2. Israel
- 4.3. GCC
- 4.4. North Africa
- 4.5. South Africa
- 4.6. Rest of Middle East & Africa
-
5. Asia Pacific
- 5.1. China
- 5.2. India
- 5.3. Japan
- 5.4. South Korea
- 5.5. ASEAN
- 5.6. Oceania
- 5.7. Rest of Asia Pacific
Household Plastic Products Recycling Regional Market Share
Geographic Coverage of Household Plastic Products Recycling
Household Plastic Products Recycling REPORT HIGHLIGHTS
| Aspects | Details |
|---|---|
| Study Period | 2020-2034 |
| Base Year | 2025 |
| Estimated Year | 2026 |
| Forecast Period | 2026-2034 |
| Historical Period | 2020-2025 |
| Growth Rate | CAGR of 5.8% from 2020-2034 |
| Segmentation |
|
Table of Contents
- 1. Introduction
- 1.1. Research Scope
- 1.2. Market Segmentation
- 1.3. Research Objective
- 1.4. Definitions and Assumptions
- 2. Executive Summary
- 2.1. Market Snapshot
- 3. Market Dynamics
- 3.1. Market Drivers
- 3.2. Market Restrains
- 3.3. Market Trends
- 3.4. Market Opportunities
- 4. Market Factor Analysis
- 4.1. Porters Five Forces
- 4.1.1. Bargaining Power of Suppliers
- 4.1.2. Bargaining Power of Buyers
- 4.1.3. Threat of New Entrants
- 4.1.4. Threat of Substitutes
- 4.1.5. Competitive Rivalry
- 4.2. PESTEL analysis
- 4.3. BCG Analysis
- 4.3.1. Stars (High Growth, High Market Share)
- 4.3.2. Cash Cows (Low Growth, High Market Share)
- 4.3.3. Question Mark (High Growth, Low Market Share)
- 4.3.4. Dogs (Low Growth, Low Market Share)
- 4.4. Ansoff Matrix Analysis
- 4.5. Supply Chain Analysis
- 4.6. Regulatory Landscape
- 4.7. Current Market Potential and Opportunity Assessment (TAM–SAM–SOM Framework)
- 4.8. RAX Analyst Note
- 4.1. Porters Five Forces
- 5. Market Analysis, Insights and Forecast 2021-2033
- 5.1. Market Analysis, Insights and Forecast - by Application
- 5.1.1. Packaging & Consumer Goods
- 5.1.2. Construction
- 5.1.3. Textile
- 5.1.4. Others
- 5.2. Market Analysis, Insights and Forecast - by Type
- 5.2.1. PET
- 5.2.2. PP
- 5.2.3. PE
- 5.2.4. Others
- 5.3. Market Analysis, Insights and Forecast - by Region
- 5.3.1. North America
- 5.3.2. South America
- 5.3.3. Europe
- 5.3.4. Middle East & Africa
- 5.3.5. Asia Pacific
- 5.1. Market Analysis, Insights and Forecast - by Application
- 6. Global Household Plastic Products Recycling Analysis, Insights and Forecast, 2021-2033
- 6.1. Market Analysis, Insights and Forecast - by Application
- 6.1.1. Packaging & Consumer Goods
- 6.1.2. Construction
- 6.1.3. Textile
- 6.1.4. Others
- 6.2. Market Analysis, Insights and Forecast - by Type
- 6.2.1. PET
- 6.2.2. PP
- 6.2.3. PE
- 6.2.4. Others
- 6.1. Market Analysis, Insights and Forecast - by Application
- 7. North America Household Plastic Products Recycling Analysis, Insights and Forecast, 2020-2032
- 7.1. Market Analysis, Insights and Forecast - by Application
- 7.1.1. Packaging & Consumer Goods
- 7.1.2. Construction
- 7.1.3. Textile
- 7.1.4. Others
- 7.2. Market Analysis, Insights and Forecast - by Type
- 7.2.1. PET
- 7.2.2. PP
- 7.2.3. PE
- 7.2.4. Others
- 7.1. Market Analysis, Insights and Forecast - by Application
- 8. South America Household Plastic Products Recycling Analysis, Insights and Forecast, 2020-2032
- 8.1. Market Analysis, Insights and Forecast - by Application
- 8.1.1. Packaging & Consumer Goods
- 8.1.2. Construction
- 8.1.3. Textile
- 8.1.4. Others
- 8.2. Market Analysis, Insights and Forecast - by Type
- 8.2.1. PET
- 8.2.2. PP
- 8.2.3. PE
- 8.2.4. Others
- 8.1. Market Analysis, Insights and Forecast - by Application
- 9. Europe Household Plastic Products Recycling Analysis, Insights and Forecast, 2020-2032
- 9.1. Market Analysis, Insights and Forecast - by Application
- 9.1.1. Packaging & Consumer Goods
- 9.1.2. Construction
- 9.1.3. Textile
- 9.1.4. Others
- 9.2. Market Analysis, Insights and Forecast - by Type
- 9.2.1. PET
- 9.2.2. PP
- 9.2.3. PE
- 9.2.4. Others
- 9.1. Market Analysis, Insights and Forecast - by Application
- 10. Middle East & Africa Household Plastic Products Recycling Analysis, Insights and Forecast, 2020-2032
- 10.1. Market Analysis, Insights and Forecast - by Application
- 10.1.1. Packaging & Consumer Goods
- 10.1.2. Construction
- 10.1.3. Textile
- 10.1.4. Others
- 10.2. Market Analysis, Insights and Forecast - by Type
- 10.2.1. PET
- 10.2.2. PP
- 10.2.3. PE
- 10.2.4. Others
- 10.1. Market Analysis, Insights and Forecast - by Application
- 11. Asia Pacific Household Plastic Products Recycling Analysis, Insights and Forecast, 2020-2032
- 11.1. Market Analysis, Insights and Forecast - by Application
- 11.1.1. Packaging & Consumer Goods
- 11.1.2. Construction
- 11.1.3. Textile
- 11.1.4. Others
- 11.2. Market Analysis, Insights and Forecast - by Type
- 11.2.1. PET
- 11.2.2. PP
- 11.2.3. PE
- 11.2.4. Others
- 11.1. Market Analysis, Insights and Forecast - by Application
- 12. Competitive Analysis
- 12.1. Company Profiles
- 12.1.1 Indorama Ventures
- 12.1.1.1. Company Overview
- 12.1.1.2. Products
- 12.1.1.3. Company Financials
- 12.1.1.4. SWOT Analysis
- 12.1.2 Far Eastern New Century
- 12.1.2.1. Company Overview
- 12.1.2.2. Products
- 12.1.2.3. Company Financials
- 12.1.2.4. SWOT Analysis
- 12.1.3 Veolia
- 12.1.3.1. Company Overview
- 12.1.3.2. Products
- 12.1.3.3. Company Financials
- 12.1.3.4. SWOT Analysis
- 12.1.4 MBA Polymers
- 12.1.4.1. Company Overview
- 12.1.4.2. Products
- 12.1.4.3. Company Financials
- 12.1.4.4. SWOT Analysis
- 12.1.5 Alpek
- 12.1.5.1. Company Overview
- 12.1.5.2. Products
- 12.1.5.3. Company Financials
- 12.1.5.4. SWOT Analysis
- 12.1.6 Plastipak Holdings
- 12.1.6.1. Company Overview
- 12.1.6.2. Products
- 12.1.6.3. Company Financials
- 12.1.6.4. SWOT Analysis
- 12.1.7 Greentech
- 12.1.7.1. Company Overview
- 12.1.7.2. Products
- 12.1.7.3. Company Financials
- 12.1.7.4. SWOT Analysis
- 12.1.8 SUEZ
- 12.1.8.1. Company Overview
- 12.1.8.2. Products
- 12.1.8.3. Company Financials
- 12.1.8.4. SWOT Analysis
- 12.1.9 Biffa
- 12.1.9.1. Company Overview
- 12.1.9.2. Products
- 12.1.9.3. Company Financials
- 12.1.9.4. SWOT Analysis
- 12.1.10 Visy
- 12.1.10.1. Company Overview
- 12.1.10.2. Products
- 12.1.10.3. Company Financials
- 12.1.10.4. SWOT Analysis
- 12.1.11 Kingfa
- 12.1.11.1. Company Overview
- 12.1.11.2. Products
- 12.1.11.3. Company Financials
- 12.1.11.4. SWOT Analysis
- 12.1.12 INTCO
- 12.1.12.1. Company Overview
- 12.1.12.2. Products
- 12.1.12.3. Company Financials
- 12.1.12.4. SWOT Analysis
- 12.1.1 Indorama Ventures
- 12.2. Market Entropy
- 12.2.1 Company's Key Areas Served
- 12.2.2 Recent Developments
- 12.3. Company Market Share Analysis 2025
- 12.3.1 Top 5 Companies Market Share Analysis
- 12.3.2 Top 3 Companies Market Share Analysis
- 12.4. List of Potential Customers
- 13. Research Methodology
List of Figures
- Figure 1: Global Household Plastic Products Recycling Revenue Breakdown (million, %) by Region 2025 & 2033
- Figure 2: Global Household Plastic Products Recycling Volume Breakdown (K, %) by Region 2025 & 2033
- Figure 3: North America Household Plastic Products Recycling Revenue (million), by Application 2025 & 2033
- Figure 4: North America Household Plastic Products Recycling Volume (K), by Application 2025 & 2033
- Figure 5: North America Household Plastic Products Recycling Revenue Share (%), by Application 2025 & 2033
- Figure 6: North America Household Plastic Products Recycling Volume Share (%), by Application 2025 & 2033
- Figure 7: North America Household Plastic Products Recycling Revenue (million), by Type 2025 & 2033
- Figure 8: North America Household Plastic Products Recycling Volume (K), by Type 2025 & 2033
- Figure 9: North America Household Plastic Products Recycling Revenue Share (%), by Type 2025 & 2033
- Figure 10: North America Household Plastic Products Recycling Volume Share (%), by Type 2025 & 2033
- Figure 11: North America Household Plastic Products Recycling Revenue (million), by Country 2025 & 2033
- Figure 12: North America Household Plastic Products Recycling Volume (K), by Country 2025 & 2033
- Figure 13: North America Household Plastic Products Recycling Revenue Share (%), by Country 2025 & 2033
- Figure 14: North America Household Plastic Products Recycling Volume Share (%), by Country 2025 & 2033
- Figure 15: South America Household Plastic Products Recycling Revenue (million), by Application 2025 & 2033
- Figure 16: South America Household Plastic Products Recycling Volume (K), by Application 2025 & 2033
- Figure 17: South America Household Plastic Products Recycling Revenue Share (%), by Application 2025 & 2033
- Figure 18: South America Household Plastic Products Recycling Volume Share (%), by Application 2025 & 2033
- Figure 19: South America Household Plastic Products Recycling Revenue (million), by Type 2025 & 2033
- Figure 20: South America Household Plastic Products Recycling Volume (K), by Type 2025 & 2033
- Figure 21: South America Household Plastic Products Recycling Revenue Share (%), by Type 2025 & 2033
- Figure 22: South America Household Plastic Products Recycling Volume Share (%), by Type 2025 & 2033
- Figure 23: South America Household Plastic Products Recycling Revenue (million), by Country 2025 & 2033
- Figure 24: South America Household Plastic Products Recycling Volume (K), by Country 2025 & 2033
- Figure 25: South America Household Plastic Products Recycling Revenue Share (%), by Country 2025 & 2033
- Figure 26: South America Household Plastic Products Recycling Volume Share (%), by Country 2025 & 2033
- Figure 27: Europe Household Plastic Products Recycling Revenue (million), by Application 2025 & 2033
- Figure 28: Europe Household Plastic Products Recycling Volume (K), by Application 2025 & 2033
- Figure 29: Europe Household Plastic Products Recycling Revenue Share (%), by Application 2025 & 2033
- Figure 30: Europe Household Plastic Products Recycling Volume Share (%), by Application 2025 & 2033
- Figure 31: Europe Household Plastic Products Recycling Revenue (million), by Type 2025 & 2033
- Figure 32: Europe Household Plastic Products Recycling Volume (K), by Type 2025 & 2033
- Figure 33: Europe Household Plastic Products Recycling Revenue Share (%), by Type 2025 & 2033
- Figure 34: Europe Household Plastic Products Recycling Volume Share (%), by Type 2025 & 2033
- Figure 35: Europe Household Plastic Products Recycling Revenue (million), by Country 2025 & 2033
- Figure 36: Europe Household Plastic Products Recycling Volume (K), by Country 2025 & 2033
- Figure 37: Europe Household Plastic Products Recycling Revenue Share (%), by Country 2025 & 2033
- Figure 38: Europe Household Plastic Products Recycling Volume Share (%), by Country 2025 & 2033
- Figure 39: Middle East & Africa Household Plastic Products Recycling Revenue (million), by Application 2025 & 2033
- Figure 40: Middle East & Africa Household Plastic Products Recycling Volume (K), by Application 2025 & 2033
- Figure 41: Middle East & Africa Household Plastic Products Recycling Revenue Share (%), by Application 2025 & 2033
- Figure 42: Middle East & Africa Household Plastic Products Recycling Volume Share (%), by Application 2025 & 2033
- Figure 43: Middle East & Africa Household Plastic Products Recycling Revenue (million), by Type 2025 & 2033
- Figure 44: Middle East & Africa Household Plastic Products Recycling Volume (K), by Type 2025 & 2033
- Figure 45: Middle East & Africa Household Plastic Products Recycling Revenue Share (%), by Type 2025 & 2033
- Figure 46: Middle East & Africa Household Plastic Products Recycling Volume Share (%), by Type 2025 & 2033
- Figure 47: Middle East & Africa Household Plastic Products Recycling Revenue (million), by Country 2025 & 2033
- Figure 48: Middle East & Africa Household Plastic Products Recycling Volume (K), by Country 2025 & 2033
- Figure 49: Middle East & Africa Household Plastic Products Recycling Revenue Share (%), by Country 2025 & 2033
- Figure 50: Middle East & Africa Household Plastic Products Recycling Volume Share (%), by Country 2025 & 2033
- Figure 51: Asia Pacific Household Plastic Products Recycling Revenue (million), by Application 2025 & 2033
- Figure 52: Asia Pacific Household Plastic Products Recycling Volume (K), by Application 2025 & 2033
- Figure 53: Asia Pacific Household Plastic Products Recycling Revenue Share (%), by Application 2025 & 2033
- Figure 54: Asia Pacific Household Plastic Products Recycling Volume Share (%), by Application 2025 & 2033
- Figure 55: Asia Pacific Household Plastic Products Recycling Revenue (million), by Type 2025 & 2033
- Figure 56: Asia Pacific Household Plastic Products Recycling Volume (K), by Type 2025 & 2033
- Figure 57: Asia Pacific Household Plastic Products Recycling Revenue Share (%), by Type 2025 & 2033
- Figure 58: Asia Pacific Household Plastic Products Recycling Volume Share (%), by Type 2025 & 2033
- Figure 59: Asia Pacific Household Plastic Products Recycling Revenue (million), by Country 2025 & 2033
- Figure 60: Asia Pacific Household Plastic Products Recycling Volume (K), by Country 2025 & 2033
- Figure 61: Asia Pacific Household Plastic Products Recycling Revenue Share (%), by Country 2025 & 2033
- Figure 62: Asia Pacific Household Plastic Products Recycling Volume Share (%), by Country 2025 & 2033
List of Tables
- Table 1: Global Household Plastic Products Recycling Revenue million Forecast, by Application 2020 & 2033
- Table 2: Global Household Plastic Products Recycling Volume K Forecast, by Application 2020 & 2033
- Table 3: Global Household Plastic Products Recycling Revenue million Forecast, by Type 2020 & 2033
- Table 4: Global Household Plastic Products Recycling Volume K Forecast, by Type 2020 & 2033
- Table 5: Global Household Plastic Products Recycling Revenue million Forecast, by Region 2020 & 2033
- Table 6: Global Household Plastic Products Recycling Volume K Forecast, by Region 2020 & 2033
- Table 7: Global Household Plastic Products Recycling Revenue million Forecast, by Application 2020 & 2033
- Table 8: Global Household Plastic Products Recycling Volume K Forecast, by Application 2020 & 2033
- Table 9: Global Household Plastic Products Recycling Revenue million Forecast, by Type 2020 & 2033
- Table 10: Global Household Plastic Products Recycling Volume K Forecast, by Type 2020 & 2033
- Table 11: Global Household Plastic Products Recycling Revenue million Forecast, by Country 2020 & 2033
- Table 12: Global Household Plastic Products Recycling Volume K Forecast, by Country 2020 & 2033
- Table 13: United States Household Plastic Products Recycling Revenue (million) Forecast, by Application 2020 & 2033
- Table 14: United States Household Plastic Products Recycling Volume (K) Forecast, by Application 2020 & 2033
- Table 15: Canada Household Plastic Products Recycling Revenue (million) Forecast, by Application 2020 & 2033
- Table 16: Canada Household Plastic Products Recycling Volume (K) Forecast, by Application 2020 & 2033
- Table 17: Mexico Household Plastic Products Recycling Revenue (million) Forecast, by Application 2020 & 2033
- Table 18: Mexico Household Plastic Products Recycling Volume (K) Forecast, by Application 2020 & 2033
- Table 19: Global Household Plastic Products Recycling Revenue million Forecast, by Application 2020 & 2033
- Table 20: Global Household Plastic Products Recycling Volume K Forecast, by Application 2020 & 2033
- Table 21: Global Household Plastic Products Recycling Revenue million Forecast, by Type 2020 & 2033
- Table 22: Global Household Plastic Products Recycling Volume K Forecast, by Type 2020 & 2033
- Table 23: Global Household Plastic Products Recycling Revenue million Forecast, by Country 2020 & 2033
- Table 24: Global Household Plastic Products Recycling Volume K Forecast, by Country 2020 & 2033
- Table 25: Brazil Household Plastic Products Recycling Revenue (million) Forecast, by Application 2020 & 2033
- Table 26: Brazil Household Plastic Products Recycling Volume (K) Forecast, by Application 2020 & 2033
- Table 27: Argentina Household Plastic Products Recycling Revenue (million) Forecast, by Application 2020 & 2033
- Table 28: Argentina Household Plastic Products Recycling Volume (K) Forecast, by Application 2020 & 2033
- Table 29: Rest of South America Household Plastic Products Recycling Revenue (million) Forecast, by Application 2020 & 2033
- Table 30: Rest of South America Household Plastic Products Recycling Volume (K) Forecast, by Application 2020 & 2033
- Table 31: Global Household Plastic Products Recycling Revenue million Forecast, by Application 2020 & 2033
- Table 32: Global Household Plastic Products Recycling Volume K Forecast, by Application 2020 & 2033
- Table 33: Global Household Plastic Products Recycling Revenue million Forecast, by Type 2020 & 2033
- Table 34: Global Household Plastic Products Recycling Volume K Forecast, by Type 2020 & 2033
- Table 35: Global Household Plastic Products Recycling Revenue million Forecast, by Country 2020 & 2033
- Table 36: Global Household Plastic Products Recycling Volume K Forecast, by Country 2020 & 2033
- Table 37: United Kingdom Household Plastic Products Recycling Revenue (million) Forecast, by Application 2020 & 2033
- Table 38: United Kingdom Household Plastic Products Recycling Volume (K) Forecast, by Application 2020 & 2033
- Table 39: Germany Household Plastic Products Recycling Revenue (million) Forecast, by Application 2020 & 2033
- Table 40: Germany Household Plastic Products Recycling Volume (K) Forecast, by Application 2020 & 2033
- Table 41: France Household Plastic Products Recycling Revenue (million) Forecast, by Application 2020 & 2033
- Table 42: France Household Plastic Products Recycling Volume (K) Forecast, by Application 2020 & 2033
- Table 43: Italy Household Plastic Products Recycling Revenue (million) Forecast, by Application 2020 & 2033
- Table 44: Italy Household Plastic Products Recycling Volume (K) Forecast, by Application 2020 & 2033
- Table 45: Spain Household Plastic Products Recycling Revenue (million) Forecast, by Application 2020 & 2033
- Table 46: Spain Household Plastic Products Recycling Volume (K) Forecast, by Application 2020 & 2033
- Table 47: Russia Household Plastic Products Recycling Revenue (million) Forecast, by Application 2020 & 2033
- Table 48: Russia Household Plastic Products Recycling Volume (K) Forecast, by Application 2020 & 2033
- Table 49: Benelux Household Plastic Products Recycling Revenue (million) Forecast, by Application 2020 & 2033
- Table 50: Benelux Household Plastic Products Recycling Volume (K) Forecast, by Application 2020 & 2033
- Table 51: Nordics Household Plastic Products Recycling Revenue (million) Forecast, by Application 2020 & 2033
- Table 52: Nordics Household Plastic Products Recycling Volume (K) Forecast, by Application 2020 & 2033
- Table 53: Rest of Europe Household Plastic Products Recycling Revenue (million) Forecast, by Application 2020 & 2033
- Table 54: Rest of Europe Household Plastic Products Recycling Volume (K) Forecast, by Application 2020 & 2033
- Table 55: Global Household Plastic Products Recycling Revenue million Forecast, by Application 2020 & 2033
- Table 56: Global Household Plastic Products Recycling Volume K Forecast, by Application 2020 & 2033
- Table 57: Global Household Plastic Products Recycling Revenue million Forecast, by Type 2020 & 2033
- Table 58: Global Household Plastic Products Recycling Volume K Forecast, by Type 2020 & 2033
- Table 59: Global Household Plastic Products Recycling Revenue million Forecast, by Country 2020 & 2033
- Table 60: Global Household Plastic Products Recycling Volume K Forecast, by Country 2020 & 2033
- Table 61: Turkey Household Plastic Products Recycling Revenue (million) Forecast, by Application 2020 & 2033
- Table 62: Turkey Household Plastic Products Recycling Volume (K) Forecast, by Application 2020 & 2033
- Table 63: Israel Household Plastic Products Recycling Revenue (million) Forecast, by Application 2020 & 2033
- Table 64: Israel Household Plastic Products Recycling Volume (K) Forecast, by Application 2020 & 2033
- Table 65: GCC Household Plastic Products Recycling Revenue (million) Forecast, by Application 2020 & 2033
- Table 66: GCC Household Plastic Products Recycling Volume (K) Forecast, by Application 2020 & 2033
- Table 67: North Africa Household Plastic Products Recycling Revenue (million) Forecast, by Application 2020 & 2033
- Table 68: North Africa Household Plastic Products Recycling Volume (K) Forecast, by Application 2020 & 2033
- Table 69: South Africa Household Plastic Products Recycling Revenue (million) Forecast, by Application 2020 & 2033
- Table 70: South Africa Household Plastic Products Recycling Volume (K) Forecast, by Application 2020 & 2033
- Table 71: Rest of Middle East & Africa Household Plastic Products Recycling Revenue (million) Forecast, by Application 2020 & 2033
- Table 72: Rest of Middle East & Africa Household Plastic Products Recycling Volume (K) Forecast, by Application 2020 & 2033
- Table 73: Global Household Plastic Products Recycling Revenue million Forecast, by Application 2020 & 2033
- Table 74: Global Household Plastic Products Recycling Volume K Forecast, by Application 2020 & 2033
- Table 75: Global Household Plastic Products Recycling Revenue million Forecast, by Type 2020 & 2033
- Table 76: Global Household Plastic Products Recycling Volume K Forecast, by Type 2020 & 2033
- Table 77: Global Household Plastic Products Recycling Revenue million Forecast, by Country 2020 & 2033
- Table 78: Global Household Plastic Products Recycling Volume K Forecast, by Country 2020 & 2033
- Table 79: China Household Plastic Products Recycling Revenue (million) Forecast, by Application 2020 & 2033
- Table 80: China Household Plastic Products Recycling Volume (K) Forecast, by Application 2020 & 2033
- Table 81: India Household Plastic Products Recycling Revenue (million) Forecast, by Application 2020 & 2033
- Table 82: India Household Plastic Products Recycling Volume (K) Forecast, by Application 2020 & 2033
- Table 83: Japan Household Plastic Products Recycling Revenue (million) Forecast, by Application 2020 & 2033
- Table 84: Japan Household Plastic Products Recycling Volume (K) Forecast, by Application 2020 & 2033
- Table 85: South Korea Household Plastic Products Recycling Revenue (million) Forecast, by Application 2020 & 2033
- Table 86: South Korea Household Plastic Products Recycling Volume (K) Forecast, by Application 2020 & 2033
- Table 87: ASEAN Household Plastic Products Recycling Revenue (million) Forecast, by Application 2020 & 2033
- Table 88: ASEAN Household Plastic Products Recycling Volume (K) Forecast, by Application 2020 & 2033
- Table 89: Oceania Household Plastic Products Recycling Revenue (million) Forecast, by Application 2020 & 2033
- Table 90: Oceania Household Plastic Products Recycling Volume (K) Forecast, by Application 2020 & 2033
- Table 91: Rest of Asia Pacific Household Plastic Products Recycling Revenue (million) Forecast, by Application 2020 & 2033
- Table 92: Rest of Asia Pacific Household Plastic Products Recycling Volume (K) Forecast, by Application 2020 & 2033
Frequently Asked Questions
1. What is the projected Compound Annual Growth Rate (CAGR) of the Household Plastic Products Recycling?
The projected CAGR is approximately 5.8%.
2. Which companies are prominent players in the Household Plastic Products Recycling?
Key companies in the market include Indorama Ventures, Far Eastern New Century, Veolia, MBA Polymers, Alpek, Plastipak Holdings, Greentech, SUEZ, Biffa, Visy, Kingfa, INTCO.
3. What are the main segments of the Household Plastic Products Recycling?
The market segments include Application, Type.
4. Can you provide details about the market size?
The market size is estimated to be USD 1570 million as of 2022.
5. What are some drivers contributing to market growth?
N/A
6. What are the notable trends driving market growth?
N/A
7. Are there any restraints impacting market growth?
N/A
8. Can you provide examples of recent developments in the market?
N/A
9. What pricing options are available for accessing the report?
Pricing options include single-user, multi-user, and enterprise licenses priced at USD 3950.00, USD 5925.00, and USD 7900.00 respectively.
10. Is the market size provided in terms of value or volume?
The market size is provided in terms of value, measured in million and volume, measured in K.
11. Are there any specific market keywords associated with the report?
Yes, the market keyword associated with the report is "Household Plastic Products Recycling," which aids in identifying and referencing the specific market segment covered.
12. How do I determine which pricing option suits my needs best?
The pricing options vary based on user requirements and access needs. Individual users may opt for single-user licenses, while businesses requiring broader access may choose multi-user or enterprise licenses for cost-effective access to the report.
13. Are there any additional resources or data provided in the Household Plastic Products Recycling report?
While the report offers comprehensive insights, it's advisable to review the specific contents or supplementary materials provided to ascertain if additional resources or data are available.
14. How can I stay updated on further developments or reports in the Household Plastic Products Recycling?
To stay informed about further developments, trends, and reports in the Household Plastic Products Recycling, consider subscribing to industry newsletters, following relevant companies and organizations, or regularly checking reputable industry news sources and publications.
Methodology
Step 1 - Identification of Relevant Samples Size from Population Database


Step 2 - Approaches for Defining Global Market Size (Value, Volume* & Price*)

Note*: In applicable scenarios
Step 3 - Data Sources
Primary Research
- Web Analytics
- Survey Reports
- Research Institute
- Latest Research Reports
- Opinion Leaders
Secondary Research
- Annual Reports
- White Paper
- Latest Press Release
- Industry Association
- Paid Database
- Investor Presentations

Step 4 - Data Triangulation
Involves using different sources of information in order to increase the validity of a study
These sources are likely to be stakeholders in a program - participants, other researchers, program staff, other community members, and so on.
Then we put all data in single framework & apply various statistical tools to find out the dynamic on the market.
During the analysis stage, feedback from the stakeholder groups would be compared to determine areas of agreement as well as areas of divergence