
Key Insights
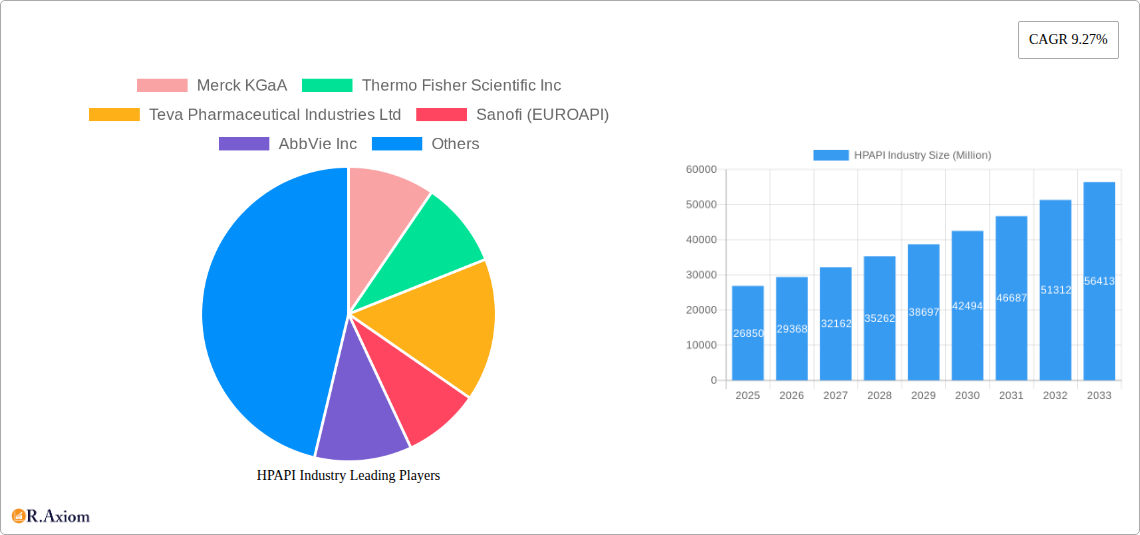
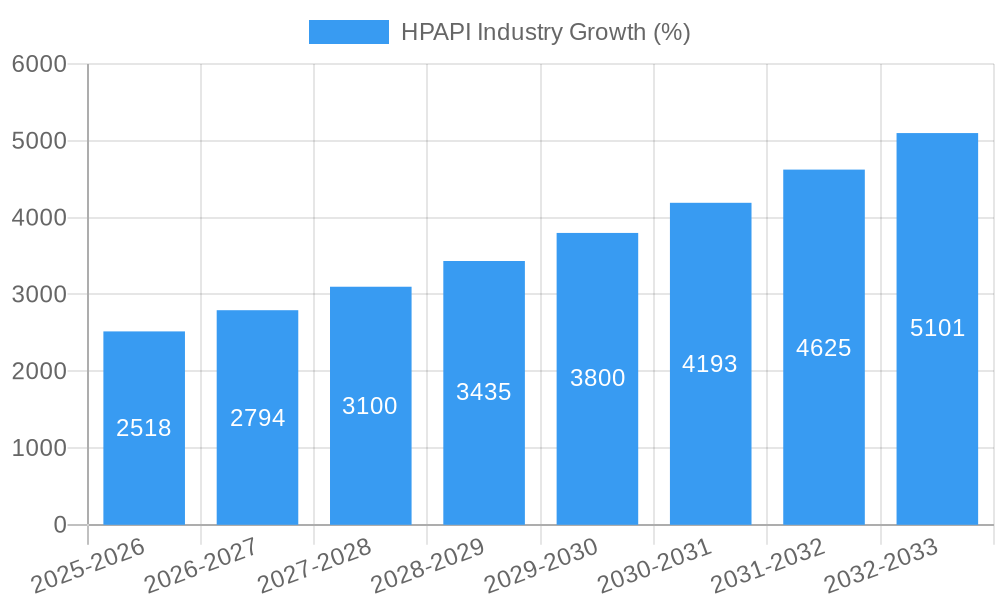
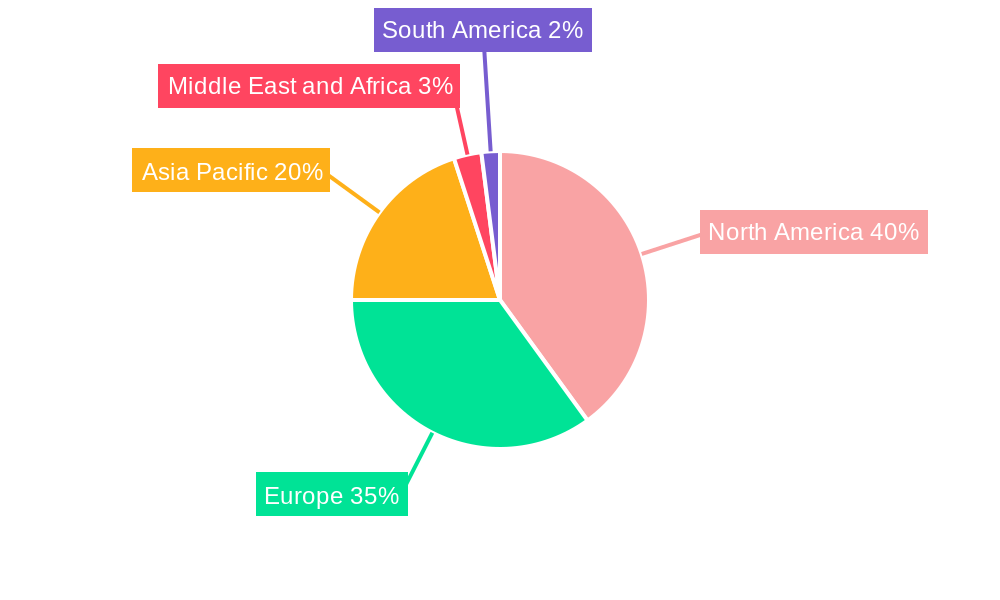
The High-Potency Active Pharmaceutical Ingredients (HPAPI) market is experiencing robust growth, projected to reach \$26.85 billion in 2025 and exhibiting a Compound Annual Growth Rate (CAGR) of 9.27% from 2025 to 2033. This expansion is fueled by several key drivers. The increasing prevalence of chronic diseases like cancer and hormonal imbalances necessitates the development of innovative and potent therapies, significantly boosting demand for HPAPIs used in oncology and hormone-related treatments. Furthermore, advancements in drug delivery systems and the rising adoption of personalized medicine are contributing to market growth. The segment of innovative HPAPIs is expected to outpace the generic segment due to continuous research and development efforts resulting in novel and more effective drugs. Geographically, North America and Europe currently hold significant market shares, driven by robust healthcare infrastructure and a high concentration of pharmaceutical companies. However, the Asia-Pacific region is expected to witness the fastest growth, fueled by increasing healthcare expenditure and a burgeoning pharmaceutical industry in countries like China and India. The market is segmented by manufacturer type (captive and merchant), product type (innovative and generic), application (oncology, hormonal imbalance, glaucoma, and others), and synthesis method (synthetic and biotech). While regulatory hurdles and the inherent complexities of handling HPAPIs present challenges, the overall market outlook remains highly optimistic, driven by continuous innovation and the unmet medical needs in various therapeutic areas.
The competitive landscape is characterized by a mix of large multinational pharmaceutical companies like Merck KGaA, Thermo Fisher Scientific, and Pfizer, alongside specialized contract manufacturers like Corden Pharma International and SK Biotek. These companies are actively investing in research and development, capacity expansion, and strategic partnerships to maintain their market positions. The increasing focus on outsourcing HPAPI manufacturing is creating opportunities for contract manufacturers, allowing them to cater to the growing needs of pharmaceutical companies. The future growth of the HPAPI market will largely depend on continued advancements in drug discovery and development, increasing investments in manufacturing capabilities, and the successful navigation of regulatory complexities associated with handling highly potent compounds. Successful market players will need to focus on efficiency, safety, and regulatory compliance.
High-Potency Active Pharmaceutical Ingredients (HPAPI) Industry Report: 2019-2033
This comprehensive report provides an in-depth analysis of the High-Potency Active Pharmaceutical Ingredients (HPAPI) industry, covering market size, growth drivers, challenges, and future opportunities. With a study period spanning 2019-2033, a base year of 2025, and a forecast period of 2025-2033, this report offers invaluable insights for industry stakeholders, investors, and strategic decision-makers. The report leverages extensive primary and secondary research to deliver actionable intelligence, projecting a market valued at xx Million by 2033.
HPAPI Industry Market Concentration & Innovation
The HPAPI market exhibits a moderately concentrated landscape, with key players such as Merck KGaA, Thermo Fisher Scientific Inc, Teva Pharmaceutical Industries Ltd, Sanofi (EUROAPI), AbbVie Inc, and Pfizer Inc holding significant market share. While precise market share figures vary across segments, these companies collectively account for an estimated xx% of the global market in 2025. Innovation is driven by the increasing demand for novel therapies, particularly in oncology, leading to significant R&D investments. The regulatory landscape, governed by stringent guidelines from agencies like the FDA and EMA, significantly influences manufacturing practices and product approvals. Product substitution is limited due to the specialized nature of HPAPIs, with focus shifting towards enhancing existing products rather than replacement. End-user trends reflect a growing preference for personalized medicine, fueling demand for highly potent, targeted therapies. M&A activity is prevalent, with deal values exceeding xx Million in recent years, reflecting consolidation and expansion strategies among key players. Notable transactions include (examples would be listed here, but data isn't provided to populate with real examples). This indicates a strategic shift towards building integrated HPAPI capabilities.
HPAPI Industry Industry Trends & Insights
The HPAPI market is experiencing robust growth, driven by several key factors. The rising prevalence of chronic diseases, particularly cancer and hormonal imbalances, is a major driver, creating significant demand for advanced therapies. Technological advancements, such as continuous flow manufacturing and advanced analytical techniques, are enhancing production efficiency and improving product quality. Consumer preferences are shifting towards targeted therapies with improved efficacy and reduced side effects, bolstering demand for HPAPIs. Competitive dynamics are intense, with major players investing heavily in R&D to develop novel products and expand their manufacturing capacity. Market growth is projected to maintain a Compound Annual Growth Rate (CAGR) of xx% during the forecast period (2025-2033), with market penetration anticipated to increase to xx% by 2033. The rise of contract manufacturing organizations (CMOs) is also changing the industry landscape, offering increased flexibility and reduced capital expenditure for pharmaceutical companies.
Dominant Markets & Segments in HPAPI Industry
Leading Region/Country: North America currently dominates the HPAPI market, driven by robust pharmaceutical R&D investments, stringent regulatory frameworks, and a large patient population. Europe follows closely, exhibiting strong growth due to increasing demand for innovative therapies and government support for pharmaceutical research.
Manufacturer: Merchant HPAPI manufacturers currently hold a larger market share compared to captive manufacturers, catering to the needs of a diverse customer base. This segment is expected to experience significant growth due to increasing outsourcing trends.
Product Type: Innovative HPAPIs are commanding a premium price point, driven by their use in novel therapies. However, the generic HPAPI segment is anticipated to witness substantial growth, fueled by increasing demand for cost-effective treatments.
Application: Oncology holds the largest market share within HPAPI applications, owing to the growing prevalence of cancer and the development of targeted cancer therapies. Hormonal imbalance and glaucoma applications also contribute significantly.
Synthesis: Synthetic HPAPIs represent the larger segment, although biotech HPAPIs are rapidly gaining traction owing to their potential for targeted drug delivery. Key drivers for these segments include advanced technologies and growing investments in biopharmaceutical manufacturing.
Key Drivers (Bullet Points):
- Favorable regulatory environment
- Strong R&D investments
- Increasing healthcare expenditure
- Growing prevalence of chronic diseases
The dominance analysis indicates strong correlation between high R&D expenditure, advanced healthcare infrastructure and favourable regulatory environments in leading regions, directly contributing to their market leadership.
HPAPI Industry Product Developments
Recent product developments are characterized by an emphasis on improving potency, enhancing efficacy, and minimizing side effects. This involves the use of novel synthetic routes, advanced formulation techniques, and targeted drug delivery systems. Key technological trends include continuous manufacturing, process analytical technology (PAT), and single-use technologies, aimed at increasing efficiency, reducing costs, and improving safety. This focus on innovation is driving market growth and creating new opportunities for market entry.
Report Scope & Segmentation Analysis
This report segments the HPAPI market across several key parameters: Manufacturer (Captive & Merchant), Product Type (Innovative & Generic), Application (Oncology, Hormonal Imbalance, Glaucoma, Other), and Synthesis (Synthetic & Biotech). Each segment's growth projections, market size, and competitive dynamics are meticulously analyzed, offering a granular understanding of the market structure. For instance, the oncology application segment is projected to grow at a CAGR of xx% from 2025 to 2033, while the merchant manufacturer segment is expected to dominate the market due to increasing outsourcing. The report provides detailed analysis of the competitive landscape within each segment, identifying key players and their market strategies.
Key Drivers of HPAPI Industry Growth
Several factors are driving the growth of the HPAPI industry. These include the rising prevalence of chronic diseases necessitating potent therapies, substantial R&D investment in innovative drug development, technological advancements enhancing manufacturing efficiency, increasing healthcare expenditure, and supportive regulatory frameworks that encourage innovation. These factors create an ideal environment for sustainable market expansion.
Challenges in the HPAPI Industry Sector
The HPAPI industry faces challenges such as stringent regulatory requirements increasing development costs, complex supply chain management due to the stringent quality and safety requirements, and intense competition from established and emerging players. These factors collectively impact production costs and profitability. For example, regulatory hurdles can delay product approvals, while supply chain disruptions can lead to production delays and increased costs.
Emerging Opportunities in HPAPI Industry
Emerging opportunities lie in the development of novel HPAPIs for unmet medical needs, particularly in personalized medicine and targeted therapies. Advancements in drug delivery systems and technological breakthroughs in manufacturing processes offer further avenues for growth. Expanding into emerging markets with high disease prevalence and growing healthcare infrastructure presents additional market opportunities.
Leading Players in the HPAPI Industry Market
- Merck KGaA
- Thermo Fisher Scientific Inc
- Teva Pharmaceutical Industries Ltd
- Sanofi (EUROAPI)
- AbbVie Inc
- Corden Pharma International
- Viatris Inc
- Sun Pharmaceutical Industries Ltd
- SK Biotek
- Pfizer Inc
Key Developments in HPAPI Industry Industry
- January 2023: Sai Life Sciences completed a new HPAPI manufacturing facility, enhancing its capabilities and expediting NCE development. This expansion significantly strengthens their position in the market.
- February 2023: Piramal Pharma Solutions inaugurated a new API and HPAPI manufacturing plant in the US, increasing production capacity and enhancing their competitive standing in the North American market.
Strategic Outlook for HPAPI Industry Market
The HPAPI industry is poised for continued growth, fueled by technological advancements, increasing demand for targeted therapies, and expansion into emerging markets. Strategic investments in R&D, capacity expansion, and partnerships will be crucial for companies to capitalize on the significant market potential. The focus on improving manufacturing efficiency, reducing costs, and enhancing product safety will be vital for maintaining competitiveness. The long-term outlook is positive, with sustained growth projected across various segments.
HPAPI Industry Segmentation
-
1. Poduct Type
- 1.1. Innovati
- 1.2. Generic
-
2. Application
- 2.1. Oncology
- 2.2. Hormonal Imbalance
- 2.3. Glaucoma
- 2.4. Other Applications
-
3. Synthesis
- 3.1. Syntheti
- 3.2. Biotech
-
4. Manufacturer
- 4.1. Captive HPAPI Manufacturers
- 4.2. Merchant HPAPI Manufacturers
HPAPI Industry Segmentation By Geography
-
1. North America
- 1.1. United States
- 1.2. Canada
- 1.3. Mexico
-
2. Europe
- 2.1. Germany
- 2.2. United Kingdom
- 2.3. France
- 2.4. Italy
- 2.5. Spain
- 2.6. Rest of Europe
-
3. Asia Pacific
- 3.1. China
- 3.2. Japan
- 3.3. India
- 3.4. Australia
- 3.5. South Korea
- 3.6. Rest of Asia Pacific
-
4. Middle East and Africa
- 4.1. GCC
- 4.2. South Africa
- 4.3. Rest of Middle East and Africa
-
5. South America
- 5.1. Brazil
- 5.2. Argentina
- 5.3. Rest of South America
HPAPI Industry REPORT HIGHLIGHTS
| Aspects | Details |
|---|---|
| Study Period | 2019-2033 |
| Base Year | 2024 |
| Estimated Year | 2025 |
| Forecast Period | 2025-2033 |
| Historical Period | 2019-2024 |
| Growth Rate | CAGR of 9.27% from 2019-2033 |
| Segmentation |
|
Table of Contents
- 1. Introduction
- 1.1. Research Scope
- 1.2. Market Segmentation
- 1.3. Research Methodology
- 1.4. Definitions and Assumptions
- 2. Executive Summary
- 2.1. Introduction
- 3. Market Dynamics
- 3.1. Introduction
- 3.2. Market Drivers
- 3.2.1. Increasing Demand for Pharmaceutical Drugs; Increasing Focus on Precision Medicine and High-potency APIs; Technological Advancements in High-potency API Manufacturing
- 3.3. Market Restrains
- 3.3.1. Huge Capital Investment; Ever Changing Industry Standards and Guidelines
- 3.4. Market Trends
- 3.4.1. Generic High-potency Active Pharmaceutical Ingredients Segment is Expected to Record Significant Growth
- 4. Market Factor Analysis
- 4.1. Porters Five Forces
- 4.2. Supply/Value Chain
- 4.3. PESTEL analysis
- 4.4. Market Entropy
- 4.5. Patent/Trademark Analysis
- 5. Global HPAPI Industry Analysis, Insights and Forecast, 2019-2031
- 5.1. Market Analysis, Insights and Forecast - by Poduct Type
- 5.1.1. Innovati
- 5.1.2. Generic
- 5.2. Market Analysis, Insights and Forecast - by Application
- 5.2.1. Oncology
- 5.2.2. Hormonal Imbalance
- 5.2.3. Glaucoma
- 5.2.4. Other Applications
- 5.3. Market Analysis, Insights and Forecast - by Synthesis
- 5.3.1. Syntheti
- 5.3.2. Biotech
- 5.4. Market Analysis, Insights and Forecast - by Manufacturer
- 5.4.1. Captive HPAPI Manufacturers
- 5.4.2. Merchant HPAPI Manufacturers
- 5.5. Market Analysis, Insights and Forecast - by Region
- 5.5.1. North America
- 5.5.2. Europe
- 5.5.3. Asia Pacific
- 5.5.4. Middle East and Africa
- 5.5.5. South America
- 5.1. Market Analysis, Insights and Forecast - by Poduct Type
- 6. North America HPAPI Industry Analysis, Insights and Forecast, 2019-2031
- 6.1. Market Analysis, Insights and Forecast - by Poduct Type
- 6.1.1. Innovati
- 6.1.2. Generic
- 6.2. Market Analysis, Insights and Forecast - by Application
- 6.2.1. Oncology
- 6.2.2. Hormonal Imbalance
- 6.2.3. Glaucoma
- 6.2.4. Other Applications
- 6.3. Market Analysis, Insights and Forecast - by Synthesis
- 6.3.1. Syntheti
- 6.3.2. Biotech
- 6.4. Market Analysis, Insights and Forecast - by Manufacturer
- 6.4.1. Captive HPAPI Manufacturers
- 6.4.2. Merchant HPAPI Manufacturers
- 6.1. Market Analysis, Insights and Forecast - by Poduct Type
- 7. Europe HPAPI Industry Analysis, Insights and Forecast, 2019-2031
- 7.1. Market Analysis, Insights and Forecast - by Poduct Type
- 7.1.1. Innovati
- 7.1.2. Generic
- 7.2. Market Analysis, Insights and Forecast - by Application
- 7.2.1. Oncology
- 7.2.2. Hormonal Imbalance
- 7.2.3. Glaucoma
- 7.2.4. Other Applications
- 7.3. Market Analysis, Insights and Forecast - by Synthesis
- 7.3.1. Syntheti
- 7.3.2. Biotech
- 7.4. Market Analysis, Insights and Forecast - by Manufacturer
- 7.4.1. Captive HPAPI Manufacturers
- 7.4.2. Merchant HPAPI Manufacturers
- 7.1. Market Analysis, Insights and Forecast - by Poduct Type
- 8. Asia Pacific HPAPI Industry Analysis, Insights and Forecast, 2019-2031
- 8.1. Market Analysis, Insights and Forecast - by Poduct Type
- 8.1.1. Innovati
- 8.1.2. Generic
- 8.2. Market Analysis, Insights and Forecast - by Application
- 8.2.1. Oncology
- 8.2.2. Hormonal Imbalance
- 8.2.3. Glaucoma
- 8.2.4. Other Applications
- 8.3. Market Analysis, Insights and Forecast - by Synthesis
- 8.3.1. Syntheti
- 8.3.2. Biotech
- 8.4. Market Analysis, Insights and Forecast - by Manufacturer
- 8.4.1. Captive HPAPI Manufacturers
- 8.4.2. Merchant HPAPI Manufacturers
- 8.1. Market Analysis, Insights and Forecast - by Poduct Type
- 9. Middle East and Africa HPAPI Industry Analysis, Insights and Forecast, 2019-2031
- 9.1. Market Analysis, Insights and Forecast - by Poduct Type
- 9.1.1. Innovati
- 9.1.2. Generic
- 9.2. Market Analysis, Insights and Forecast - by Application
- 9.2.1. Oncology
- 9.2.2. Hormonal Imbalance
- 9.2.3. Glaucoma
- 9.2.4. Other Applications
- 9.3. Market Analysis, Insights and Forecast - by Synthesis
- 9.3.1. Syntheti
- 9.3.2. Biotech
- 9.4. Market Analysis, Insights and Forecast - by Manufacturer
- 9.4.1. Captive HPAPI Manufacturers
- 9.4.2. Merchant HPAPI Manufacturers
- 9.1. Market Analysis, Insights and Forecast - by Poduct Type
- 10. South America HPAPI Industry Analysis, Insights and Forecast, 2019-2031
- 10.1. Market Analysis, Insights and Forecast - by Poduct Type
- 10.1.1. Innovati
- 10.1.2. Generic
- 10.2. Market Analysis, Insights and Forecast - by Application
- 10.2.1. Oncology
- 10.2.2. Hormonal Imbalance
- 10.2.3. Glaucoma
- 10.2.4. Other Applications
- 10.3. Market Analysis, Insights and Forecast - by Synthesis
- 10.3.1. Syntheti
- 10.3.2. Biotech
- 10.4. Market Analysis, Insights and Forecast - by Manufacturer
- 10.4.1. Captive HPAPI Manufacturers
- 10.4.2. Merchant HPAPI Manufacturers
- 10.1. Market Analysis, Insights and Forecast - by Poduct Type
- 11. North America HPAPI Industry Analysis, Insights and Forecast, 2019-2031
- 11.1. Market Analysis, Insights and Forecast - By Country/Sub-region
- 11.1.1 United States
- 11.1.2 Canada
- 11.1.3 Mexico
- 12. Europe HPAPI Industry Analysis, Insights and Forecast, 2019-2031
- 12.1. Market Analysis, Insights and Forecast - By Country/Sub-region
- 12.1.1 Germany
- 12.1.2 United Kingdom
- 12.1.3 France
- 12.1.4 Italy
- 12.1.5 Spain
- 12.1.6 Rest of Europe
- 13. Asia Pacific HPAPI Industry Analysis, Insights and Forecast, 2019-2031
- 13.1. Market Analysis, Insights and Forecast - By Country/Sub-region
- 13.1.1 China
- 13.1.2 Japan
- 13.1.3 India
- 13.1.4 Australia
- 13.1.5 South Korea
- 13.1.6 Rest of Asia Pacific
- 14. Middle East and Africa HPAPI Industry Analysis, Insights and Forecast, 2019-2031
- 14.1. Market Analysis, Insights and Forecast - By Country/Sub-region
- 14.1.1 GCC
- 14.1.2 South Africa
- 14.1.3 Rest of Middle East and Africa
- 15. South America HPAPI Industry Analysis, Insights and Forecast, 2019-2031
- 15.1. Market Analysis, Insights and Forecast - By Country/Sub-region
- 15.1.1 Brazil
- 15.1.2 Argentina
- 15.1.3 Rest of South America
- 16. Competitive Analysis
- 16.1. Global Market Share Analysis 2024
- 16.2. Company Profiles
- 16.2.1 Merck KGaA
- 16.2.1.1. Overview
- 16.2.1.2. Products
- 16.2.1.3. SWOT Analysis
- 16.2.1.4. Recent Developments
- 16.2.1.5. Financials (Based on Availability)
- 16.2.2 Thermo Fisher Scientific Inc
- 16.2.2.1. Overview
- 16.2.2.2. Products
- 16.2.2.3. SWOT Analysis
- 16.2.2.4. Recent Developments
- 16.2.2.5. Financials (Based on Availability)
- 16.2.3 Teva Pharmaceutical Industries Ltd
- 16.2.3.1. Overview
- 16.2.3.2. Products
- 16.2.3.3. SWOT Analysis
- 16.2.3.4. Recent Developments
- 16.2.3.5. Financials (Based on Availability)
- 16.2.4 Sanofi (EUROAPI)
- 16.2.4.1. Overview
- 16.2.4.2. Products
- 16.2.4.3. SWOT Analysis
- 16.2.4.4. Recent Developments
- 16.2.4.5. Financials (Based on Availability)
- 16.2.5 AbbVie Inc
- 16.2.5.1. Overview
- 16.2.5.2. Products
- 16.2.5.3. SWOT Analysis
- 16.2.5.4. Recent Developments
- 16.2.5.5. Financials (Based on Availability)
- 16.2.6 Corden Pharma International
- 16.2.6.1. Overview
- 16.2.6.2. Products
- 16.2.6.3. SWOT Analysis
- 16.2.6.4. Recent Developments
- 16.2.6.5. Financials (Based on Availability)
- 16.2.7 Viatris Inc
- 16.2.7.1. Overview
- 16.2.7.2. Products
- 16.2.7.3. SWOT Analysis
- 16.2.7.4. Recent Developments
- 16.2.7.5. Financials (Based on Availability)
- 16.2.8 Sun Pharmaceutical Industries Ltd
- 16.2.8.1. Overview
- 16.2.8.2. Products
- 16.2.8.3. SWOT Analysis
- 16.2.8.4. Recent Developments
- 16.2.8.5. Financials (Based on Availability)
- 16.2.9 SK Biotek
- 16.2.9.1. Overview
- 16.2.9.2. Products
- 16.2.9.3. SWOT Analysis
- 16.2.9.4. Recent Developments
- 16.2.9.5. Financials (Based on Availability)
- 16.2.10 Pfizer Inc
- 16.2.10.1. Overview
- 16.2.10.2. Products
- 16.2.10.3. SWOT Analysis
- 16.2.10.4. Recent Developments
- 16.2.10.5. Financials (Based on Availability)
- 16.2.1 Merck KGaA
List of Figures
- Figure 1: Global HPAPI Industry Revenue Breakdown (Million, %) by Region 2024 & 2032
- Figure 2: Global HPAPI Industry Volume Breakdown (K Unit, %) by Region 2024 & 2032
- Figure 3: North America HPAPI Industry Revenue (Million), by Country 2024 & 2032
- Figure 4: North America HPAPI Industry Volume (K Unit), by Country 2024 & 2032
- Figure 5: North America HPAPI Industry Revenue Share (%), by Country 2024 & 2032
- Figure 6: North America HPAPI Industry Volume Share (%), by Country 2024 & 2032
- Figure 7: Europe HPAPI Industry Revenue (Million), by Country 2024 & 2032
- Figure 8: Europe HPAPI Industry Volume (K Unit), by Country 2024 & 2032
- Figure 9: Europe HPAPI Industry Revenue Share (%), by Country 2024 & 2032
- Figure 10: Europe HPAPI Industry Volume Share (%), by Country 2024 & 2032
- Figure 11: Asia Pacific HPAPI Industry Revenue (Million), by Country 2024 & 2032
- Figure 12: Asia Pacific HPAPI Industry Volume (K Unit), by Country 2024 & 2032
- Figure 13: Asia Pacific HPAPI Industry Revenue Share (%), by Country 2024 & 2032
- Figure 14: Asia Pacific HPAPI Industry Volume Share (%), by Country 2024 & 2032
- Figure 15: Middle East and Africa HPAPI Industry Revenue (Million), by Country 2024 & 2032
- Figure 16: Middle East and Africa HPAPI Industry Volume (K Unit), by Country 2024 & 2032
- Figure 17: Middle East and Africa HPAPI Industry Revenue Share (%), by Country 2024 & 2032
- Figure 18: Middle East and Africa HPAPI Industry Volume Share (%), by Country 2024 & 2032
- Figure 19: South America HPAPI Industry Revenue (Million), by Country 2024 & 2032
- Figure 20: South America HPAPI Industry Volume (K Unit), by Country 2024 & 2032
- Figure 21: South America HPAPI Industry Revenue Share (%), by Country 2024 & 2032
- Figure 22: South America HPAPI Industry Volume Share (%), by Country 2024 & 2032
- Figure 23: North America HPAPI Industry Revenue (Million), by Poduct Type 2024 & 2032
- Figure 24: North America HPAPI Industry Volume (K Unit), by Poduct Type 2024 & 2032
- Figure 25: North America HPAPI Industry Revenue Share (%), by Poduct Type 2024 & 2032
- Figure 26: North America HPAPI Industry Volume Share (%), by Poduct Type 2024 & 2032
- Figure 27: North America HPAPI Industry Revenue (Million), by Application 2024 & 2032
- Figure 28: North America HPAPI Industry Volume (K Unit), by Application 2024 & 2032
- Figure 29: North America HPAPI Industry Revenue Share (%), by Application 2024 & 2032
- Figure 30: North America HPAPI Industry Volume Share (%), by Application 2024 & 2032
- Figure 31: North America HPAPI Industry Revenue (Million), by Synthesis 2024 & 2032
- Figure 32: North America HPAPI Industry Volume (K Unit), by Synthesis 2024 & 2032
- Figure 33: North America HPAPI Industry Revenue Share (%), by Synthesis 2024 & 2032
- Figure 34: North America HPAPI Industry Volume Share (%), by Synthesis 2024 & 2032
- Figure 35: North America HPAPI Industry Revenue (Million), by Manufacturer 2024 & 2032
- Figure 36: North America HPAPI Industry Volume (K Unit), by Manufacturer 2024 & 2032
- Figure 37: North America HPAPI Industry Revenue Share (%), by Manufacturer 2024 & 2032
- Figure 38: North America HPAPI Industry Volume Share (%), by Manufacturer 2024 & 2032
- Figure 39: North America HPAPI Industry Revenue (Million), by Country 2024 & 2032
- Figure 40: North America HPAPI Industry Volume (K Unit), by Country 2024 & 2032
- Figure 41: North America HPAPI Industry Revenue Share (%), by Country 2024 & 2032
- Figure 42: North America HPAPI Industry Volume Share (%), by Country 2024 & 2032
- Figure 43: Europe HPAPI Industry Revenue (Million), by Poduct Type 2024 & 2032
- Figure 44: Europe HPAPI Industry Volume (K Unit), by Poduct Type 2024 & 2032
- Figure 45: Europe HPAPI Industry Revenue Share (%), by Poduct Type 2024 & 2032
- Figure 46: Europe HPAPI Industry Volume Share (%), by Poduct Type 2024 & 2032
- Figure 47: Europe HPAPI Industry Revenue (Million), by Application 2024 & 2032
- Figure 48: Europe HPAPI Industry Volume (K Unit), by Application 2024 & 2032
- Figure 49: Europe HPAPI Industry Revenue Share (%), by Application 2024 & 2032
- Figure 50: Europe HPAPI Industry Volume Share (%), by Application 2024 & 2032
- Figure 51: Europe HPAPI Industry Revenue (Million), by Synthesis 2024 & 2032
- Figure 52: Europe HPAPI Industry Volume (K Unit), by Synthesis 2024 & 2032
- Figure 53: Europe HPAPI Industry Revenue Share (%), by Synthesis 2024 & 2032
- Figure 54: Europe HPAPI Industry Volume Share (%), by Synthesis 2024 & 2032
- Figure 55: Europe HPAPI Industry Revenue (Million), by Manufacturer 2024 & 2032
- Figure 56: Europe HPAPI Industry Volume (K Unit), by Manufacturer 2024 & 2032
- Figure 57: Europe HPAPI Industry Revenue Share (%), by Manufacturer 2024 & 2032
- Figure 58: Europe HPAPI Industry Volume Share (%), by Manufacturer 2024 & 2032
- Figure 59: Europe HPAPI Industry Revenue (Million), by Country 2024 & 2032
- Figure 60: Europe HPAPI Industry Volume (K Unit), by Country 2024 & 2032
- Figure 61: Europe HPAPI Industry Revenue Share (%), by Country 2024 & 2032
- Figure 62: Europe HPAPI Industry Volume Share (%), by Country 2024 & 2032
- Figure 63: Asia Pacific HPAPI Industry Revenue (Million), by Poduct Type 2024 & 2032
- Figure 64: Asia Pacific HPAPI Industry Volume (K Unit), by Poduct Type 2024 & 2032
- Figure 65: Asia Pacific HPAPI Industry Revenue Share (%), by Poduct Type 2024 & 2032
- Figure 66: Asia Pacific HPAPI Industry Volume Share (%), by Poduct Type 2024 & 2032
- Figure 67: Asia Pacific HPAPI Industry Revenue (Million), by Application 2024 & 2032
- Figure 68: Asia Pacific HPAPI Industry Volume (K Unit), by Application 2024 & 2032
- Figure 69: Asia Pacific HPAPI Industry Revenue Share (%), by Application 2024 & 2032
- Figure 70: Asia Pacific HPAPI Industry Volume Share (%), by Application 2024 & 2032
- Figure 71: Asia Pacific HPAPI Industry Revenue (Million), by Synthesis 2024 & 2032
- Figure 72: Asia Pacific HPAPI Industry Volume (K Unit), by Synthesis 2024 & 2032
- Figure 73: Asia Pacific HPAPI Industry Revenue Share (%), by Synthesis 2024 & 2032
- Figure 74: Asia Pacific HPAPI Industry Volume Share (%), by Synthesis 2024 & 2032
- Figure 75: Asia Pacific HPAPI Industry Revenue (Million), by Manufacturer 2024 & 2032
- Figure 76: Asia Pacific HPAPI Industry Volume (K Unit), by Manufacturer 2024 & 2032
- Figure 77: Asia Pacific HPAPI Industry Revenue Share (%), by Manufacturer 2024 & 2032
- Figure 78: Asia Pacific HPAPI Industry Volume Share (%), by Manufacturer 2024 & 2032
- Figure 79: Asia Pacific HPAPI Industry Revenue (Million), by Country 2024 & 2032
- Figure 80: Asia Pacific HPAPI Industry Volume (K Unit), by Country 2024 & 2032
- Figure 81: Asia Pacific HPAPI Industry Revenue Share (%), by Country 2024 & 2032
- Figure 82: Asia Pacific HPAPI Industry Volume Share (%), by Country 2024 & 2032
- Figure 83: Middle East and Africa HPAPI Industry Revenue (Million), by Poduct Type 2024 & 2032
- Figure 84: Middle East and Africa HPAPI Industry Volume (K Unit), by Poduct Type 2024 & 2032
- Figure 85: Middle East and Africa HPAPI Industry Revenue Share (%), by Poduct Type 2024 & 2032
- Figure 86: Middle East and Africa HPAPI Industry Volume Share (%), by Poduct Type 2024 & 2032
- Figure 87: Middle East and Africa HPAPI Industry Revenue (Million), by Application 2024 & 2032
- Figure 88: Middle East and Africa HPAPI Industry Volume (K Unit), by Application 2024 & 2032
- Figure 89: Middle East and Africa HPAPI Industry Revenue Share (%), by Application 2024 & 2032
- Figure 90: Middle East and Africa HPAPI Industry Volume Share (%), by Application 2024 & 2032
- Figure 91: Middle East and Africa HPAPI Industry Revenue (Million), by Synthesis 2024 & 2032
- Figure 92: Middle East and Africa HPAPI Industry Volume (K Unit), by Synthesis 2024 & 2032
- Figure 93: Middle East and Africa HPAPI Industry Revenue Share (%), by Synthesis 2024 & 2032
- Figure 94: Middle East and Africa HPAPI Industry Volume Share (%), by Synthesis 2024 & 2032
- Figure 95: Middle East and Africa HPAPI Industry Revenue (Million), by Manufacturer 2024 & 2032
- Figure 96: Middle East and Africa HPAPI Industry Volume (K Unit), by Manufacturer 2024 & 2032
- Figure 97: Middle East and Africa HPAPI Industry Revenue Share (%), by Manufacturer 2024 & 2032
- Figure 98: Middle East and Africa HPAPI Industry Volume Share (%), by Manufacturer 2024 & 2032
- Figure 99: Middle East and Africa HPAPI Industry Revenue (Million), by Country 2024 & 2032
- Figure 100: Middle East and Africa HPAPI Industry Volume (K Unit), by Country 2024 & 2032
- Figure 101: Middle East and Africa HPAPI Industry Revenue Share (%), by Country 2024 & 2032
- Figure 102: Middle East and Africa HPAPI Industry Volume Share (%), by Country 2024 & 2032
- Figure 103: South America HPAPI Industry Revenue (Million), by Poduct Type 2024 & 2032
- Figure 104: South America HPAPI Industry Volume (K Unit), by Poduct Type 2024 & 2032
- Figure 105: South America HPAPI Industry Revenue Share (%), by Poduct Type 2024 & 2032
- Figure 106: South America HPAPI Industry Volume Share (%), by Poduct Type 2024 & 2032
- Figure 107: South America HPAPI Industry Revenue (Million), by Application 2024 & 2032
- Figure 108: South America HPAPI Industry Volume (K Unit), by Application 2024 & 2032
- Figure 109: South America HPAPI Industry Revenue Share (%), by Application 2024 & 2032
- Figure 110: South America HPAPI Industry Volume Share (%), by Application 2024 & 2032
- Figure 111: South America HPAPI Industry Revenue (Million), by Synthesis 2024 & 2032
- Figure 112: South America HPAPI Industry Volume (K Unit), by Synthesis 2024 & 2032
- Figure 113: South America HPAPI Industry Revenue Share (%), by Synthesis 2024 & 2032
- Figure 114: South America HPAPI Industry Volume Share (%), by Synthesis 2024 & 2032
- Figure 115: South America HPAPI Industry Revenue (Million), by Manufacturer 2024 & 2032
- Figure 116: South America HPAPI Industry Volume (K Unit), by Manufacturer 2024 & 2032
- Figure 117: South America HPAPI Industry Revenue Share (%), by Manufacturer 2024 & 2032
- Figure 118: South America HPAPI Industry Volume Share (%), by Manufacturer 2024 & 2032
- Figure 119: South America HPAPI Industry Revenue (Million), by Country 2024 & 2032
- Figure 120: South America HPAPI Industry Volume (K Unit), by Country 2024 & 2032
- Figure 121: South America HPAPI Industry Revenue Share (%), by Country 2024 & 2032
- Figure 122: South America HPAPI Industry Volume Share (%), by Country 2024 & 2032
List of Tables
- Table 1: Global HPAPI Industry Revenue Million Forecast, by Region 2019 & 2032
- Table 2: Global HPAPI Industry Volume K Unit Forecast, by Region 2019 & 2032
- Table 3: Global HPAPI Industry Revenue Million Forecast, by Poduct Type 2019 & 2032
- Table 4: Global HPAPI Industry Volume K Unit Forecast, by Poduct Type 2019 & 2032
- Table 5: Global HPAPI Industry Revenue Million Forecast, by Application 2019 & 2032
- Table 6: Global HPAPI Industry Volume K Unit Forecast, by Application 2019 & 2032
- Table 7: Global HPAPI Industry Revenue Million Forecast, by Synthesis 2019 & 2032
- Table 8: Global HPAPI Industry Volume K Unit Forecast, by Synthesis 2019 & 2032
- Table 9: Global HPAPI Industry Revenue Million Forecast, by Manufacturer 2019 & 2032
- Table 10: Global HPAPI Industry Volume K Unit Forecast, by Manufacturer 2019 & 2032
- Table 11: Global HPAPI Industry Revenue Million Forecast, by Region 2019 & 2032
- Table 12: Global HPAPI Industry Volume K Unit Forecast, by Region 2019 & 2032
- Table 13: Global HPAPI Industry Revenue Million Forecast, by Country 2019 & 2032
- Table 14: Global HPAPI Industry Volume K Unit Forecast, by Country 2019 & 2032
- Table 15: United States HPAPI Industry Revenue (Million) Forecast, by Application 2019 & 2032
- Table 16: United States HPAPI Industry Volume (K Unit) Forecast, by Application 2019 & 2032
- Table 17: Canada HPAPI Industry Revenue (Million) Forecast, by Application 2019 & 2032
- Table 18: Canada HPAPI Industry Volume (K Unit) Forecast, by Application 2019 & 2032
- Table 19: Mexico HPAPI Industry Revenue (Million) Forecast, by Application 2019 & 2032
- Table 20: Mexico HPAPI Industry Volume (K Unit) Forecast, by Application 2019 & 2032
- Table 21: Global HPAPI Industry Revenue Million Forecast, by Country 2019 & 2032
- Table 22: Global HPAPI Industry Volume K Unit Forecast, by Country 2019 & 2032
- Table 23: Germany HPAPI Industry Revenue (Million) Forecast, by Application 2019 & 2032
- Table 24: Germany HPAPI Industry Volume (K Unit) Forecast, by Application 2019 & 2032
- Table 25: United Kingdom HPAPI Industry Revenue (Million) Forecast, by Application 2019 & 2032
- Table 26: United Kingdom HPAPI Industry Volume (K Unit) Forecast, by Application 2019 & 2032
- Table 27: France HPAPI Industry Revenue (Million) Forecast, by Application 2019 & 2032
- Table 28: France HPAPI Industry Volume (K Unit) Forecast, by Application 2019 & 2032
- Table 29: Italy HPAPI Industry Revenue (Million) Forecast, by Application 2019 & 2032
- Table 30: Italy HPAPI Industry Volume (K Unit) Forecast, by Application 2019 & 2032
- Table 31: Spain HPAPI Industry Revenue (Million) Forecast, by Application 2019 & 2032
- Table 32: Spain HPAPI Industry Volume (K Unit) Forecast, by Application 2019 & 2032
- Table 33: Rest of Europe HPAPI Industry Revenue (Million) Forecast, by Application 2019 & 2032
- Table 34: Rest of Europe HPAPI Industry Volume (K Unit) Forecast, by Application 2019 & 2032
- Table 35: Global HPAPI Industry Revenue Million Forecast, by Country 2019 & 2032
- Table 36: Global HPAPI Industry Volume K Unit Forecast, by Country 2019 & 2032
- Table 37: China HPAPI Industry Revenue (Million) Forecast, by Application 2019 & 2032
- Table 38: China HPAPI Industry Volume (K Unit) Forecast, by Application 2019 & 2032
- Table 39: Japan HPAPI Industry Revenue (Million) Forecast, by Application 2019 & 2032
- Table 40: Japan HPAPI Industry Volume (K Unit) Forecast, by Application 2019 & 2032
- Table 41: India HPAPI Industry Revenue (Million) Forecast, by Application 2019 & 2032
- Table 42: India HPAPI Industry Volume (K Unit) Forecast, by Application 2019 & 2032
- Table 43: Australia HPAPI Industry Revenue (Million) Forecast, by Application 2019 & 2032
- Table 44: Australia HPAPI Industry Volume (K Unit) Forecast, by Application 2019 & 2032
- Table 45: South Korea HPAPI Industry Revenue (Million) Forecast, by Application 2019 & 2032
- Table 46: South Korea HPAPI Industry Volume (K Unit) Forecast, by Application 2019 & 2032
- Table 47: Rest of Asia Pacific HPAPI Industry Revenue (Million) Forecast, by Application 2019 & 2032
- Table 48: Rest of Asia Pacific HPAPI Industry Volume (K Unit) Forecast, by Application 2019 & 2032
- Table 49: Global HPAPI Industry Revenue Million Forecast, by Country 2019 & 2032
- Table 50: Global HPAPI Industry Volume K Unit Forecast, by Country 2019 & 2032
- Table 51: GCC HPAPI Industry Revenue (Million) Forecast, by Application 2019 & 2032
- Table 52: GCC HPAPI Industry Volume (K Unit) Forecast, by Application 2019 & 2032
- Table 53: South Africa HPAPI Industry Revenue (Million) Forecast, by Application 2019 & 2032
- Table 54: South Africa HPAPI Industry Volume (K Unit) Forecast, by Application 2019 & 2032
- Table 55: Rest of Middle East and Africa HPAPI Industry Revenue (Million) Forecast, by Application 2019 & 2032
- Table 56: Rest of Middle East and Africa HPAPI Industry Volume (K Unit) Forecast, by Application 2019 & 2032
- Table 57: Global HPAPI Industry Revenue Million Forecast, by Country 2019 & 2032
- Table 58: Global HPAPI Industry Volume K Unit Forecast, by Country 2019 & 2032
- Table 59: Brazil HPAPI Industry Revenue (Million) Forecast, by Application 2019 & 2032
- Table 60: Brazil HPAPI Industry Volume (K Unit) Forecast, by Application 2019 & 2032
- Table 61: Argentina HPAPI Industry Revenue (Million) Forecast, by Application 2019 & 2032
- Table 62: Argentina HPAPI Industry Volume (K Unit) Forecast, by Application 2019 & 2032
- Table 63: Rest of South America HPAPI Industry Revenue (Million) Forecast, by Application 2019 & 2032
- Table 64: Rest of South America HPAPI Industry Volume (K Unit) Forecast, by Application 2019 & 2032
- Table 65: Global HPAPI Industry Revenue Million Forecast, by Poduct Type 2019 & 2032
- Table 66: Global HPAPI Industry Volume K Unit Forecast, by Poduct Type 2019 & 2032
- Table 67: Global HPAPI Industry Revenue Million Forecast, by Application 2019 & 2032
- Table 68: Global HPAPI Industry Volume K Unit Forecast, by Application 2019 & 2032
- Table 69: Global HPAPI Industry Revenue Million Forecast, by Synthesis 2019 & 2032
- Table 70: Global HPAPI Industry Volume K Unit Forecast, by Synthesis 2019 & 2032
- Table 71: Global HPAPI Industry Revenue Million Forecast, by Manufacturer 2019 & 2032
- Table 72: Global HPAPI Industry Volume K Unit Forecast, by Manufacturer 2019 & 2032
- Table 73: Global HPAPI Industry Revenue Million Forecast, by Country 2019 & 2032
- Table 74: Global HPAPI Industry Volume K Unit Forecast, by Country 2019 & 2032
- Table 75: United States HPAPI Industry Revenue (Million) Forecast, by Application 2019 & 2032
- Table 76: United States HPAPI Industry Volume (K Unit) Forecast, by Application 2019 & 2032
- Table 77: Canada HPAPI Industry Revenue (Million) Forecast, by Application 2019 & 2032
- Table 78: Canada HPAPI Industry Volume (K Unit) Forecast, by Application 2019 & 2032
- Table 79: Mexico HPAPI Industry Revenue (Million) Forecast, by Application 2019 & 2032
- Table 80: Mexico HPAPI Industry Volume (K Unit) Forecast, by Application 2019 & 2032
- Table 81: Global HPAPI Industry Revenue Million Forecast, by Poduct Type 2019 & 2032
- Table 82: Global HPAPI Industry Volume K Unit Forecast, by Poduct Type 2019 & 2032
- Table 83: Global HPAPI Industry Revenue Million Forecast, by Application 2019 & 2032
- Table 84: Global HPAPI Industry Volume K Unit Forecast, by Application 2019 & 2032
- Table 85: Global HPAPI Industry Revenue Million Forecast, by Synthesis 2019 & 2032
- Table 86: Global HPAPI Industry Volume K Unit Forecast, by Synthesis 2019 & 2032
- Table 87: Global HPAPI Industry Revenue Million Forecast, by Manufacturer 2019 & 2032
- Table 88: Global HPAPI Industry Volume K Unit Forecast, by Manufacturer 2019 & 2032
- Table 89: Global HPAPI Industry Revenue Million Forecast, by Country 2019 & 2032
- Table 90: Global HPAPI Industry Volume K Unit Forecast, by Country 2019 & 2032
- Table 91: Germany HPAPI Industry Revenue (Million) Forecast, by Application 2019 & 2032
- Table 92: Germany HPAPI Industry Volume (K Unit) Forecast, by Application 2019 & 2032
- Table 93: United Kingdom HPAPI Industry Revenue (Million) Forecast, by Application 2019 & 2032
- Table 94: United Kingdom HPAPI Industry Volume (K Unit) Forecast, by Application 2019 & 2032
- Table 95: France HPAPI Industry Revenue (Million) Forecast, by Application 2019 & 2032
- Table 96: France HPAPI Industry Volume (K Unit) Forecast, by Application 2019 & 2032
- Table 97: Italy HPAPI Industry Revenue (Million) Forecast, by Application 2019 & 2032
- Table 98: Italy HPAPI Industry Volume (K Unit) Forecast, by Application 2019 & 2032
- Table 99: Spain HPAPI Industry Revenue (Million) Forecast, by Application 2019 & 2032
- Table 100: Spain HPAPI Industry Volume (K Unit) Forecast, by Application 2019 & 2032
- Table 101: Rest of Europe HPAPI Industry Revenue (Million) Forecast, by Application 2019 & 2032
- Table 102: Rest of Europe HPAPI Industry Volume (K Unit) Forecast, by Application 2019 & 2032
- Table 103: Global HPAPI Industry Revenue Million Forecast, by Poduct Type 2019 & 2032
- Table 104: Global HPAPI Industry Volume K Unit Forecast, by Poduct Type 2019 & 2032
- Table 105: Global HPAPI Industry Revenue Million Forecast, by Application 2019 & 2032
- Table 106: Global HPAPI Industry Volume K Unit Forecast, by Application 2019 & 2032
- Table 107: Global HPAPI Industry Revenue Million Forecast, by Synthesis 2019 & 2032
- Table 108: Global HPAPI Industry Volume K Unit Forecast, by Synthesis 2019 & 2032
- Table 109: Global HPAPI Industry Revenue Million Forecast, by Manufacturer 2019 & 2032
- Table 110: Global HPAPI Industry Volume K Unit Forecast, by Manufacturer 2019 & 2032
- Table 111: Global HPAPI Industry Revenue Million Forecast, by Country 2019 & 2032
- Table 112: Global HPAPI Industry Volume K Unit Forecast, by Country 2019 & 2032
- Table 113: China HPAPI Industry Revenue (Million) Forecast, by Application 2019 & 2032
- Table 114: China HPAPI Industry Volume (K Unit) Forecast, by Application 2019 & 2032
- Table 115: Japan HPAPI Industry Revenue (Million) Forecast, by Application 2019 & 2032
- Table 116: Japan HPAPI Industry Volume (K Unit) Forecast, by Application 2019 & 2032
- Table 117: India HPAPI Industry Revenue (Million) Forecast, by Application 2019 & 2032
- Table 118: India HPAPI Industry Volume (K Unit) Forecast, by Application 2019 & 2032
- Table 119: Australia HPAPI Industry Revenue (Million) Forecast, by Application 2019 & 2032
- Table 120: Australia HPAPI Industry Volume (K Unit) Forecast, by Application 2019 & 2032
- Table 121: South Korea HPAPI Industry Revenue (Million) Forecast, by Application 2019 & 2032
- Table 122: South Korea HPAPI Industry Volume (K Unit) Forecast, by Application 2019 & 2032
- Table 123: Rest of Asia Pacific HPAPI Industry Revenue (Million) Forecast, by Application 2019 & 2032
- Table 124: Rest of Asia Pacific HPAPI Industry Volume (K Unit) Forecast, by Application 2019 & 2032
- Table 125: Global HPAPI Industry Revenue Million Forecast, by Poduct Type 2019 & 2032
- Table 126: Global HPAPI Industry Volume K Unit Forecast, by Poduct Type 2019 & 2032
- Table 127: Global HPAPI Industry Revenue Million Forecast, by Application 2019 & 2032
- Table 128: Global HPAPI Industry Volume K Unit Forecast, by Application 2019 & 2032
- Table 129: Global HPAPI Industry Revenue Million Forecast, by Synthesis 2019 & 2032
- Table 130: Global HPAPI Industry Volume K Unit Forecast, by Synthesis 2019 & 2032
- Table 131: Global HPAPI Industry Revenue Million Forecast, by Manufacturer 2019 & 2032
- Table 132: Global HPAPI Industry Volume K Unit Forecast, by Manufacturer 2019 & 2032
- Table 133: Global HPAPI Industry Revenue Million Forecast, by Country 2019 & 2032
- Table 134: Global HPAPI Industry Volume K Unit Forecast, by Country 2019 & 2032
- Table 135: GCC HPAPI Industry Revenue (Million) Forecast, by Application 2019 & 2032
- Table 136: GCC HPAPI Industry Volume (K Unit) Forecast, by Application 2019 & 2032
- Table 137: South Africa HPAPI Industry Revenue (Million) Forecast, by Application 2019 & 2032
- Table 138: South Africa HPAPI Industry Volume (K Unit) Forecast, by Application 2019 & 2032
- Table 139: Rest of Middle East and Africa HPAPI Industry Revenue (Million) Forecast, by Application 2019 & 2032
- Table 140: Rest of Middle East and Africa HPAPI Industry Volume (K Unit) Forecast, by Application 2019 & 2032
- Table 141: Global HPAPI Industry Revenue Million Forecast, by Poduct Type 2019 & 2032
- Table 142: Global HPAPI Industry Volume K Unit Forecast, by Poduct Type 2019 & 2032
- Table 143: Global HPAPI Industry Revenue Million Forecast, by Application 2019 & 2032
- Table 144: Global HPAPI Industry Volume K Unit Forecast, by Application 2019 & 2032
- Table 145: Global HPAPI Industry Revenue Million Forecast, by Synthesis 2019 & 2032
- Table 146: Global HPAPI Industry Volume K Unit Forecast, by Synthesis 2019 & 2032
- Table 147: Global HPAPI Industry Revenue Million Forecast, by Manufacturer 2019 & 2032
- Table 148: Global HPAPI Industry Volume K Unit Forecast, by Manufacturer 2019 & 2032
- Table 149: Global HPAPI Industry Revenue Million Forecast, by Country 2019 & 2032
- Table 150: Global HPAPI Industry Volume K Unit Forecast, by Country 2019 & 2032
- Table 151: Brazil HPAPI Industry Revenue (Million) Forecast, by Application 2019 & 2032
- Table 152: Brazil HPAPI Industry Volume (K Unit) Forecast, by Application 2019 & 2032
- Table 153: Argentina HPAPI Industry Revenue (Million) Forecast, by Application 2019 & 2032
- Table 154: Argentina HPAPI Industry Volume (K Unit) Forecast, by Application 2019 & 2032
- Table 155: Rest of South America HPAPI Industry Revenue (Million) Forecast, by Application 2019 & 2032
- Table 156: Rest of South America HPAPI Industry Volume (K Unit) Forecast, by Application 2019 & 2032
Frequently Asked Questions
1. What is the projected Compound Annual Growth Rate (CAGR) of the HPAPI Industry?
The projected CAGR is approximately 9.27%.
2. Which companies are prominent players in the HPAPI Industry?
Key companies in the market include Merck KGaA, Thermo Fisher Scientific Inc, Teva Pharmaceutical Industries Ltd, Sanofi (EUROAPI), AbbVie Inc, Corden Pharma International, Viatris Inc , Sun Pharmaceutical Industries Ltd, SK Biotek, Pfizer Inc.
3. What are the main segments of the HPAPI Industry?
The market segments include Poduct Type, Application, Synthesis, Manufacturer.
4. Can you provide details about the market size?
The market size is estimated to be USD 26.85 Million as of 2022.
5. What are some drivers contributing to market growth?
Increasing Demand for Pharmaceutical Drugs; Increasing Focus on Precision Medicine and High-potency APIs; Technological Advancements in High-potency API Manufacturing.
6. What are the notable trends driving market growth?
Generic High-potency Active Pharmaceutical Ingredients Segment is Expected to Record Significant Growth.
7. Are there any restraints impacting market growth?
Huge Capital Investment; Ever Changing Industry Standards and Guidelines.
8. Can you provide examples of recent developments in the market?
January 2023: Sai Life Sciences completed the construction of a new High-Potency API (HPAPI) manufacturing facility at its cGMP API Manufacturing site in Bidar, India. This addition significantly enhances the company's expertise in HPAPI development and production, providing customers with an expedited route for New Chemical Entity (NCE) development.
9. What pricing options are available for accessing the report?
Pricing options include single-user, multi-user, and enterprise licenses priced at USD 4750, USD 5250, and USD 8750 respectively.
10. Is the market size provided in terms of value or volume?
The market size is provided in terms of value, measured in Million and volume, measured in K Unit.
11. Are there any specific market keywords associated with the report?
Yes, the market keyword associated with the report is "HPAPI Industry," which aids in identifying and referencing the specific market segment covered.
12. How do I determine which pricing option suits my needs best?
The pricing options vary based on user requirements and access needs. Individual users may opt for single-user licenses, while businesses requiring broader access may choose multi-user or enterprise licenses for cost-effective access to the report.
13. Are there any additional resources or data provided in the HPAPI Industry report?
While the report offers comprehensive insights, it's advisable to review the specific contents or supplementary materials provided to ascertain if additional resources or data are available.
14. How can I stay updated on further developments or reports in the HPAPI Industry?
To stay informed about further developments, trends, and reports in the HPAPI Industry, consider subscribing to industry newsletters, following relevant companies and organizations, or regularly checking reputable industry news sources and publications.
Methodology
Step 1 - Identification of Relevant Samples Size from Population Database


Step 2 - Approaches for Defining Global Market Size (Value, Volume* & Price*)

Note*: In applicable scenarios
Step 3 - Data Sources
Primary Research
- Web Analytics
- Survey Reports
- Research Institute
- Latest Research Reports
- Opinion Leaders
Secondary Research
- Annual Reports
- White Paper
- Latest Press Release
- Industry Association
- Paid Database
- Investor Presentations

Step 4 - Data Triangulation
Involves using different sources of information in order to increase the validity of a study
These sources are likely to be stakeholders in a program - participants, other researchers, program staff, other community members, and so on.
Then we put all data in single framework & apply various statistical tools to find out the dynamic on the market.
During the analysis stage, feedback from the stakeholder groups would be compared to determine areas of agreement as well as areas of divergence


