
Key Insights
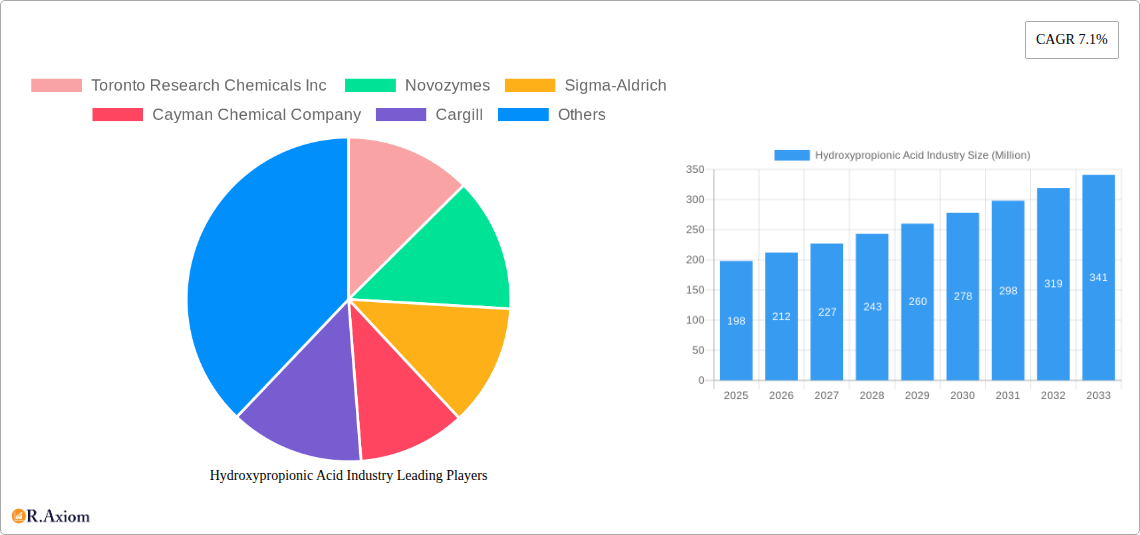
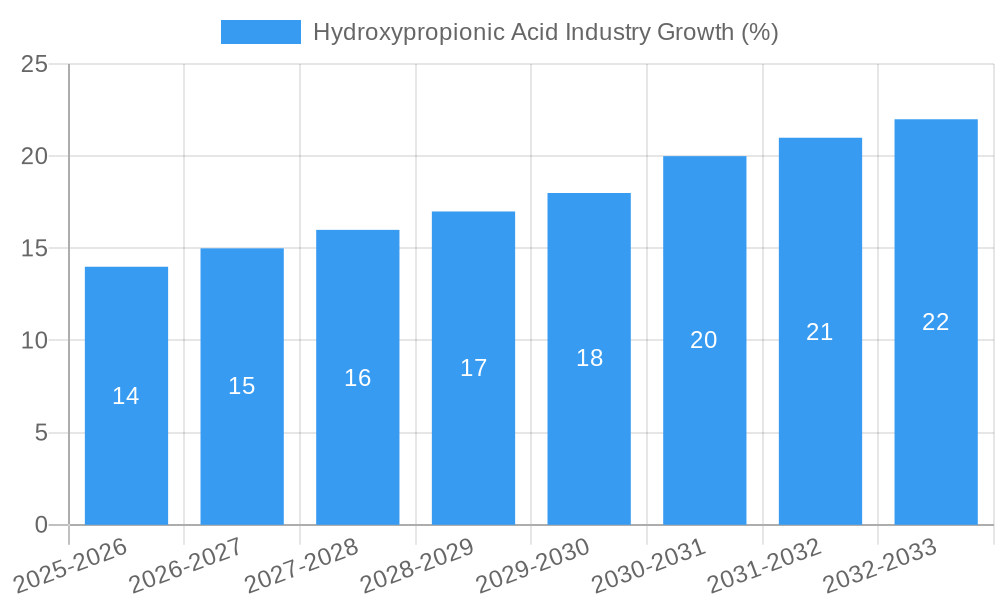
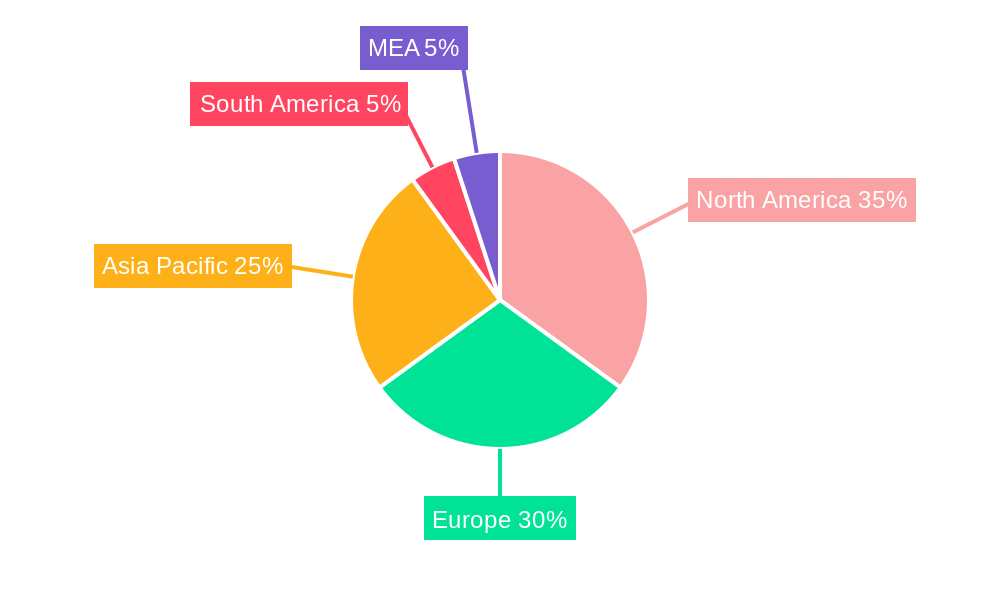
The global hydroxypropionic acid market, valued at $198 million in 2025, is projected to experience robust growth, driven by increasing demand from key application segments such as paints and coatings, polymers, and adhesives & sealants. A compound annual growth rate (CAGR) of 7.1% from 2025 to 2033 indicates a significant expansion of this market over the forecast period. This growth is fueled by several factors. The expanding construction and automotive industries are major contributors to the rising demand for paints and coatings, a primary application for hydroxypropionic acid. Furthermore, the burgeoning polymer and adhesives & sealants sectors are also driving market expansion due to the unique properties of hydroxypropionic acid, such as its ability to enhance adhesion, flexibility, and durability in various products. Technological advancements in manufacturing processes and a growing awareness of the sustainability benefits of hydroxypropionic acid-based products are also contributing to the market's positive trajectory. However, potential restraints include price volatility of raw materials and the emergence of alternative chemicals with comparable functionalities. Geographic distribution shows a significant presence in North America and Europe, though the Asia-Pacific region is expected to witness considerable growth due to rapid industrialization and increasing infrastructure development. Key players in the market, including Toronto Research Chemicals Inc., Novozymes, and BASF SE, are investing in research and development to enhance product offerings and expand their market share.
The market segmentation reveals powder and liquid forms dominate the product landscape. Within applications, the paints and coatings segment currently holds the largest market share, though the polymer and adhesives & sealants segments are poised for substantial growth in the coming years, reflecting the rising demand for high-performance materials in various sectors. Competitive dynamics within the industry are characterized by both established players and emerging companies. The strategic collaborations, mergers, and acquisitions prevalent in the market will further reshape the competitive landscape and drive innovation. The forecast period (2025-2033) suggests that the market will continue its upward trajectory, spurred by consistent demand across various end-use industries and the continuous improvement of hydroxypropionic acid's functionalities and applications. Further market penetration in developing economies is also expected to significantly contribute to the overall market expansion.
Hydroxypropionic Acid Industry: A Comprehensive Market Analysis (2019-2033)
This in-depth report provides a comprehensive analysis of the Hydroxypropionic Acid industry, offering valuable insights for stakeholders across the value chain. Covering the period from 2019 to 2033, with a focus on 2025, this report delves into market dynamics, competitive landscapes, and future growth potential. The report utilizes rigorous data analysis and expert insights to provide actionable strategies for businesses operating in or seeking entry into this dynamic market. The global Hydroxypropionic Acid market size was valued at xx Million in 2024 and is projected to reach xx Million by 2033, exhibiting a CAGR of xx% during the forecast period (2025-2033).
Hydroxypropionic Acid Industry Market Concentration & Innovation
The Hydroxypropionic Acid market exhibits a moderately concentrated structure, with several key players holding significant market share. While precise market share data for individual companies remains proprietary, key players like Toronto Research Chemicals Inc, Novozymes, Sigma-Aldrich, Cayman Chemical Company, Cargill, TCI N V, BASF SE, Dalton Research Molecules, Spectrum Chemical Manufacturing Corp, Alfa Aesar (Thermo Fisher Scientific), SynQuest Laboratories, Capot chemical, and Oakwood Products Inc. collectively account for a substantial portion of the market. Innovation is driven by the need for higher purity products, novel applications, and sustainable manufacturing processes. Regulatory frameworks, particularly concerning chemical safety and environmental impact, significantly influence industry practices. Product substitutes, while limited, exist in certain niche applications. M&A activity has been relatively modest in recent years, with deal values generally in the range of xx Million to xx Million. End-user trends are shifting towards more specialized and high-performance materials, driving demand for customized Hydroxypropionic Acid formulations.
- Market Concentration: Moderately Concentrated
- Key Innovation Drivers: Higher purity, new applications, sustainable manufacturing
- Regulatory Impact: Significant influence on safety and environmental standards
- M&A Activity: Relatively low, with deal values ranging from xx Million to xx Million.
Hydroxypropionic Acid Industry Industry Trends & Insights
The Hydroxypropionic Acid market is experiencing robust growth, fueled by increasing demand from various end-use sectors. The rising adoption of Hydroxypropionic Acid in paints and coatings, polymers, and adhesives and sealants is a major growth driver. Technological advancements in synthesis and purification techniques are further enhancing the efficiency and cost-effectiveness of Hydroxypropionic Acid production. Consumer preferences for sustainable and environmentally friendly products are also impacting market dynamics, driving demand for bio-based Hydroxypropionic Acid alternatives. The competitive landscape is characterized by both established players and emerging companies, leading to increased innovation and product diversification. Market penetration is relatively high in established applications like paints and coatings but remains limited in certain niche segments. The Compound Annual Growth Rate (CAGR) for the Hydroxypropionic Acid market during the forecast period (2025-2033) is estimated to be xx%.
Dominant Markets & Segments in Hydroxypropionic Acid Industry
The dominant segments within the Hydroxypropionic Acid market vary by region and application. While detailed regional breakdown requires specific data not available at this time, current trends suggest North America and Europe may represent significant markets. The liquid form of Hydroxypropionic Acid currently holds a larger market share compared to the powder form due to its ease of handling and application in many processes. The paints and coatings segment is currently the largest application area due to its established use and relatively high volume consumption. The polymer segment is showing promising growth due to increased demand for high-performance polymers. The adhesives and sealants segment continues to grow at a steady rate, driven by construction and manufacturing needs. The ‘Others’ segment shows potential growth but remains relatively small compared to established application segments.
- Key Drivers of Segment Dominance:
- Paints and Coatings: Established usage, high volume consumption.
- Polymers: Increased demand for high-performance materials.
- Adhesives and Sealants: Construction and manufacturing growth.
- Regional Dominance: Further investigation needed to determine specific regions.
Hydroxypropionic Acid Industry Product Developments
Recent product developments in the Hydroxypropionic Acid industry focus on improving purity, enhancing performance characteristics, and developing more sustainable production methods. Innovations include the development of highly purified grades suitable for demanding applications, such as pharmaceuticals, and the exploration of bio-based production routes to minimize environmental impact. These advancements enable the expansion of Hydroxypropionic Acid into new applications and provide competitive advantages to manufacturers offering superior quality and sustainability.
Report Scope & Segmentation Analysis
This report segments the Hydroxypropionic Acid market by product (Powder, Liquid) and application (Paints and Coatings, Polymer, Adhesives and Sealants, Others). Each segment is analyzed based on its market size, growth projections, and competitive landscape. The Powder segment offers advantages in storage and transportation, while the Liquid segment provides benefits in ease of handling and application. The Paints and Coatings segment is projected to maintain its leading position due to high demand. The Polymer segment is showing high growth potential, while the Adhesives and Sealants segment exhibits steady expansion. The 'Others' segment represents various niche applications, and further research is required to obtain more specific details.
Key Drivers of Hydroxypropionic Acid Industry Growth
Several factors are driving the growth of the Hydroxypropionic Acid industry. The increasing demand for high-performance materials in various sectors, including paints and coatings, polymers, and adhesives, is a key driver. Technological advancements in production methods lead to cost reductions and improved product quality. Furthermore, favorable government regulations and policies promoting sustainable materials are creating opportunities for growth. Finally, expanding research and development efforts are continually opening up new application areas for Hydroxypropionic Acid.
Challenges in the Hydroxypropionic Acid Industry Sector
The Hydroxypropionic Acid industry faces several challenges, including the volatility of raw material prices, potential regulatory hurdles related to chemical safety and environmental concerns, and competitive pressures from substitutes in specific applications. Supply chain disruptions, especially given global events, could also negatively affect production and pricing. These factors may pose constraints to market growth in the coming years.
Emerging Opportunities in Hydroxypropionic Acid Industry
Emerging opportunities lie in expanding into new applications, especially in bio-based materials and sustainable solutions. The development of advanced formulations tailored to specific industry needs holds significant potential. Further research into novel applications in sectors like pharmaceuticals and electronics could unlock new market segments.
Leading Players in the Hydroxypropionic Acid Industry Market
- Toronto Research Chemicals Inc
- Novozymes
- Sigma-Aldrich
- Cayman Chemical Company
- Cargill
- TCI N V
- BASF SE
- Dalton Research Molecules
- Spectrum Chemical Manufacturing Corp
- Alfa Aesar (Thermo Fisher Scientific)
- SynQuest Laboratories
- Capot chemical
- Oakwood Products Inc
Key Developments in Hydroxypropionic Acid Industry Industry
- 2023: Company X launched a new high-purity Hydroxypropionic Acid product for pharmaceutical applications.
- 2022: Company Y announced a strategic partnership to expand its bio-based Hydroxypropionic Acid production capacity.
- Further details needed: Add more key developments with specific dates.
Strategic Outlook for Hydroxypropionic Acid Industry Market
The Hydroxypropionic Acid market is poised for continued growth driven by rising demand from various sectors and ongoing innovation in production and applications. Opportunities exist in developing sustainable solutions and expanding into niche markets. Companies that invest in research and development, adopt efficient manufacturing processes, and focus on customer needs will be well-positioned to capitalize on this growth potential.
Hydroxypropionic Acid Industry Segmentation
-
1. Product
- 1.1. Powder
- 1.2. Liquid
-
2. Application
- 2.1. Paints and Coatings
- 2.2. Polymer
- 2.3. Adhesives and Sealants
- 2.4. Others
Hydroxypropionic Acid Industry Segmentation By Geography
-
1. Asia Pacific
- 1.1. China
- 1.2. India
- 1.3. Japan
- 1.4. South Korea
- 1.5. Rest of Asia Pacific
-
2. North America
- 2.1. United States
- 2.2. Canada
- 2.3. Mexico
-
3. Europe
- 3.1. Germany
- 3.2. United Kingdom
- 3.3. France
- 3.4. Italy
- 3.5. Rest of Europe
-
4. South America
- 4.1. Brazil
- 4.2. Argentina
- 4.3. Rest of South America
-
5. Middle East and Africa
- 5.1. Saudi Arabia
- 5.2. South Africa
- 5.3. Rest of Middle East and Africa
Hydroxypropionic Acid Industry REPORT HIGHLIGHTS
| Aspects | Details |
|---|---|
| Study Period | 2019-2033 |
| Base Year | 2024 |
| Estimated Year | 2025 |
| Forecast Period | 2025-2033 |
| Historical Period | 2019-2024 |
| Growth Rate | CAGR of 7.1% from 2019-2033 |
| Segmentation |
|
Table of Contents
- 1. Introduction
- 1.1. Research Scope
- 1.2. Market Segmentation
- 1.3. Research Methodology
- 1.4. Definitions and Assumptions
- 2. Executive Summary
- 2.1. Introduction
- 3. Market Dynamics
- 3.1. Introduction
- 3.2. Market Drivers
- 3.2.1. ; Growing Demand from Paints and Coatings Sector; Other Drivers
- 3.3. Market Restrains
- 3.3.1. ; Unfavorable Conditions Arising Due to COVID-19 Outbreak; Other Restraints
- 3.4. Market Trends
- 3.4.1. Paints and Coatings Sector to Dominate the Market
- 4. Market Factor Analysis
- 4.1. Porters Five Forces
- 4.2. Supply/Value Chain
- 4.3. PESTEL analysis
- 4.4. Market Entropy
- 4.5. Patent/Trademark Analysis
- 5. Global Hydroxypropionic Acid Industry Analysis, Insights and Forecast, 2019-2031
- 5.1. Market Analysis, Insights and Forecast - by Product
- 5.1.1. Powder
- 5.1.2. Liquid
- 5.2. Market Analysis, Insights and Forecast - by Application
- 5.2.1. Paints and Coatings
- 5.2.2. Polymer
- 5.2.3. Adhesives and Sealants
- 5.2.4. Others
- 5.3. Market Analysis, Insights and Forecast - by Region
- 5.3.1. Asia Pacific
- 5.3.2. North America
- 5.3.3. Europe
- 5.3.4. South America
- 5.3.5. Middle East and Africa
- 5.1. Market Analysis, Insights and Forecast - by Product
- 6. Asia Pacific Hydroxypropionic Acid Industry Analysis, Insights and Forecast, 2019-2031
- 6.1. Market Analysis, Insights and Forecast - by Product
- 6.1.1. Powder
- 6.1.2. Liquid
- 6.2. Market Analysis, Insights and Forecast - by Application
- 6.2.1. Paints and Coatings
- 6.2.2. Polymer
- 6.2.3. Adhesives and Sealants
- 6.2.4. Others
- 6.1. Market Analysis, Insights and Forecast - by Product
- 7. North America Hydroxypropionic Acid Industry Analysis, Insights and Forecast, 2019-2031
- 7.1. Market Analysis, Insights and Forecast - by Product
- 7.1.1. Powder
- 7.1.2. Liquid
- 7.2. Market Analysis, Insights and Forecast - by Application
- 7.2.1. Paints and Coatings
- 7.2.2. Polymer
- 7.2.3. Adhesives and Sealants
- 7.2.4. Others
- 7.1. Market Analysis, Insights and Forecast - by Product
- 8. Europe Hydroxypropionic Acid Industry Analysis, Insights and Forecast, 2019-2031
- 8.1. Market Analysis, Insights and Forecast - by Product
- 8.1.1. Powder
- 8.1.2. Liquid
- 8.2. Market Analysis, Insights and Forecast - by Application
- 8.2.1. Paints and Coatings
- 8.2.2. Polymer
- 8.2.3. Adhesives and Sealants
- 8.2.4. Others
- 8.1. Market Analysis, Insights and Forecast - by Product
- 9. South America Hydroxypropionic Acid Industry Analysis, Insights and Forecast, 2019-2031
- 9.1. Market Analysis, Insights and Forecast - by Product
- 9.1.1. Powder
- 9.1.2. Liquid
- 9.2. Market Analysis, Insights and Forecast - by Application
- 9.2.1. Paints and Coatings
- 9.2.2. Polymer
- 9.2.3. Adhesives and Sealants
- 9.2.4. Others
- 9.1. Market Analysis, Insights and Forecast - by Product
- 10. Middle East and Africa Hydroxypropionic Acid Industry Analysis, Insights and Forecast, 2019-2031
- 10.1. Market Analysis, Insights and Forecast - by Product
- 10.1.1. Powder
- 10.1.2. Liquid
- 10.2. Market Analysis, Insights and Forecast - by Application
- 10.2.1. Paints and Coatings
- 10.2.2. Polymer
- 10.2.3. Adhesives and Sealants
- 10.2.4. Others
- 10.1. Market Analysis, Insights and Forecast - by Product
- 11. North America Hydroxypropionic Acid Industry Analysis, Insights and Forecast, 2019-2031
- 11.1. Market Analysis, Insights and Forecast - By Country/Sub-region
- 11.1.1 United States
- 11.1.2 Canada
- 11.1.3 Mexico
- 12. Europe Hydroxypropionic Acid Industry Analysis, Insights and Forecast, 2019-2031
- 12.1. Market Analysis, Insights and Forecast - By Country/Sub-region
- 12.1.1 Germany
- 12.1.2 France
- 12.1.3 Italy
- 12.1.4 United Kingdom
- 12.1.5 Netherlands
- 12.1.6 Rest of Europe
- 13. Asia Pacific Hydroxypropionic Acid Industry Analysis, Insights and Forecast, 2019-2031
- 13.1. Market Analysis, Insights and Forecast - By Country/Sub-region
- 13.1.1 China
- 13.1.2 Japan
- 13.1.3 India
- 13.1.4 South Korea
- 13.1.5 Taiwan
- 13.1.6 Australia
- 13.1.7 Rest of Asia-Pacific
- 14. South America Hydroxypropionic Acid Industry Analysis, Insights and Forecast, 2019-2031
- 14.1. Market Analysis, Insights and Forecast - By Country/Sub-region
- 14.1.1 Brazil
- 14.1.2 Argentina
- 14.1.3 Rest of South America
- 15. MEA Hydroxypropionic Acid Industry Analysis, Insights and Forecast, 2019-2031
- 15.1. Market Analysis, Insights and Forecast - By Country/Sub-region
- 15.1.1 Middle East
- 15.1.2 Africa
- 16. Competitive Analysis
- 16.1. Global Market Share Analysis 2024
- 16.2. Company Profiles
- 16.2.1 Toronto Research Chemicals Inc
- 16.2.1.1. Overview
- 16.2.1.2. Products
- 16.2.1.3. SWOT Analysis
- 16.2.1.4. Recent Developments
- 16.2.1.5. Financials (Based on Availability)
- 16.2.2 Novozymes
- 16.2.2.1. Overview
- 16.2.2.2. Products
- 16.2.2.3. SWOT Analysis
- 16.2.2.4. Recent Developments
- 16.2.2.5. Financials (Based on Availability)
- 16.2.3 Sigma-Aldrich
- 16.2.3.1. Overview
- 16.2.3.2. Products
- 16.2.3.3. SWOT Analysis
- 16.2.3.4. Recent Developments
- 16.2.3.5. Financials (Based on Availability)
- 16.2.4 Cayman Chemical Company
- 16.2.4.1. Overview
- 16.2.4.2. Products
- 16.2.4.3. SWOT Analysis
- 16.2.4.4. Recent Developments
- 16.2.4.5. Financials (Based on Availability)
- 16.2.5 Cargill
- 16.2.5.1. Overview
- 16.2.5.2. Products
- 16.2.5.3. SWOT Analysis
- 16.2.5.4. Recent Developments
- 16.2.5.5. Financials (Based on Availability)
- 16.2.6 TCI N V
- 16.2.6.1. Overview
- 16.2.6.2. Products
- 16.2.6.3. SWOT Analysis
- 16.2.6.4. Recent Developments
- 16.2.6.5. Financials (Based on Availability)
- 16.2.7 BASF SE
- 16.2.7.1. Overview
- 16.2.7.2. Products
- 16.2.7.3. SWOT Analysis
- 16.2.7.4. Recent Developments
- 16.2.7.5. Financials (Based on Availability)
- 16.2.8 Dalton Research Molecules
- 16.2.8.1. Overview
- 16.2.8.2. Products
- 16.2.8.3. SWOT Analysis
- 16.2.8.4. Recent Developments
- 16.2.8.5. Financials (Based on Availability)
- 16.2.9 Spectrum Chemical Manufacturing Corp
- 16.2.9.1. Overview
- 16.2.9.2. Products
- 16.2.9.3. SWOT Analysis
- 16.2.9.4. Recent Developments
- 16.2.9.5. Financials (Based on Availability)
- 16.2.10 Alfa Aesar (Thermo Fisher Scientific)
- 16.2.10.1. Overview
- 16.2.10.2. Products
- 16.2.10.3. SWOT Analysis
- 16.2.10.4. Recent Developments
- 16.2.10.5. Financials (Based on Availability)
- 16.2.11 SynQuest Laboratories
- 16.2.11.1. Overview
- 16.2.11.2. Products
- 16.2.11.3. SWOT Analysis
- 16.2.11.4. Recent Developments
- 16.2.11.5. Financials (Based on Availability)
- 16.2.12 Capot chemical
- 16.2.12.1. Overview
- 16.2.12.2. Products
- 16.2.12.3. SWOT Analysis
- 16.2.12.4. Recent Developments
- 16.2.12.5. Financials (Based on Availability)
- 16.2.13 Oakwood Products Inc
- 16.2.13.1. Overview
- 16.2.13.2. Products
- 16.2.13.3. SWOT Analysis
- 16.2.13.4. Recent Developments
- 16.2.13.5. Financials (Based on Availability)
- 16.2.1 Toronto Research Chemicals Inc
List of Figures
- Figure 1: Global Hydroxypropionic Acid Industry Revenue Breakdown (Million, %) by Region 2024 & 2032
- Figure 2: Global Hydroxypropionic Acid Industry Volume Breakdown (K Tons, %) by Region 2024 & 2032
- Figure 3: North America Hydroxypropionic Acid Industry Revenue (Million), by Country 2024 & 2032
- Figure 4: North America Hydroxypropionic Acid Industry Volume (K Tons), by Country 2024 & 2032
- Figure 5: North America Hydroxypropionic Acid Industry Revenue Share (%), by Country 2024 & 2032
- Figure 6: North America Hydroxypropionic Acid Industry Volume Share (%), by Country 2024 & 2032
- Figure 7: Europe Hydroxypropionic Acid Industry Revenue (Million), by Country 2024 & 2032
- Figure 8: Europe Hydroxypropionic Acid Industry Volume (K Tons), by Country 2024 & 2032
- Figure 9: Europe Hydroxypropionic Acid Industry Revenue Share (%), by Country 2024 & 2032
- Figure 10: Europe Hydroxypropionic Acid Industry Volume Share (%), by Country 2024 & 2032
- Figure 11: Asia Pacific Hydroxypropionic Acid Industry Revenue (Million), by Country 2024 & 2032
- Figure 12: Asia Pacific Hydroxypropionic Acid Industry Volume (K Tons), by Country 2024 & 2032
- Figure 13: Asia Pacific Hydroxypropionic Acid Industry Revenue Share (%), by Country 2024 & 2032
- Figure 14: Asia Pacific Hydroxypropionic Acid Industry Volume Share (%), by Country 2024 & 2032
- Figure 15: South America Hydroxypropionic Acid Industry Revenue (Million), by Country 2024 & 2032
- Figure 16: South America Hydroxypropionic Acid Industry Volume (K Tons), by Country 2024 & 2032
- Figure 17: South America Hydroxypropionic Acid Industry Revenue Share (%), by Country 2024 & 2032
- Figure 18: South America Hydroxypropionic Acid Industry Volume Share (%), by Country 2024 & 2032
- Figure 19: MEA Hydroxypropionic Acid Industry Revenue (Million), by Country 2024 & 2032
- Figure 20: MEA Hydroxypropionic Acid Industry Volume (K Tons), by Country 2024 & 2032
- Figure 21: MEA Hydroxypropionic Acid Industry Revenue Share (%), by Country 2024 & 2032
- Figure 22: MEA Hydroxypropionic Acid Industry Volume Share (%), by Country 2024 & 2032
- Figure 23: Asia Pacific Hydroxypropionic Acid Industry Revenue (Million), by Product 2024 & 2032
- Figure 24: Asia Pacific Hydroxypropionic Acid Industry Volume (K Tons), by Product 2024 & 2032
- Figure 25: Asia Pacific Hydroxypropionic Acid Industry Revenue Share (%), by Product 2024 & 2032
- Figure 26: Asia Pacific Hydroxypropionic Acid Industry Volume Share (%), by Product 2024 & 2032
- Figure 27: Asia Pacific Hydroxypropionic Acid Industry Revenue (Million), by Application 2024 & 2032
- Figure 28: Asia Pacific Hydroxypropionic Acid Industry Volume (K Tons), by Application 2024 & 2032
- Figure 29: Asia Pacific Hydroxypropionic Acid Industry Revenue Share (%), by Application 2024 & 2032
- Figure 30: Asia Pacific Hydroxypropionic Acid Industry Volume Share (%), by Application 2024 & 2032
- Figure 31: Asia Pacific Hydroxypropionic Acid Industry Revenue (Million), by Country 2024 & 2032
- Figure 32: Asia Pacific Hydroxypropionic Acid Industry Volume (K Tons), by Country 2024 & 2032
- Figure 33: Asia Pacific Hydroxypropionic Acid Industry Revenue Share (%), by Country 2024 & 2032
- Figure 34: Asia Pacific Hydroxypropionic Acid Industry Volume Share (%), by Country 2024 & 2032
- Figure 35: North America Hydroxypropionic Acid Industry Revenue (Million), by Product 2024 & 2032
- Figure 36: North America Hydroxypropionic Acid Industry Volume (K Tons), by Product 2024 & 2032
- Figure 37: North America Hydroxypropionic Acid Industry Revenue Share (%), by Product 2024 & 2032
- Figure 38: North America Hydroxypropionic Acid Industry Volume Share (%), by Product 2024 & 2032
- Figure 39: North America Hydroxypropionic Acid Industry Revenue (Million), by Application 2024 & 2032
- Figure 40: North America Hydroxypropionic Acid Industry Volume (K Tons), by Application 2024 & 2032
- Figure 41: North America Hydroxypropionic Acid Industry Revenue Share (%), by Application 2024 & 2032
- Figure 42: North America Hydroxypropionic Acid Industry Volume Share (%), by Application 2024 & 2032
- Figure 43: North America Hydroxypropionic Acid Industry Revenue (Million), by Country 2024 & 2032
- Figure 44: North America Hydroxypropionic Acid Industry Volume (K Tons), by Country 2024 & 2032
- Figure 45: North America Hydroxypropionic Acid Industry Revenue Share (%), by Country 2024 & 2032
- Figure 46: North America Hydroxypropionic Acid Industry Volume Share (%), by Country 2024 & 2032
- Figure 47: Europe Hydroxypropionic Acid Industry Revenue (Million), by Product 2024 & 2032
- Figure 48: Europe Hydroxypropionic Acid Industry Volume (K Tons), by Product 2024 & 2032
- Figure 49: Europe Hydroxypropionic Acid Industry Revenue Share (%), by Product 2024 & 2032
- Figure 50: Europe Hydroxypropionic Acid Industry Volume Share (%), by Product 2024 & 2032
- Figure 51: Europe Hydroxypropionic Acid Industry Revenue (Million), by Application 2024 & 2032
- Figure 52: Europe Hydroxypropionic Acid Industry Volume (K Tons), by Application 2024 & 2032
- Figure 53: Europe Hydroxypropionic Acid Industry Revenue Share (%), by Application 2024 & 2032
- Figure 54: Europe Hydroxypropionic Acid Industry Volume Share (%), by Application 2024 & 2032
- Figure 55: Europe Hydroxypropionic Acid Industry Revenue (Million), by Country 2024 & 2032
- Figure 56: Europe Hydroxypropionic Acid Industry Volume (K Tons), by Country 2024 & 2032
- Figure 57: Europe Hydroxypropionic Acid Industry Revenue Share (%), by Country 2024 & 2032
- Figure 58: Europe Hydroxypropionic Acid Industry Volume Share (%), by Country 2024 & 2032
- Figure 59: South America Hydroxypropionic Acid Industry Revenue (Million), by Product 2024 & 2032
- Figure 60: South America Hydroxypropionic Acid Industry Volume (K Tons), by Product 2024 & 2032
- Figure 61: South America Hydroxypropionic Acid Industry Revenue Share (%), by Product 2024 & 2032
- Figure 62: South America Hydroxypropionic Acid Industry Volume Share (%), by Product 2024 & 2032
- Figure 63: South America Hydroxypropionic Acid Industry Revenue (Million), by Application 2024 & 2032
- Figure 64: South America Hydroxypropionic Acid Industry Volume (K Tons), by Application 2024 & 2032
- Figure 65: South America Hydroxypropionic Acid Industry Revenue Share (%), by Application 2024 & 2032
- Figure 66: South America Hydroxypropionic Acid Industry Volume Share (%), by Application 2024 & 2032
- Figure 67: South America Hydroxypropionic Acid Industry Revenue (Million), by Country 2024 & 2032
- Figure 68: South America Hydroxypropionic Acid Industry Volume (K Tons), by Country 2024 & 2032
- Figure 69: South America Hydroxypropionic Acid Industry Revenue Share (%), by Country 2024 & 2032
- Figure 70: South America Hydroxypropionic Acid Industry Volume Share (%), by Country 2024 & 2032
- Figure 71: Middle East and Africa Hydroxypropionic Acid Industry Revenue (Million), by Product 2024 & 2032
- Figure 72: Middle East and Africa Hydroxypropionic Acid Industry Volume (K Tons), by Product 2024 & 2032
- Figure 73: Middle East and Africa Hydroxypropionic Acid Industry Revenue Share (%), by Product 2024 & 2032
- Figure 74: Middle East and Africa Hydroxypropionic Acid Industry Volume Share (%), by Product 2024 & 2032
- Figure 75: Middle East and Africa Hydroxypropionic Acid Industry Revenue (Million), by Application 2024 & 2032
- Figure 76: Middle East and Africa Hydroxypropionic Acid Industry Volume (K Tons), by Application 2024 & 2032
- Figure 77: Middle East and Africa Hydroxypropionic Acid Industry Revenue Share (%), by Application 2024 & 2032
- Figure 78: Middle East and Africa Hydroxypropionic Acid Industry Volume Share (%), by Application 2024 & 2032
- Figure 79: Middle East and Africa Hydroxypropionic Acid Industry Revenue (Million), by Country 2024 & 2032
- Figure 80: Middle East and Africa Hydroxypropionic Acid Industry Volume (K Tons), by Country 2024 & 2032
- Figure 81: Middle East and Africa Hydroxypropionic Acid Industry Revenue Share (%), by Country 2024 & 2032
- Figure 82: Middle East and Africa Hydroxypropionic Acid Industry Volume Share (%), by Country 2024 & 2032
List of Tables
- Table 1: Global Hydroxypropionic Acid Industry Revenue Million Forecast, by Region 2019 & 2032
- Table 2: Global Hydroxypropionic Acid Industry Volume K Tons Forecast, by Region 2019 & 2032
- Table 3: Global Hydroxypropionic Acid Industry Revenue Million Forecast, by Product 2019 & 2032
- Table 4: Global Hydroxypropionic Acid Industry Volume K Tons Forecast, by Product 2019 & 2032
- Table 5: Global Hydroxypropionic Acid Industry Revenue Million Forecast, by Application 2019 & 2032
- Table 6: Global Hydroxypropionic Acid Industry Volume K Tons Forecast, by Application 2019 & 2032
- Table 7: Global Hydroxypropionic Acid Industry Revenue Million Forecast, by Region 2019 & 2032
- Table 8: Global Hydroxypropionic Acid Industry Volume K Tons Forecast, by Region 2019 & 2032
- Table 9: Global Hydroxypropionic Acid Industry Revenue Million Forecast, by Country 2019 & 2032
- Table 10: Global Hydroxypropionic Acid Industry Volume K Tons Forecast, by Country 2019 & 2032
- Table 11: United States Hydroxypropionic Acid Industry Revenue (Million) Forecast, by Application 2019 & 2032
- Table 12: United States Hydroxypropionic Acid Industry Volume (K Tons) Forecast, by Application 2019 & 2032
- Table 13: Canada Hydroxypropionic Acid Industry Revenue (Million) Forecast, by Application 2019 & 2032
- Table 14: Canada Hydroxypropionic Acid Industry Volume (K Tons) Forecast, by Application 2019 & 2032
- Table 15: Mexico Hydroxypropionic Acid Industry Revenue (Million) Forecast, by Application 2019 & 2032
- Table 16: Mexico Hydroxypropionic Acid Industry Volume (K Tons) Forecast, by Application 2019 & 2032
- Table 17: Global Hydroxypropionic Acid Industry Revenue Million Forecast, by Country 2019 & 2032
- Table 18: Global Hydroxypropionic Acid Industry Volume K Tons Forecast, by Country 2019 & 2032
- Table 19: Germany Hydroxypropionic Acid Industry Revenue (Million) Forecast, by Application 2019 & 2032
- Table 20: Germany Hydroxypropionic Acid Industry Volume (K Tons) Forecast, by Application 2019 & 2032
- Table 21: France Hydroxypropionic Acid Industry Revenue (Million) Forecast, by Application 2019 & 2032
- Table 22: France Hydroxypropionic Acid Industry Volume (K Tons) Forecast, by Application 2019 & 2032
- Table 23: Italy Hydroxypropionic Acid Industry Revenue (Million) Forecast, by Application 2019 & 2032
- Table 24: Italy Hydroxypropionic Acid Industry Volume (K Tons) Forecast, by Application 2019 & 2032
- Table 25: United Kingdom Hydroxypropionic Acid Industry Revenue (Million) Forecast, by Application 2019 & 2032
- Table 26: United Kingdom Hydroxypropionic Acid Industry Volume (K Tons) Forecast, by Application 2019 & 2032
- Table 27: Netherlands Hydroxypropionic Acid Industry Revenue (Million) Forecast, by Application 2019 & 2032
- Table 28: Netherlands Hydroxypropionic Acid Industry Volume (K Tons) Forecast, by Application 2019 & 2032
- Table 29: Rest of Europe Hydroxypropionic Acid Industry Revenue (Million) Forecast, by Application 2019 & 2032
- Table 30: Rest of Europe Hydroxypropionic Acid Industry Volume (K Tons) Forecast, by Application 2019 & 2032
- Table 31: Global Hydroxypropionic Acid Industry Revenue Million Forecast, by Country 2019 & 2032
- Table 32: Global Hydroxypropionic Acid Industry Volume K Tons Forecast, by Country 2019 & 2032
- Table 33: China Hydroxypropionic Acid Industry Revenue (Million) Forecast, by Application 2019 & 2032
- Table 34: China Hydroxypropionic Acid Industry Volume (K Tons) Forecast, by Application 2019 & 2032
- Table 35: Japan Hydroxypropionic Acid Industry Revenue (Million) Forecast, by Application 2019 & 2032
- Table 36: Japan Hydroxypropionic Acid Industry Volume (K Tons) Forecast, by Application 2019 & 2032
- Table 37: India Hydroxypropionic Acid Industry Revenue (Million) Forecast, by Application 2019 & 2032
- Table 38: India Hydroxypropionic Acid Industry Volume (K Tons) Forecast, by Application 2019 & 2032
- Table 39: South Korea Hydroxypropionic Acid Industry Revenue (Million) Forecast, by Application 2019 & 2032
- Table 40: South Korea Hydroxypropionic Acid Industry Volume (K Tons) Forecast, by Application 2019 & 2032
- Table 41: Taiwan Hydroxypropionic Acid Industry Revenue (Million) Forecast, by Application 2019 & 2032
- Table 42: Taiwan Hydroxypropionic Acid Industry Volume (K Tons) Forecast, by Application 2019 & 2032
- Table 43: Australia Hydroxypropionic Acid Industry Revenue (Million) Forecast, by Application 2019 & 2032
- Table 44: Australia Hydroxypropionic Acid Industry Volume (K Tons) Forecast, by Application 2019 & 2032
- Table 45: Rest of Asia-Pacific Hydroxypropionic Acid Industry Revenue (Million) Forecast, by Application 2019 & 2032
- Table 46: Rest of Asia-Pacific Hydroxypropionic Acid Industry Volume (K Tons) Forecast, by Application 2019 & 2032
- Table 47: Global Hydroxypropionic Acid Industry Revenue Million Forecast, by Country 2019 & 2032
- Table 48: Global Hydroxypropionic Acid Industry Volume K Tons Forecast, by Country 2019 & 2032
- Table 49: Brazil Hydroxypropionic Acid Industry Revenue (Million) Forecast, by Application 2019 & 2032
- Table 50: Brazil Hydroxypropionic Acid Industry Volume (K Tons) Forecast, by Application 2019 & 2032
- Table 51: Argentina Hydroxypropionic Acid Industry Revenue (Million) Forecast, by Application 2019 & 2032
- Table 52: Argentina Hydroxypropionic Acid Industry Volume (K Tons) Forecast, by Application 2019 & 2032
- Table 53: Rest of South America Hydroxypropionic Acid Industry Revenue (Million) Forecast, by Application 2019 & 2032
- Table 54: Rest of South America Hydroxypropionic Acid Industry Volume (K Tons) Forecast, by Application 2019 & 2032
- Table 55: Global Hydroxypropionic Acid Industry Revenue Million Forecast, by Country 2019 & 2032
- Table 56: Global Hydroxypropionic Acid Industry Volume K Tons Forecast, by Country 2019 & 2032
- Table 57: Middle East Hydroxypropionic Acid Industry Revenue (Million) Forecast, by Application 2019 & 2032
- Table 58: Middle East Hydroxypropionic Acid Industry Volume (K Tons) Forecast, by Application 2019 & 2032
- Table 59: Africa Hydroxypropionic Acid Industry Revenue (Million) Forecast, by Application 2019 & 2032
- Table 60: Africa Hydroxypropionic Acid Industry Volume (K Tons) Forecast, by Application 2019 & 2032
- Table 61: Global Hydroxypropionic Acid Industry Revenue Million Forecast, by Product 2019 & 2032
- Table 62: Global Hydroxypropionic Acid Industry Volume K Tons Forecast, by Product 2019 & 2032
- Table 63: Global Hydroxypropionic Acid Industry Revenue Million Forecast, by Application 2019 & 2032
- Table 64: Global Hydroxypropionic Acid Industry Volume K Tons Forecast, by Application 2019 & 2032
- Table 65: Global Hydroxypropionic Acid Industry Revenue Million Forecast, by Country 2019 & 2032
- Table 66: Global Hydroxypropionic Acid Industry Volume K Tons Forecast, by Country 2019 & 2032
- Table 67: China Hydroxypropionic Acid Industry Revenue (Million) Forecast, by Application 2019 & 2032
- Table 68: China Hydroxypropionic Acid Industry Volume (K Tons) Forecast, by Application 2019 & 2032
- Table 69: India Hydroxypropionic Acid Industry Revenue (Million) Forecast, by Application 2019 & 2032
- Table 70: India Hydroxypropionic Acid Industry Volume (K Tons) Forecast, by Application 2019 & 2032
- Table 71: Japan Hydroxypropionic Acid Industry Revenue (Million) Forecast, by Application 2019 & 2032
- Table 72: Japan Hydroxypropionic Acid Industry Volume (K Tons) Forecast, by Application 2019 & 2032
- Table 73: South Korea Hydroxypropionic Acid Industry Revenue (Million) Forecast, by Application 2019 & 2032
- Table 74: South Korea Hydroxypropionic Acid Industry Volume (K Tons) Forecast, by Application 2019 & 2032
- Table 75: Rest of Asia Pacific Hydroxypropionic Acid Industry Revenue (Million) Forecast, by Application 2019 & 2032
- Table 76: Rest of Asia Pacific Hydroxypropionic Acid Industry Volume (K Tons) Forecast, by Application 2019 & 2032
- Table 77: Global Hydroxypropionic Acid Industry Revenue Million Forecast, by Product 2019 & 2032
- Table 78: Global Hydroxypropionic Acid Industry Volume K Tons Forecast, by Product 2019 & 2032
- Table 79: Global Hydroxypropionic Acid Industry Revenue Million Forecast, by Application 2019 & 2032
- Table 80: Global Hydroxypropionic Acid Industry Volume K Tons Forecast, by Application 2019 & 2032
- Table 81: Global Hydroxypropionic Acid Industry Revenue Million Forecast, by Country 2019 & 2032
- Table 82: Global Hydroxypropionic Acid Industry Volume K Tons Forecast, by Country 2019 & 2032
- Table 83: United States Hydroxypropionic Acid Industry Revenue (Million) Forecast, by Application 2019 & 2032
- Table 84: United States Hydroxypropionic Acid Industry Volume (K Tons) Forecast, by Application 2019 & 2032
- Table 85: Canada Hydroxypropionic Acid Industry Revenue (Million) Forecast, by Application 2019 & 2032
- Table 86: Canada Hydroxypropionic Acid Industry Volume (K Tons) Forecast, by Application 2019 & 2032
- Table 87: Mexico Hydroxypropionic Acid Industry Revenue (Million) Forecast, by Application 2019 & 2032
- Table 88: Mexico Hydroxypropionic Acid Industry Volume (K Tons) Forecast, by Application 2019 & 2032
- Table 89: Global Hydroxypropionic Acid Industry Revenue Million Forecast, by Product 2019 & 2032
- Table 90: Global Hydroxypropionic Acid Industry Volume K Tons Forecast, by Product 2019 & 2032
- Table 91: Global Hydroxypropionic Acid Industry Revenue Million Forecast, by Application 2019 & 2032
- Table 92: Global Hydroxypropionic Acid Industry Volume K Tons Forecast, by Application 2019 & 2032
- Table 93: Global Hydroxypropionic Acid Industry Revenue Million Forecast, by Country 2019 & 2032
- Table 94: Global Hydroxypropionic Acid Industry Volume K Tons Forecast, by Country 2019 & 2032
- Table 95: Germany Hydroxypropionic Acid Industry Revenue (Million) Forecast, by Application 2019 & 2032
- Table 96: Germany Hydroxypropionic Acid Industry Volume (K Tons) Forecast, by Application 2019 & 2032
- Table 97: United Kingdom Hydroxypropionic Acid Industry Revenue (Million) Forecast, by Application 2019 & 2032
- Table 98: United Kingdom Hydroxypropionic Acid Industry Volume (K Tons) Forecast, by Application 2019 & 2032
- Table 99: France Hydroxypropionic Acid Industry Revenue (Million) Forecast, by Application 2019 & 2032
- Table 100: France Hydroxypropionic Acid Industry Volume (K Tons) Forecast, by Application 2019 & 2032
- Table 101: Italy Hydroxypropionic Acid Industry Revenue (Million) Forecast, by Application 2019 & 2032
- Table 102: Italy Hydroxypropionic Acid Industry Volume (K Tons) Forecast, by Application 2019 & 2032
- Table 103: Rest of Europe Hydroxypropionic Acid Industry Revenue (Million) Forecast, by Application 2019 & 2032
- Table 104: Rest of Europe Hydroxypropionic Acid Industry Volume (K Tons) Forecast, by Application 2019 & 2032
- Table 105: Global Hydroxypropionic Acid Industry Revenue Million Forecast, by Product 2019 & 2032
- Table 106: Global Hydroxypropionic Acid Industry Volume K Tons Forecast, by Product 2019 & 2032
- Table 107: Global Hydroxypropionic Acid Industry Revenue Million Forecast, by Application 2019 & 2032
- Table 108: Global Hydroxypropionic Acid Industry Volume K Tons Forecast, by Application 2019 & 2032
- Table 109: Global Hydroxypropionic Acid Industry Revenue Million Forecast, by Country 2019 & 2032
- Table 110: Global Hydroxypropionic Acid Industry Volume K Tons Forecast, by Country 2019 & 2032
- Table 111: Brazil Hydroxypropionic Acid Industry Revenue (Million) Forecast, by Application 2019 & 2032
- Table 112: Brazil Hydroxypropionic Acid Industry Volume (K Tons) Forecast, by Application 2019 & 2032
- Table 113: Argentina Hydroxypropionic Acid Industry Revenue (Million) Forecast, by Application 2019 & 2032
- Table 114: Argentina Hydroxypropionic Acid Industry Volume (K Tons) Forecast, by Application 2019 & 2032
- Table 115: Rest of South America Hydroxypropionic Acid Industry Revenue (Million) Forecast, by Application 2019 & 2032
- Table 116: Rest of South America Hydroxypropionic Acid Industry Volume (K Tons) Forecast, by Application 2019 & 2032
- Table 117: Global Hydroxypropionic Acid Industry Revenue Million Forecast, by Product 2019 & 2032
- Table 118: Global Hydroxypropionic Acid Industry Volume K Tons Forecast, by Product 2019 & 2032
- Table 119: Global Hydroxypropionic Acid Industry Revenue Million Forecast, by Application 2019 & 2032
- Table 120: Global Hydroxypropionic Acid Industry Volume K Tons Forecast, by Application 2019 & 2032
- Table 121: Global Hydroxypropionic Acid Industry Revenue Million Forecast, by Country 2019 & 2032
- Table 122: Global Hydroxypropionic Acid Industry Volume K Tons Forecast, by Country 2019 & 2032
- Table 123: Saudi Arabia Hydroxypropionic Acid Industry Revenue (Million) Forecast, by Application 2019 & 2032
- Table 124: Saudi Arabia Hydroxypropionic Acid Industry Volume (K Tons) Forecast, by Application 2019 & 2032
- Table 125: South Africa Hydroxypropionic Acid Industry Revenue (Million) Forecast, by Application 2019 & 2032
- Table 126: South Africa Hydroxypropionic Acid Industry Volume (K Tons) Forecast, by Application 2019 & 2032
- Table 127: Rest of Middle East and Africa Hydroxypropionic Acid Industry Revenue (Million) Forecast, by Application 2019 & 2032
- Table 128: Rest of Middle East and Africa Hydroxypropionic Acid Industry Volume (K Tons) Forecast, by Application 2019 & 2032
Frequently Asked Questions
1. What is the projected Compound Annual Growth Rate (CAGR) of the Hydroxypropionic Acid Industry?
The projected CAGR is approximately 7.1%.
2. Which companies are prominent players in the Hydroxypropionic Acid Industry?
Key companies in the market include Toronto Research Chemicals Inc , Novozymes, Sigma-Aldrich, Cayman Chemical Company, Cargill, TCI N V, BASF SE, Dalton Research Molecules, Spectrum Chemical Manufacturing Corp, Alfa Aesar (Thermo Fisher Scientific), SynQuest Laboratories, Capot chemical, Oakwood Products Inc.
3. What are the main segments of the Hydroxypropionic Acid Industry?
The market segments include Product, Application.
4. Can you provide details about the market size?
The market size is estimated to be USD 198 Million as of 2022.
5. What are some drivers contributing to market growth?
; Growing Demand from Paints and Coatings Sector; Other Drivers.
6. What are the notable trends driving market growth?
Paints and Coatings Sector to Dominate the Market.
7. Are there any restraints impacting market growth?
; Unfavorable Conditions Arising Due to COVID-19 Outbreak; Other Restraints.
8. Can you provide examples of recent developments in the market?
N/A
9. What pricing options are available for accessing the report?
Pricing options include single-user, multi-user, and enterprise licenses priced at USD 4750, USD 5250, and USD 8750 respectively.
10. Is the market size provided in terms of value or volume?
The market size is provided in terms of value, measured in Million and volume, measured in K Tons.
11. Are there any specific market keywords associated with the report?
Yes, the market keyword associated with the report is "Hydroxypropionic Acid Industry," which aids in identifying and referencing the specific market segment covered.
12. How do I determine which pricing option suits my needs best?
The pricing options vary based on user requirements and access needs. Individual users may opt for single-user licenses, while businesses requiring broader access may choose multi-user or enterprise licenses for cost-effective access to the report.
13. Are there any additional resources or data provided in the Hydroxypropionic Acid Industry report?
While the report offers comprehensive insights, it's advisable to review the specific contents or supplementary materials provided to ascertain if additional resources or data are available.
14. How can I stay updated on further developments or reports in the Hydroxypropionic Acid Industry?
To stay informed about further developments, trends, and reports in the Hydroxypropionic Acid Industry, consider subscribing to industry newsletters, following relevant companies and organizations, or regularly checking reputable industry news sources and publications.
Methodology
Step 1 - Identification of Relevant Samples Size from Population Database


Step 2 - Approaches for Defining Global Market Size (Value, Volume* & Price*)

Note*: In applicable scenarios
Step 3 - Data Sources
Primary Research
- Web Analytics
- Survey Reports
- Research Institute
- Latest Research Reports
- Opinion Leaders
Secondary Research
- Annual Reports
- White Paper
- Latest Press Release
- Industry Association
- Paid Database
- Investor Presentations

Step 4 - Data Triangulation
Involves using different sources of information in order to increase the validity of a study
These sources are likely to be stakeholders in a program - participants, other researchers, program staff, other community members, and so on.
Then we put all data in single framework & apply various statistical tools to find out the dynamic on the market.
During the analysis stage, feedback from the stakeholder groups would be compared to determine areas of agreement as well as areas of divergence


