Key Insights
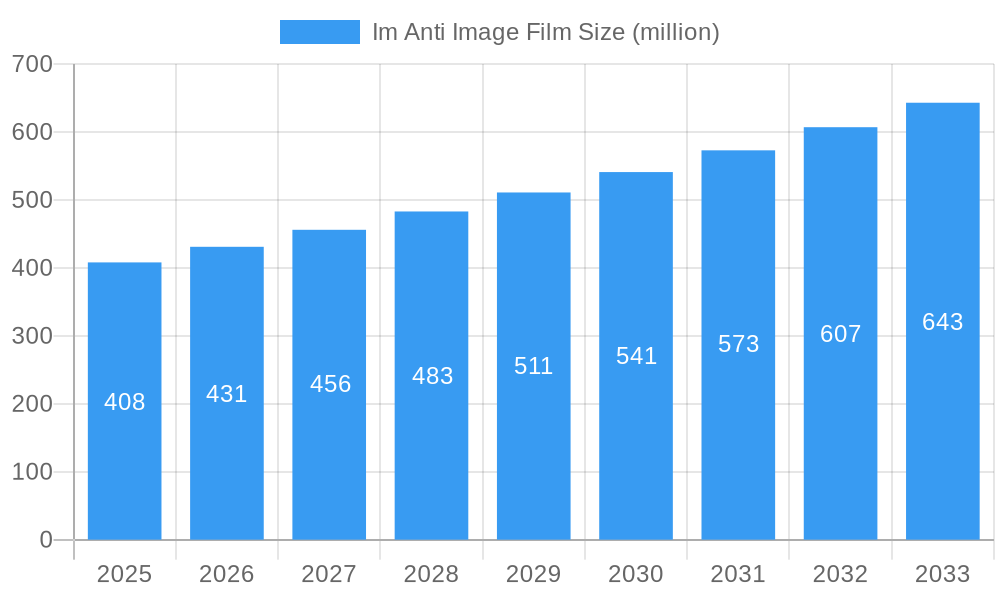
The Im Anti-Image Film market is poised for robust growth, projected to reach approximately $408 million by 2025. This expansion is driven by an estimated Compound Annual Growth Rate (CAGR) of 5.9% over the forecast period of 2025-2033. A primary driver for this upward trajectory is the escalating demand from the consumer electronics sector, where advancements in display technologies for smartphones, tablets, and televisions necessitate high-performance anti-image films to enhance visual clarity and reduce glare. Furthermore, the automotive industry's increasing adoption of advanced display systems, including in-dash navigation, digital instrument clusters, and heads-up displays (HUDs), is a significant contributor to market expansion. These applications demand films that can effectively mitigate reflections and improve readability in various lighting conditions, thus elevating the overall user experience. The continuous innovation in material science and manufacturing processes is also contributing to the development of more efficient and cost-effective anti-image films, further fueling market adoption.
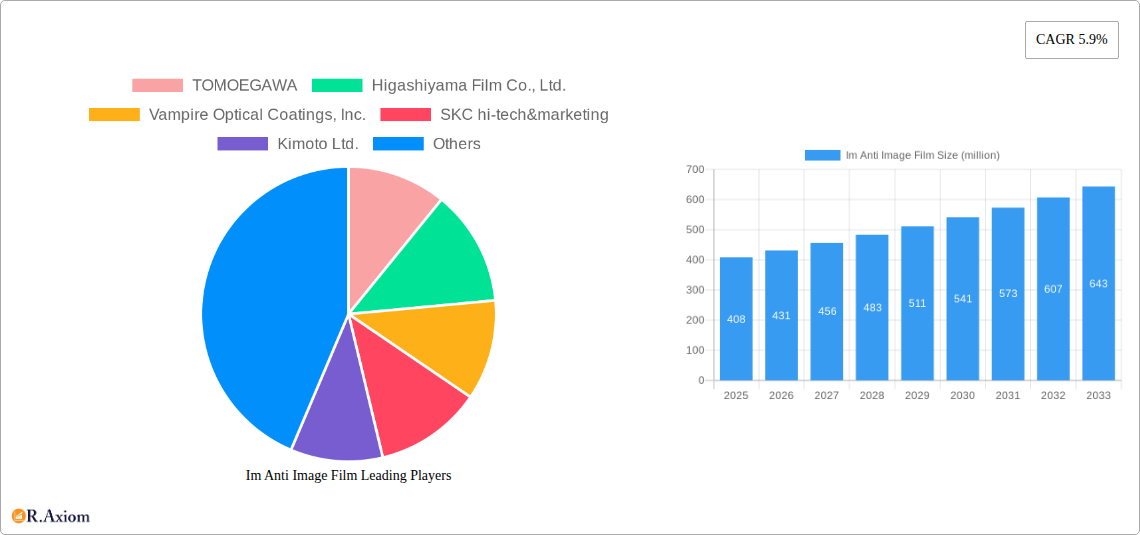
Im Anti Image Film Market Size (In Million)
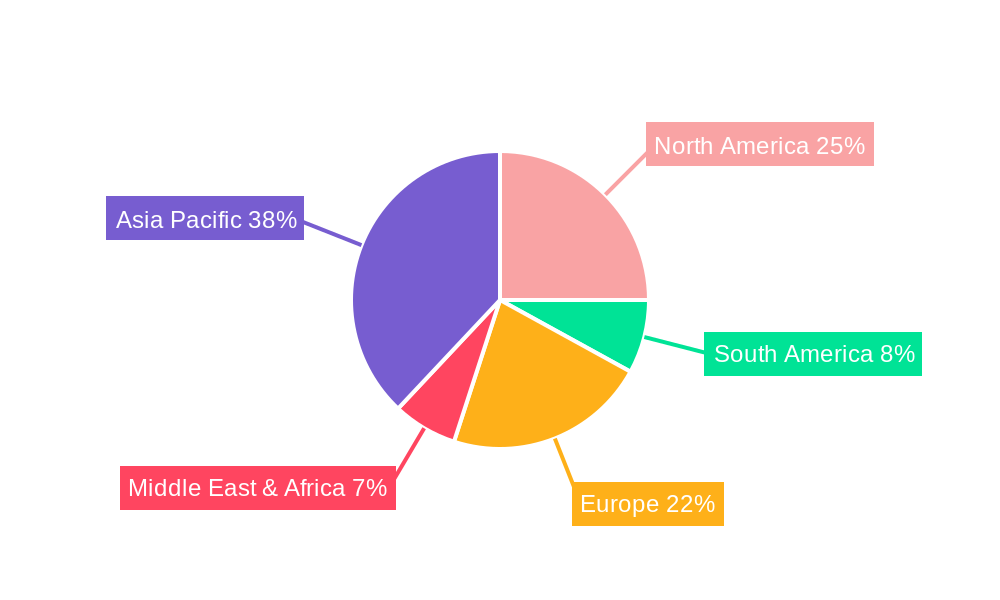
The market is segmented into Low Reflectivity Type and High Transmittance Type, both catering to specific performance needs across diverse applications. The "Low Reflectivity Type" is crucial for environments where minimizing ambient light reflection is paramount, while the "High Transmittance Type" ensures minimal loss of light intensity, vital for maintaining display brightness and power efficiency. Geographically, the Asia Pacific region, led by China and Japan, is expected to dominate the market share due to its strong manufacturing base in consumer electronics and automotive sectors, coupled with significant investments in technological advancements. North America and Europe are also substantial markets, driven by the adoption of premium electronic devices and advanced automotive features. While the market exhibits strong growth potential, potential restraints could include the fluctuating costs of raw materials and the development of alternative display technologies that inherently reduce the need for such films. However, the increasing complexity and sophistication of modern electronic displays are likely to outweigh these challenges, ensuring sustained demand for advanced anti-image film solutions.
Im Anti Image Film Company Market Share
Im Anti Image Film Market Concentration & Innovation
The Im Anti Image Film market exhibits a moderate level of concentration, with a handful of key players like TOMOEGAWA, Higashiyama Film Co., Ltd., Vampire Optical Coatings, Inc., SKC hi-tech&marketing, Kimoto Ltd., and Token Group holding significant market share, estimated to be in the hundreds of millions. Innovation is a primary driver, fueled by advancements in optical coating technologies and material science. Companies are continuously investing in R&D to develop films with superior anti-reflective properties and enhanced durability. Regulatory frameworks are generally supportive, focusing on material safety and environmental impact. However, the availability of product substitutes, such as advanced glass coatings or alternative display technologies, presents a continuous challenge. End-user trends are shifting towards higher performance and more visually appealing displays, driving demand for premium anti-image films. Mergers and acquisitions (M&A) activity, with deal values potentially reaching hundreds of millions, are observed as companies seek to expand their product portfolios, gain market access, and achieve economies of scale. For instance, a strategic acquisition by one of the major players could instantly shift market dynamics by hundreds of millions in terms of revenue.
Im Anti Image Film Industry Trends & Insights
The Im Anti Image Film industry is poised for robust growth, driven by an escalating demand for advanced visual display solutions across a multitude of sectors. The market is projected to witness a Compound Annual Growth Rate (CAGR) of approximately xx%, reflecting a sustained upward trajectory throughout the forecast period of 2025–2033. This expansion is underpinned by several key market growth drivers. The burgeoning consumer electronics sector, particularly the proliferation of smartphones, tablets, and high-definition televisions, necessitates films that minimize glare and enhance image clarity, contributing significantly to market penetration, which is expected to reach millions of units annually. Technological disruptions, including advancements in nanotechnology for more effective anti-reflective coatings and the development of self-healing properties in films, are further propelling the industry forward. Consumer preferences are increasingly leaning towards immersive viewing experiences, with a demand for screens that offer superior contrast ratios and reduced eye strain. This trend directly translates into a higher adoption rate for high-performance anti-image films. The competitive landscape is characterized by intense innovation and strategic collaborations, as companies vie to capture market share. The integration of these films into automotive displays, for instance, is another significant trend, offering drivers enhanced visibility and a more sophisticated in-car experience, with market penetration in this segment also expected to reach millions of dollars. Furthermore, the increasing use of anti-image films in industrial and medical displays, where precise visual representation is critical, adds another layer of growth. The overall market penetration of anti-image films, encompassing all applications, is estimated to be in the hundreds of millions of square meters, with consistent growth projected over the study period.
Dominant Markets & Segments in Im Anti Image Film
The Im Anti Image Film market is significantly shaped by its dominant application in Consumer Electronics. This segment is projected to continue its reign throughout the forecast period, driven by the ubiquitous nature of smartphones, tablets, laptops, and high-definition televisions, with an estimated market size in the hundreds of millions of dollars. The relentless consumer demand for visually superior and glare-free devices fuels the adoption of advanced anti-image films. Key drivers within this segment include economic policies that support consumer spending on electronics and the continuous innovation in display technologies that necessitate enhanced optical solutions. The Automobile sector is emerging as a rapidly growing segment, with an estimated market size also reaching hundreds of millions. The increasing integration of sophisticated infotainment systems, digital dashboards, and heads-up displays (HUDs) in vehicles requires robust anti-image films to ensure driver safety and enhance the overall user experience. Infrastructure development in smart cities and the automotive industry's push towards autonomous driving further bolster this trend. Geographically, Asia Pacific, particularly China, South Korea, and Japan, represents the dominant market for Im Anti Image Films. This dominance is attributed to the region's strong manufacturing base for consumer electronics and automotive components, coupled with substantial investments in research and development, leading to market sizes in the hundreds of millions for the region.
Within the Type segmentation, the Low Reflectivity Type is currently the dominant category, with an estimated market share in the hundreds of millions. This is directly linked to its broad applicability in consumer electronics and automotive displays where minimizing reflections is paramount for visual comfort and performance. However, the High Transmittance Type is experiencing significant growth, driven by applications demanding both low reflectivity and maximum light transmission, such as augmented reality (AR) and virtual reality (VR) devices, as well as advanced medical imaging equipment. The market size for this type is also in the hundreds of millions and is expected to expand considerably. The "Others" segment, encompassing specialized applications in aerospace, defense, and industrial instrumentation, while smaller in market size (in the tens of millions), offers niche growth opportunities due to stringent performance requirements.
Im Anti Image Film Product Developments
Product developments in the Im Anti Image Film market are characterized by a relentless pursuit of enhanced optical performance and durability. Innovations focus on multi-layer coatings that achieve ultra-low reflectivity across a broad spectrum of light, catering to the increasing demand for visually stunning displays. Furthermore, advancements in material science are leading to the development of self-healing and scratch-resistant films, extending product lifespan and reducing maintenance costs. These product innovations provide a significant competitive advantage, enabling manufacturers to offer solutions that meet the evolving needs of the consumer electronics and automotive industries. The market is witnessing the introduction of thinner yet more effective films, optimizing device form factors.
Report Scope & Segmentation Analysis
The Im Anti Image Film market is meticulously segmented to provide comprehensive insights. The Application segmentation includes Consumer Electronics, Automobile, and Other applications. The Consumer Electronics segment, estimated at hundreds of millions in market size, is anticipated to exhibit strong growth due to the continuous innovation in personal electronic devices. The Automobile segment, with a market size in the hundreds of millions, is also projected for significant expansion driven by advanced in-car display technologies. The "Other" applications, representing niche but high-value markets, contribute to the overall market with an estimated size in the tens of millions.
The Type segmentation comprises Low Reflectivity Type, High Transmittance Type, and Others. The Low Reflectivity Type, valued in the hundreds of millions, remains dominant, fulfilling core market needs. The High Transmittance Type, also in the hundreds of millions, is expected to experience accelerated growth due to emerging technologies like AR/VR. The "Others" type caters to specialized requirements and holds a market size in the tens of millions.
Key Drivers of Im Anti Image Film Growth
The growth of the Im Anti Image Film market is propelled by several key factors. Technologically, the relentless advancement in display technologies, including OLED, micro-LED, and flexible displays, demands films that can maintain optical clarity and reduce glare in diverse environments. Economically, the increasing disposable income globally fuels the demand for high-end consumer electronics and premium automotive features, directly benefiting the anti-image film market. Regulatory drivers, such as stricter safety standards for automotive displays and energy efficiency mandates for electronic devices, indirectly promote the adoption of high-performance optical films. For example, the drive for reduced eye strain in consumer devices can be met with improved anti-glare properties.
Challenges in the Im Anti Image Film Sector
Despite its growth potential, the Im Anti Image Film sector faces several challenges. Cost-effectiveness remains a significant hurdle, as advanced manufacturing processes for high-performance films can lead to higher production costs, potentially limiting adoption in price-sensitive markets. Supply chain disruptions, exacerbated by geopolitical factors and raw material availability, can impact production volumes and delivery timelines. Intense competition from established players and new entrants necessitates continuous innovation and competitive pricing strategies. Regulatory hurdles related to material sourcing and disposal in certain regions can also pose challenges, requiring companies to invest in compliance and sustainable practices, potentially impacting market entry and expansion with costs reaching into the millions.
Emerging Opportunities in Im Anti Image Film
The Im Anti Image Film market is ripe with emerging opportunities. The rapid growth of the Augmented Reality (AR) and Virtual Reality (VR) market presents a significant avenue for high-transmittance, low-reflectivity films, with projected market growth in the hundreds of millions. The increasing adoption of smart surfaces and interactive displays in commercial and industrial settings, such as retail and healthcare, offers new application frontiers. Furthermore, advancements in flexible and foldable display technologies for smartphones and wearables require specialized anti-image films that can withstand repeated bending without compromising performance. The drive towards sustainable and eco-friendly manufacturing processes also opens opportunities for companies offering biodegradable or recyclable film solutions.
Leading Players in the Im Anti Image Film Market
- TOMOEGAWA
- Higashiyama Film Co., Ltd.
- Vampire Optical Coatings, Inc.
- SKC hi-tech&marketing
- Kimoto Ltd.
- Token Group
Key Developments in Im Anti Image Film Industry
- 2023: Launch of advanced multi-layer anti-reflective coatings by TOMOEGAWA, significantly reducing reflection by up to xx% for consumer electronics.
- 2023: Higashiyama Film Co., Ltd. announces strategic partnership to expand its high-transmittance film production capacity by hundreds of millions of units.
- 2022: Vampire Optical Coatings, Inc. secures a major contract worth millions to supply anti-image films for a new line of automotive displays.
- 2022: SKC hi-tech&marketing introduces a new generation of scratch-resistant films with self-healing properties, enhancing product durability.
- 2021: Kimoto Ltd. acquires a smaller competitor, expanding its market reach and technological capabilities, with the deal valued in the tens of millions.
- 2021: Token Group invests millions in R&D to develop biodegradable anti-image films, aligning with sustainability trends.
Strategic Outlook for Im Anti Image Film Market
The strategic outlook for the Im Anti Image Film market is exceptionally positive, driven by continuous technological advancements and expanding application horizons. The focus will remain on developing films with superior optical performance, enhanced durability, and cost-effectiveness. Growth catalysts include the burgeoning AR/VR sector, the increasing integration of advanced displays in automobiles, and the demand for premium visual experiences in consumer electronics. Companies that invest in innovation, pursue strategic collaborations, and adapt to evolving consumer preferences and regulatory landscapes are well-positioned for sustained growth and market leadership, with projected market expansion in the hundreds of millions over the forecast period.
Im Anti Image Film Segmentation
-
1. Application
- 1.1. Consumer Electronics
- 1.2. Automobile
- 1.3. Other
-
2. Type
- 2.1. Low Reflectivity Type
- 2.2. High Transmittance Type
- 2.3. Others
Im Anti Image Film Segmentation By Geography
-
1. North America
- 1.1. United States
- 1.2. Canada
- 1.3. Mexico
-
2. South America
- 2.1. Brazil
- 2.2. Argentina
- 2.3. Rest of South America
-
3. Europe
- 3.1. United Kingdom
- 3.2. Germany
- 3.3. France
- 3.4. Italy
- 3.5. Spain
- 3.6. Russia
- 3.7. Benelux
- 3.8. Nordics
- 3.9. Rest of Europe
-
4. Middle East & Africa
- 4.1. Turkey
- 4.2. Israel
- 4.3. GCC
- 4.4. North Africa
- 4.5. South Africa
- 4.6. Rest of Middle East & Africa
-
5. Asia Pacific
- 5.1. China
- 5.2. India
- 5.3. Japan
- 5.4. South Korea
- 5.5. ASEAN
- 5.6. Oceania
- 5.7. Rest of Asia Pacific
Im Anti Image Film Regional Market Share
Geographic Coverage of Im Anti Image Film
Im Anti Image Film REPORT HIGHLIGHTS
| Aspects | Details |
|---|---|
| Study Period | 2020-2034 |
| Base Year | 2025 |
| Estimated Year | 2026 |
| Forecast Period | 2026-2034 |
| Historical Period | 2020-2025 |
| Growth Rate | CAGR of 5.9% from 2020-2034 |
| Segmentation |
|
Table of Contents
- 1. Introduction
- 1.1. Research Scope
- 1.2. Market Segmentation
- 1.3. Research Objective
- 1.4. Definitions and Assumptions
- 2. Executive Summary
- 2.1. Market Snapshot
- 3. Market Dynamics
- 3.1. Market Drivers
- 3.2. Market Restrains
- 3.3. Market Trends
- 3.4. Market Opportunities
- 4. Market Factor Analysis
- 4.1. Porters Five Forces
- 4.1.1. Bargaining Power of Suppliers
- 4.1.2. Bargaining Power of Buyers
- 4.1.3. Threat of New Entrants
- 4.1.4. Threat of Substitutes
- 4.1.5. Competitive Rivalry
- 4.2. PESTEL analysis
- 4.3. BCG Analysis
- 4.3.1. Stars (High Growth, High Market Share)
- 4.3.2. Cash Cows (Low Growth, High Market Share)
- 4.3.3. Question Mark (High Growth, Low Market Share)
- 4.3.4. Dogs (Low Growth, Low Market Share)
- 4.4. Ansoff Matrix Analysis
- 4.5. Supply Chain Analysis
- 4.6. Regulatory Landscape
- 4.7. Current Market Potential and Opportunity Assessment (TAM–SAM–SOM Framework)
- 4.8. RAX Analyst Note
- 4.1. Porters Five Forces
- 5. Market Analysis, Insights and Forecast 2021-2033
- 5.1. Market Analysis, Insights and Forecast - by Application
- 5.1.1. Consumer Electronics
- 5.1.2. Automobile
- 5.1.3. Other
- 5.2. Market Analysis, Insights and Forecast - by Type
- 5.2.1. Low Reflectivity Type
- 5.2.2. High Transmittance Type
- 5.2.3. Others
- 5.3. Market Analysis, Insights and Forecast - by Region
- 5.3.1. North America
- 5.3.2. South America
- 5.3.3. Europe
- 5.3.4. Middle East & Africa
- 5.3.5. Asia Pacific
- 5.1. Market Analysis, Insights and Forecast - by Application
- 6. Global Im Anti Image Film Analysis, Insights and Forecast, 2021-2033
- 6.1. Market Analysis, Insights and Forecast - by Application
- 6.1.1. Consumer Electronics
- 6.1.2. Automobile
- 6.1.3. Other
- 6.2. Market Analysis, Insights and Forecast - by Type
- 6.2.1. Low Reflectivity Type
- 6.2.2. High Transmittance Type
- 6.2.3. Others
- 6.1. Market Analysis, Insights and Forecast - by Application
- 7. North America Im Anti Image Film Analysis, Insights and Forecast, 2020-2032
- 7.1. Market Analysis, Insights and Forecast - by Application
- 7.1.1. Consumer Electronics
- 7.1.2. Automobile
- 7.1.3. Other
- 7.2. Market Analysis, Insights and Forecast - by Type
- 7.2.1. Low Reflectivity Type
- 7.2.2. High Transmittance Type
- 7.2.3. Others
- 7.1. Market Analysis, Insights and Forecast - by Application
- 8. South America Im Anti Image Film Analysis, Insights and Forecast, 2020-2032
- 8.1. Market Analysis, Insights and Forecast - by Application
- 8.1.1. Consumer Electronics
- 8.1.2. Automobile
- 8.1.3. Other
- 8.2. Market Analysis, Insights and Forecast - by Type
- 8.2.1. Low Reflectivity Type
- 8.2.2. High Transmittance Type
- 8.2.3. Others
- 8.1. Market Analysis, Insights and Forecast - by Application
- 9. Europe Im Anti Image Film Analysis, Insights and Forecast, 2020-2032
- 9.1. Market Analysis, Insights and Forecast - by Application
- 9.1.1. Consumer Electronics
- 9.1.2. Automobile
- 9.1.3. Other
- 9.2. Market Analysis, Insights and Forecast - by Type
- 9.2.1. Low Reflectivity Type
- 9.2.2. High Transmittance Type
- 9.2.3. Others
- 9.1. Market Analysis, Insights and Forecast - by Application
- 10. Middle East & Africa Im Anti Image Film Analysis, Insights and Forecast, 2020-2032
- 10.1. Market Analysis, Insights and Forecast - by Application
- 10.1.1. Consumer Electronics
- 10.1.2. Automobile
- 10.1.3. Other
- 10.2. Market Analysis, Insights and Forecast - by Type
- 10.2.1. Low Reflectivity Type
- 10.2.2. High Transmittance Type
- 10.2.3. Others
- 10.1. Market Analysis, Insights and Forecast - by Application
- 11. Asia Pacific Im Anti Image Film Analysis, Insights and Forecast, 2020-2032
- 11.1. Market Analysis, Insights and Forecast - by Application
- 11.1.1. Consumer Electronics
- 11.1.2. Automobile
- 11.1.3. Other
- 11.2. Market Analysis, Insights and Forecast - by Type
- 11.2.1. Low Reflectivity Type
- 11.2.2. High Transmittance Type
- 11.2.3. Others
- 11.1. Market Analysis, Insights and Forecast - by Application
- 12. Competitive Analysis
- 12.1. Company Profiles
- 12.1.1 TOMOEGAWA
- 12.1.1.1. Company Overview
- 12.1.1.2. Products
- 12.1.1.3. Company Financials
- 12.1.1.4. SWOT Analysis
- 12.1.2 Higashiyama Film Co. Ltd.
- 12.1.2.1. Company Overview
- 12.1.2.2. Products
- 12.1.2.3. Company Financials
- 12.1.2.4. SWOT Analysis
- 12.1.3 Vampire Optical Coatings Inc.
- 12.1.3.1. Company Overview
- 12.1.3.2. Products
- 12.1.3.3. Company Financials
- 12.1.3.4. SWOT Analysis
- 12.1.4 SKC hi-tech&marketing
- 12.1.4.1. Company Overview
- 12.1.4.2. Products
- 12.1.4.3. Company Financials
- 12.1.4.4. SWOT Analysis
- 12.1.5 Kimoto Ltd.
- 12.1.5.1. Company Overview
- 12.1.5.2. Products
- 12.1.5.3. Company Financials
- 12.1.5.4. SWOT Analysis
- 12.1.6 Token Group
- 12.1.6.1. Company Overview
- 12.1.6.2. Products
- 12.1.6.3. Company Financials
- 12.1.6.4. SWOT Analysis
- 12.1.1 TOMOEGAWA
- 12.2. Market Entropy
- 12.2.1 Company's Key Areas Served
- 12.2.2 Recent Developments
- 12.3. Company Market Share Analysis 2025
- 12.3.1 Top 5 Companies Market Share Analysis
- 12.3.2 Top 3 Companies Market Share Analysis
- 12.4. List of Potential Customers
- 13. Research Methodology
List of Figures
- Figure 1: Global Im Anti Image Film Revenue Breakdown (million, %) by Region 2025 & 2033
- Figure 2: Global Im Anti Image Film Volume Breakdown (K, %) by Region 2025 & 2033
- Figure 3: North America Im Anti Image Film Revenue (million), by Application 2025 & 2033
- Figure 4: North America Im Anti Image Film Volume (K), by Application 2025 & 2033
- Figure 5: North America Im Anti Image Film Revenue Share (%), by Application 2025 & 2033
- Figure 6: North America Im Anti Image Film Volume Share (%), by Application 2025 & 2033
- Figure 7: North America Im Anti Image Film Revenue (million), by Type 2025 & 2033
- Figure 8: North America Im Anti Image Film Volume (K), by Type 2025 & 2033
- Figure 9: North America Im Anti Image Film Revenue Share (%), by Type 2025 & 2033
- Figure 10: North America Im Anti Image Film Volume Share (%), by Type 2025 & 2033
- Figure 11: North America Im Anti Image Film Revenue (million), by Country 2025 & 2033
- Figure 12: North America Im Anti Image Film Volume (K), by Country 2025 & 2033
- Figure 13: North America Im Anti Image Film Revenue Share (%), by Country 2025 & 2033
- Figure 14: North America Im Anti Image Film Volume Share (%), by Country 2025 & 2033
- Figure 15: South America Im Anti Image Film Revenue (million), by Application 2025 & 2033
- Figure 16: South America Im Anti Image Film Volume (K), by Application 2025 & 2033
- Figure 17: South America Im Anti Image Film Revenue Share (%), by Application 2025 & 2033
- Figure 18: South America Im Anti Image Film Volume Share (%), by Application 2025 & 2033
- Figure 19: South America Im Anti Image Film Revenue (million), by Type 2025 & 2033
- Figure 20: South America Im Anti Image Film Volume (K), by Type 2025 & 2033
- Figure 21: South America Im Anti Image Film Revenue Share (%), by Type 2025 & 2033
- Figure 22: South America Im Anti Image Film Volume Share (%), by Type 2025 & 2033
- Figure 23: South America Im Anti Image Film Revenue (million), by Country 2025 & 2033
- Figure 24: South America Im Anti Image Film Volume (K), by Country 2025 & 2033
- Figure 25: South America Im Anti Image Film Revenue Share (%), by Country 2025 & 2033
- Figure 26: South America Im Anti Image Film Volume Share (%), by Country 2025 & 2033
- Figure 27: Europe Im Anti Image Film Revenue (million), by Application 2025 & 2033
- Figure 28: Europe Im Anti Image Film Volume (K), by Application 2025 & 2033
- Figure 29: Europe Im Anti Image Film Revenue Share (%), by Application 2025 & 2033
- Figure 30: Europe Im Anti Image Film Volume Share (%), by Application 2025 & 2033
- Figure 31: Europe Im Anti Image Film Revenue (million), by Type 2025 & 2033
- Figure 32: Europe Im Anti Image Film Volume (K), by Type 2025 & 2033
- Figure 33: Europe Im Anti Image Film Revenue Share (%), by Type 2025 & 2033
- Figure 34: Europe Im Anti Image Film Volume Share (%), by Type 2025 & 2033
- Figure 35: Europe Im Anti Image Film Revenue (million), by Country 2025 & 2033
- Figure 36: Europe Im Anti Image Film Volume (K), by Country 2025 & 2033
- Figure 37: Europe Im Anti Image Film Revenue Share (%), by Country 2025 & 2033
- Figure 38: Europe Im Anti Image Film Volume Share (%), by Country 2025 & 2033
- Figure 39: Middle East & Africa Im Anti Image Film Revenue (million), by Application 2025 & 2033
- Figure 40: Middle East & Africa Im Anti Image Film Volume (K), by Application 2025 & 2033
- Figure 41: Middle East & Africa Im Anti Image Film Revenue Share (%), by Application 2025 & 2033
- Figure 42: Middle East & Africa Im Anti Image Film Volume Share (%), by Application 2025 & 2033
- Figure 43: Middle East & Africa Im Anti Image Film Revenue (million), by Type 2025 & 2033
- Figure 44: Middle East & Africa Im Anti Image Film Volume (K), by Type 2025 & 2033
- Figure 45: Middle East & Africa Im Anti Image Film Revenue Share (%), by Type 2025 & 2033
- Figure 46: Middle East & Africa Im Anti Image Film Volume Share (%), by Type 2025 & 2033
- Figure 47: Middle East & Africa Im Anti Image Film Revenue (million), by Country 2025 & 2033
- Figure 48: Middle East & Africa Im Anti Image Film Volume (K), by Country 2025 & 2033
- Figure 49: Middle East & Africa Im Anti Image Film Revenue Share (%), by Country 2025 & 2033
- Figure 50: Middle East & Africa Im Anti Image Film Volume Share (%), by Country 2025 & 2033
- Figure 51: Asia Pacific Im Anti Image Film Revenue (million), by Application 2025 & 2033
- Figure 52: Asia Pacific Im Anti Image Film Volume (K), by Application 2025 & 2033
- Figure 53: Asia Pacific Im Anti Image Film Revenue Share (%), by Application 2025 & 2033
- Figure 54: Asia Pacific Im Anti Image Film Volume Share (%), by Application 2025 & 2033
- Figure 55: Asia Pacific Im Anti Image Film Revenue (million), by Type 2025 & 2033
- Figure 56: Asia Pacific Im Anti Image Film Volume (K), by Type 2025 & 2033
- Figure 57: Asia Pacific Im Anti Image Film Revenue Share (%), by Type 2025 & 2033
- Figure 58: Asia Pacific Im Anti Image Film Volume Share (%), by Type 2025 & 2033
- Figure 59: Asia Pacific Im Anti Image Film Revenue (million), by Country 2025 & 2033
- Figure 60: Asia Pacific Im Anti Image Film Volume (K), by Country 2025 & 2033
- Figure 61: Asia Pacific Im Anti Image Film Revenue Share (%), by Country 2025 & 2033
- Figure 62: Asia Pacific Im Anti Image Film Volume Share (%), by Country 2025 & 2033
List of Tables
- Table 1: Global Im Anti Image Film Revenue million Forecast, by Application 2020 & 2033
- Table 2: Global Im Anti Image Film Volume K Forecast, by Application 2020 & 2033
- Table 3: Global Im Anti Image Film Revenue million Forecast, by Type 2020 & 2033
- Table 4: Global Im Anti Image Film Volume K Forecast, by Type 2020 & 2033
- Table 5: Global Im Anti Image Film Revenue million Forecast, by Region 2020 & 2033
- Table 6: Global Im Anti Image Film Volume K Forecast, by Region 2020 & 2033
- Table 7: Global Im Anti Image Film Revenue million Forecast, by Application 2020 & 2033
- Table 8: Global Im Anti Image Film Volume K Forecast, by Application 2020 & 2033
- Table 9: Global Im Anti Image Film Revenue million Forecast, by Type 2020 & 2033
- Table 10: Global Im Anti Image Film Volume K Forecast, by Type 2020 & 2033
- Table 11: Global Im Anti Image Film Revenue million Forecast, by Country 2020 & 2033
- Table 12: Global Im Anti Image Film Volume K Forecast, by Country 2020 & 2033
- Table 13: United States Im Anti Image Film Revenue (million) Forecast, by Application 2020 & 2033
- Table 14: United States Im Anti Image Film Volume (K) Forecast, by Application 2020 & 2033
- Table 15: Canada Im Anti Image Film Revenue (million) Forecast, by Application 2020 & 2033
- Table 16: Canada Im Anti Image Film Volume (K) Forecast, by Application 2020 & 2033
- Table 17: Mexico Im Anti Image Film Revenue (million) Forecast, by Application 2020 & 2033
- Table 18: Mexico Im Anti Image Film Volume (K) Forecast, by Application 2020 & 2033
- Table 19: Global Im Anti Image Film Revenue million Forecast, by Application 2020 & 2033
- Table 20: Global Im Anti Image Film Volume K Forecast, by Application 2020 & 2033
- Table 21: Global Im Anti Image Film Revenue million Forecast, by Type 2020 & 2033
- Table 22: Global Im Anti Image Film Volume K Forecast, by Type 2020 & 2033
- Table 23: Global Im Anti Image Film Revenue million Forecast, by Country 2020 & 2033
- Table 24: Global Im Anti Image Film Volume K Forecast, by Country 2020 & 2033
- Table 25: Brazil Im Anti Image Film Revenue (million) Forecast, by Application 2020 & 2033
- Table 26: Brazil Im Anti Image Film Volume (K) Forecast, by Application 2020 & 2033
- Table 27: Argentina Im Anti Image Film Revenue (million) Forecast, by Application 2020 & 2033
- Table 28: Argentina Im Anti Image Film Volume (K) Forecast, by Application 2020 & 2033
- Table 29: Rest of South America Im Anti Image Film Revenue (million) Forecast, by Application 2020 & 2033
- Table 30: Rest of South America Im Anti Image Film Volume (K) Forecast, by Application 2020 & 2033
- Table 31: Global Im Anti Image Film Revenue million Forecast, by Application 2020 & 2033
- Table 32: Global Im Anti Image Film Volume K Forecast, by Application 2020 & 2033
- Table 33: Global Im Anti Image Film Revenue million Forecast, by Type 2020 & 2033
- Table 34: Global Im Anti Image Film Volume K Forecast, by Type 2020 & 2033
- Table 35: Global Im Anti Image Film Revenue million Forecast, by Country 2020 & 2033
- Table 36: Global Im Anti Image Film Volume K Forecast, by Country 2020 & 2033
- Table 37: United Kingdom Im Anti Image Film Revenue (million) Forecast, by Application 2020 & 2033
- Table 38: United Kingdom Im Anti Image Film Volume (K) Forecast, by Application 2020 & 2033
- Table 39: Germany Im Anti Image Film Revenue (million) Forecast, by Application 2020 & 2033
- Table 40: Germany Im Anti Image Film Volume (K) Forecast, by Application 2020 & 2033
- Table 41: France Im Anti Image Film Revenue (million) Forecast, by Application 2020 & 2033
- Table 42: France Im Anti Image Film Volume (K) Forecast, by Application 2020 & 2033
- Table 43: Italy Im Anti Image Film Revenue (million) Forecast, by Application 2020 & 2033
- Table 44: Italy Im Anti Image Film Volume (K) Forecast, by Application 2020 & 2033
- Table 45: Spain Im Anti Image Film Revenue (million) Forecast, by Application 2020 & 2033
- Table 46: Spain Im Anti Image Film Volume (K) Forecast, by Application 2020 & 2033
- Table 47: Russia Im Anti Image Film Revenue (million) Forecast, by Application 2020 & 2033
- Table 48: Russia Im Anti Image Film Volume (K) Forecast, by Application 2020 & 2033
- Table 49: Benelux Im Anti Image Film Revenue (million) Forecast, by Application 2020 & 2033
- Table 50: Benelux Im Anti Image Film Volume (K) Forecast, by Application 2020 & 2033
- Table 51: Nordics Im Anti Image Film Revenue (million) Forecast, by Application 2020 & 2033
- Table 52: Nordics Im Anti Image Film Volume (K) Forecast, by Application 2020 & 2033
- Table 53: Rest of Europe Im Anti Image Film Revenue (million) Forecast, by Application 2020 & 2033
- Table 54: Rest of Europe Im Anti Image Film Volume (K) Forecast, by Application 2020 & 2033
- Table 55: Global Im Anti Image Film Revenue million Forecast, by Application 2020 & 2033
- Table 56: Global Im Anti Image Film Volume K Forecast, by Application 2020 & 2033
- Table 57: Global Im Anti Image Film Revenue million Forecast, by Type 2020 & 2033
- Table 58: Global Im Anti Image Film Volume K Forecast, by Type 2020 & 2033
- Table 59: Global Im Anti Image Film Revenue million Forecast, by Country 2020 & 2033
- Table 60: Global Im Anti Image Film Volume K Forecast, by Country 2020 & 2033
- Table 61: Turkey Im Anti Image Film Revenue (million) Forecast, by Application 2020 & 2033
- Table 62: Turkey Im Anti Image Film Volume (K) Forecast, by Application 2020 & 2033
- Table 63: Israel Im Anti Image Film Revenue (million) Forecast, by Application 2020 & 2033
- Table 64: Israel Im Anti Image Film Volume (K) Forecast, by Application 2020 & 2033
- Table 65: GCC Im Anti Image Film Revenue (million) Forecast, by Application 2020 & 2033
- Table 66: GCC Im Anti Image Film Volume (K) Forecast, by Application 2020 & 2033
- Table 67: North Africa Im Anti Image Film Revenue (million) Forecast, by Application 2020 & 2033
- Table 68: North Africa Im Anti Image Film Volume (K) Forecast, by Application 2020 & 2033
- Table 69: South Africa Im Anti Image Film Revenue (million) Forecast, by Application 2020 & 2033
- Table 70: South Africa Im Anti Image Film Volume (K) Forecast, by Application 2020 & 2033
- Table 71: Rest of Middle East & Africa Im Anti Image Film Revenue (million) Forecast, by Application 2020 & 2033
- Table 72: Rest of Middle East & Africa Im Anti Image Film Volume (K) Forecast, by Application 2020 & 2033
- Table 73: Global Im Anti Image Film Revenue million Forecast, by Application 2020 & 2033
- Table 74: Global Im Anti Image Film Volume K Forecast, by Application 2020 & 2033
- Table 75: Global Im Anti Image Film Revenue million Forecast, by Type 2020 & 2033
- Table 76: Global Im Anti Image Film Volume K Forecast, by Type 2020 & 2033
- Table 77: Global Im Anti Image Film Revenue million Forecast, by Country 2020 & 2033
- Table 78: Global Im Anti Image Film Volume K Forecast, by Country 2020 & 2033
- Table 79: China Im Anti Image Film Revenue (million) Forecast, by Application 2020 & 2033
- Table 80: China Im Anti Image Film Volume (K) Forecast, by Application 2020 & 2033
- Table 81: India Im Anti Image Film Revenue (million) Forecast, by Application 2020 & 2033
- Table 82: India Im Anti Image Film Volume (K) Forecast, by Application 2020 & 2033
- Table 83: Japan Im Anti Image Film Revenue (million) Forecast, by Application 2020 & 2033
- Table 84: Japan Im Anti Image Film Volume (K) Forecast, by Application 2020 & 2033
- Table 85: South Korea Im Anti Image Film Revenue (million) Forecast, by Application 2020 & 2033
- Table 86: South Korea Im Anti Image Film Volume (K) Forecast, by Application 2020 & 2033
- Table 87: ASEAN Im Anti Image Film Revenue (million) Forecast, by Application 2020 & 2033
- Table 88: ASEAN Im Anti Image Film Volume (K) Forecast, by Application 2020 & 2033
- Table 89: Oceania Im Anti Image Film Revenue (million) Forecast, by Application 2020 & 2033
- Table 90: Oceania Im Anti Image Film Volume (K) Forecast, by Application 2020 & 2033
- Table 91: Rest of Asia Pacific Im Anti Image Film Revenue (million) Forecast, by Application 2020 & 2033
- Table 92: Rest of Asia Pacific Im Anti Image Film Volume (K) Forecast, by Application 2020 & 2033
Frequently Asked Questions
1. What is the projected Compound Annual Growth Rate (CAGR) of the Im Anti Image Film?
The projected CAGR is approximately 5.9%.
2. Which companies are prominent players in the Im Anti Image Film?
Key companies in the market include TOMOEGAWA, Higashiyama Film Co., Ltd., Vampire Optical Coatings, Inc., SKC hi-tech&marketing, Kimoto Ltd., Token Group.
3. What are the main segments of the Im Anti Image Film?
The market segments include Application, Type.
4. Can you provide details about the market size?
The market size is estimated to be USD 408 million as of 2022.
5. What are some drivers contributing to market growth?
N/A
6. What are the notable trends driving market growth?
N/A
7. Are there any restraints impacting market growth?
N/A
8. Can you provide examples of recent developments in the market?
N/A
9. What pricing options are available for accessing the report?
Pricing options include single-user, multi-user, and enterprise licenses priced at USD 3950.00, USD 5925.00, and USD 7900.00 respectively.
10. Is the market size provided in terms of value or volume?
The market size is provided in terms of value, measured in million and volume, measured in K.
11. Are there any specific market keywords associated with the report?
Yes, the market keyword associated with the report is "Im Anti Image Film," which aids in identifying and referencing the specific market segment covered.
12. How do I determine which pricing option suits my needs best?
The pricing options vary based on user requirements and access needs. Individual users may opt for single-user licenses, while businesses requiring broader access may choose multi-user or enterprise licenses for cost-effective access to the report.
13. Are there any additional resources or data provided in the Im Anti Image Film report?
While the report offers comprehensive insights, it's advisable to review the specific contents or supplementary materials provided to ascertain if additional resources or data are available.
14. How can I stay updated on further developments or reports in the Im Anti Image Film?
To stay informed about further developments, trends, and reports in the Im Anti Image Film, consider subscribing to industry newsletters, following relevant companies and organizations, or regularly checking reputable industry news sources and publications.
Methodology
Step 1 - Identification of Relevant Samples Size from Population Database


Step 2 - Approaches for Defining Global Market Size (Value, Volume* & Price*)

Note*: In applicable scenarios
Step 3 - Data Sources
Primary Research
- Web Analytics
- Survey Reports
- Research Institute
- Latest Research Reports
- Opinion Leaders
Secondary Research
- Annual Reports
- White Paper
- Latest Press Release
- Industry Association
- Paid Database
- Investor Presentations

Step 4 - Data Triangulation
Involves using different sources of information in order to increase the validity of a study
These sources are likely to be stakeholders in a program - participants, other researchers, program staff, other community members, and so on.
Then we put all data in single framework & apply various statistical tools to find out the dynamic on the market.
During the analysis stage, feedback from the stakeholder groups would be compared to determine areas of agreement as well as areas of divergence

