
Key Insights
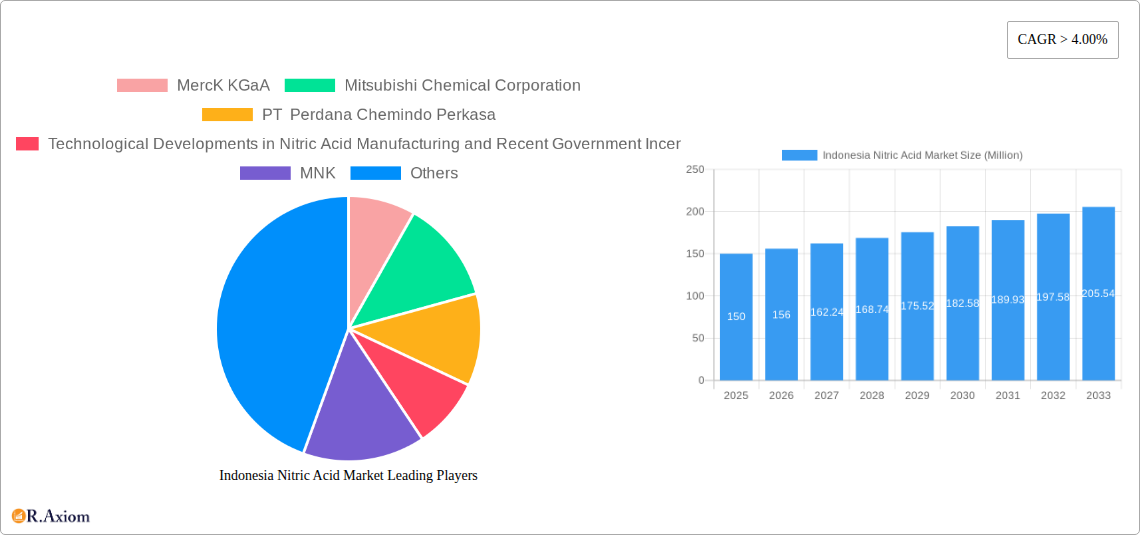
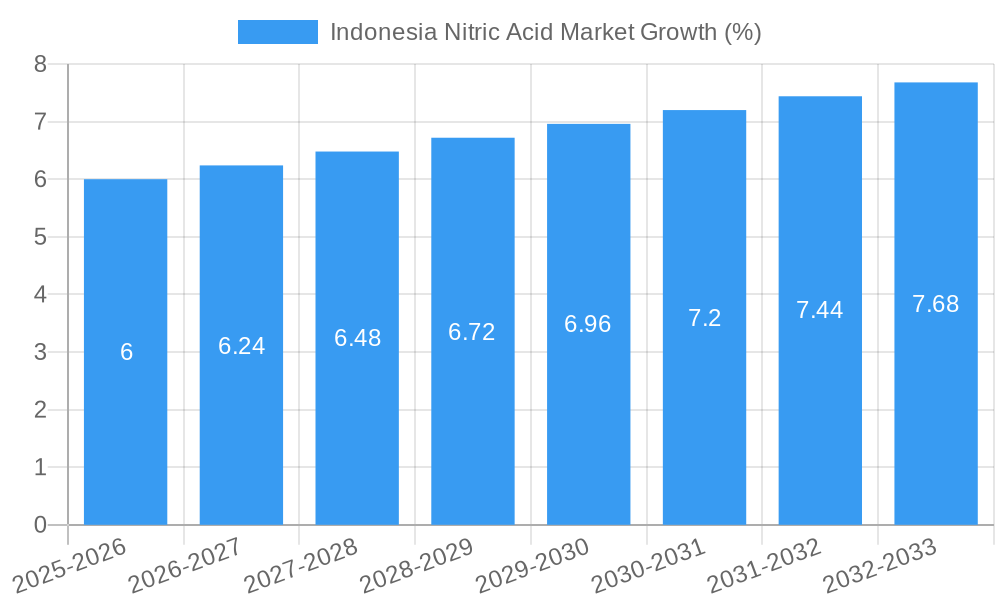
The Indonesian nitric acid market, valued at approximately $150 million in 2025, is projected to experience robust growth, exhibiting a Compound Annual Growth Rate (CAGR) exceeding 4% from 2025 to 2033. This expansion is driven by several key factors. Firstly, the burgeoning fertilizer industry in Indonesia, fueled by the nation's agricultural sector and increasing food demand, represents a significant driver. The use of nitric acid in fertilizer production constitutes a substantial portion of overall consumption. Secondly, the growth of the chemical manufacturing and explosives sectors contributes to market expansion. Increased industrial activity and infrastructure development necessitate higher nitric acid demand. Finally, government initiatives aimed at promoting domestic chemical production, including potential tax incentives or streamlined regulations, are likely to further stimulate market growth. However, challenges exist. Fluctuations in raw material prices, particularly ammonia, can impact production costs and profitability. Furthermore, stringent environmental regulations regarding emissions and waste management could pose operational constraints for manufacturers.
The market segmentation reveals fertilizers, inks, pigments, and dyes as leading end-user industries. Other significant contributors include chemical manufacturing, explosives, and various others, such as pharmaceuticals and food processing. Key players in the Indonesian nitric acid market include multinational corporations like Merck KGaA, Mitsubishi Chemical Corporation, and BASF SE, alongside significant local producers such as PT Perdana Chemindo Perkasa and MNK. These companies are actively involved in technological advancements within nitric acid manufacturing, striving for increased efficiency and reduced environmental impact. The competitive landscape is characterized by a blend of established international players and domestic companies, leading to a dynamic market with both established dominance and opportunities for growth and innovation. The forecast period of 2025-2033 presents a promising outlook for the Indonesian nitric acid market, driven by industrial growth and supportive government policies, albeit with challenges related to cost management and environmental compliance.
Indonesia Nitric Acid Market: A Comprehensive Report (2019-2033)
This comprehensive report provides an in-depth analysis of the Indonesia Nitric Acid Market, covering the period from 2019 to 2033. It offers valuable insights into market dynamics, growth drivers, challenges, and opportunities, equipping stakeholders with actionable intelligence for strategic decision-making. The report incorporates extensive data analysis, detailed segmentation, and competitive landscaping, making it an indispensable resource for industry professionals, investors, and researchers. The study period spans 2019-2033, with 2025 as the base and estimated year. The forecast period is 2025-2033, and the historical period covers 2019-2024. Expected market value (in Million) throughout the report is estimated as xx where unavailable.
Indonesia Nitric Acid Market Concentration & Innovation
The Indonesia Nitric Acid market exhibits a moderately concentrated structure, with a few dominant players like Merck KGaA, Mitsubishi Chemical Corporation, PT Perdana Chemindo Perkasa, BASF SE, and Yara holding significant market share. The exact market share for each player remains xx for this report. Innovation in the sector is driven by the need for enhanced efficiency in manufacturing processes and the development of environmentally friendly nitric acid production methods.
- Regulatory Frameworks: Indonesian government policies related to chemical manufacturing and environmental regulations significantly influence market dynamics. Stringent emission standards and safety regulations are major considerations for nitric acid producers.
- Product Substitutes: While few direct substitutes exist, the market faces indirect competition from alternative chemicals that can serve similar functions in specific applications.
- End-User Trends: Growing demand across various end-use sectors, particularly fertilizers, drives market expansion. The shift towards sustainable agricultural practices also influences the demand for nitric acid in fertilizer production.
- M&A Activities: The acquisition of PT Excel Meg Indo by UPL Ltd. in October 2021 showcases the potential for consolidation and expansion in the Indonesian agrochemical sector, indirectly impacting the nitric acid market. The value of this deal was not disclosed and is therefore marked as xx. Further M&A activity is anticipated, based on xx estimated value.
Indonesia Nitric Acid Market Industry Trends & Insights
The Indonesian Nitric Acid market is experiencing robust growth, with a projected Compound Annual Growth Rate (CAGR) of xx% during the forecast period (2025-2033). Key growth drivers include increasing demand from the fertilizer industry, expansion of chemical manufacturing activities, and rising consumption in other sectors like explosives and pharmaceuticals. Technological advancements in nitric acid manufacturing, such as the adoption of improved catalysts and energy-efficient processes, contribute to increased production efficiency and lower costs.
Consumer preferences are shifting towards sustainable and environmentally friendly products, pushing producers to adopt cleaner production methods and reduce their carbon footprint. The competitive landscape is characterized by intense competition among established players and the emergence of new entrants, leading to price pressures and the need for continuous innovation. Market penetration rates in key segments are estimated at xx%. Factors driving the industry include xx.
Dominant Markets & Segments in Indonesia Nitric Acid Market
The fertilizer segment dominates the Indonesian Nitric Acid market, accounting for xx% of the total market value in 2025. This is primarily due to Indonesia's growing agricultural sector and increasing demand for nitrogen-based fertilizers to boost crop yields.
- Key Drivers of Fertilizer Segment Dominance:
- Government support for agricultural development and fertilizer subsidies.
- Expanding cultivated land and increasing food production needs.
- Rising population and increased demand for food.
The chemical manufacturing segment also contributes significantly, followed by the explosives sector. Other end-user industries, including pharmaceuticals and food processing, exhibit moderate growth potential. Regional dominance within Indonesia is not readily available therefore the information is marked as xx.
Indonesia Nitric Acid Market Product Developments
Recent product innovations have focused on developing higher-purity nitric acid with improved handling and storage properties. The emphasis is on enhancing the efficiency and safety of nitric acid applications across various industries. Technological advancements have led to the development of more efficient production processes, reducing environmental impact and lowering costs. These innovations align with the demand for sustainable and environmentally friendly solutions.
Report Scope & Segmentation Analysis
This report segments the Indonesia Nitric Acid Market based on end-user industries:
Fertilizers: This segment exhibits the highest growth potential, driven by rising agricultural demand. Market size is xx Million in 2025, with projected growth to xx Million by 2033. Competitive dynamics are marked by intense competition among major players.
Inks, Pigments, and Dyes: This segment experiences steady growth due to expanding industrial applications. Market size and growth projections are similar to those marked in the Fertilizer segment.
Chemical Manufacturing: This segment demonstrates consistent growth, driven by demand from downstream industries. Similar growth projections apply to this segment as previous segments.
Explosives: Growth in this segment is influenced by construction and mining activities. Similar growth projections apply to this segment as previous segments.
Other End-user Industries (Pharmaceuticals, Food Processing, etc.): This segment demonstrates moderate growth potential. Similar growth projections apply to this segment as previous segments.
Key Drivers of Indonesia Nitric Acid Market Growth
The growth of the Indonesia Nitric Acid market is propelled by several factors, including:
- Rising fertilizer demand: The agricultural sector's expansion and the need to increase crop yields are primary drivers.
- Expanding chemical manufacturing: The growth of downstream chemical industries boosts nitric acid consumption.
- Government initiatives: Government policies supporting industrial development create a favorable environment for market expansion.
Challenges in the Indonesia Nitric Acid Market Sector
The Indonesia Nitric Acid market faces challenges including:
- Stringent environmental regulations: Compliance with emission standards and safety regulations adds to production costs.
- Supply chain disruptions: Global supply chain volatility can impact raw material availability and prices.
- Intense competition: Competition among established players keeps price pressures high.
Emerging Opportunities in Indonesia Nitric Acid Market
Emerging opportunities include:
- Growth in specialized applications: The demand for high-purity nitric acid in niche applications presents growth potential.
- Adoption of advanced technologies: Investing in cleaner production technologies can enhance competitiveness and reduce environmental impact.
- Expansion into new markets: Targeting new end-user sectors can broaden market reach.
Leading Players in the Indonesia Nitric Acid Market Market
- Merck KGaA
- Mitsubishi Chemical Corporation
- PT Perdana Chemindo Perkasa
- MNK
- BASF SE
- Thermo Fisher Scientific
- Hanwha Corporation
- Yara
Key Developments in Indonesia Nitric Acid Market Industry
- October 2021: UPL Ltd. acquired an 80% share in PT Excel Meg Indo, expanding its presence in the Indonesian agrochemical market.
- February 2022: Nitric Oxide nasal spray (NONS) for COVID-19 treatment, approved in Indonesia, expanded the application of nitric oxide-related products in the healthcare sector.
Strategic Outlook for Indonesia Nitric Acid Market Market
The Indonesia Nitric Acid market is poised for significant growth over the forecast period, driven by robust demand from diverse sectors and ongoing technological advancements. Companies focused on sustainable production methods and product innovation will be best positioned to capitalize on future market opportunities. Strategic partnerships, investments in R&D, and expansion into new geographical markets will be crucial for sustained success.
Indonesia Nitric Acid Market Segmentation
-
1. End-User Industry
- 1.1. Fertilizers
- 1.2. Inks, Pigments, and Dyes
- 1.3. Chemical Manufacturing
- 1.4. Explosives
- 1.5. Other
Indonesia Nitric Acid Market Segmentation By Geography
- 1. Indonesia
Indonesia Nitric Acid Market REPORT HIGHLIGHTS
| Aspects | Details |
|---|---|
| Study Period | 2019-2033 |
| Base Year | 2024 |
| Estimated Year | 2025 |
| Forecast Period | 2025-2033 |
| Historical Period | 2019-2024 |
| Growth Rate | CAGR of > 4.00% from 2019-2033 |
| Segmentation |
|
Table of Contents
- 1. Introduction
- 1.1. Research Scope
- 1.2. Market Segmentation
- 1.3. Research Methodology
- 1.4. Definitions and Assumptions
- 2. Executive Summary
- 2.1. Introduction
- 3. Market Dynamics
- 3.1. Introduction
- 3.2. Market Drivers
- 3.2.1. Increasing Demand from the Fertilizer Industry; Growth in the Food Industry
- 3.3. Market Restrains
- 3.3.1. Adverse Effects of Nitric Acid on Human Health; Other Restraints
- 3.4. Market Trends
- 3.4.1. Fertilizer Segment to Dominate the Market
- 4. Market Factor Analysis
- 4.1. Porters Five Forces
- 4.2. Supply/Value Chain
- 4.3. PESTEL analysis
- 4.4. Market Entropy
- 4.5. Patent/Trademark Analysis
- 5. Indonesia Nitric Acid Market Analysis, Insights and Forecast, 2019-2031
- 5.1. Market Analysis, Insights and Forecast - by End-User Industry
- 5.1.1. Fertilizers
- 5.1.2. Inks, Pigments, and Dyes
- 5.1.3. Chemical Manufacturing
- 5.1.4. Explosives
- 5.1.5. Other
- 5.2. Market Analysis, Insights and Forecast - by Region
- 5.2.1. Indonesia
- 5.1. Market Analysis, Insights and Forecast - by End-User Industry
- 6. Competitive Analysis
- 6.1. Market Share Analysis 2024
- 6.2. Company Profiles
- 6.2.1 MercK KGaA
- 6.2.1.1. Overview
- 6.2.1.2. Products
- 6.2.1.3. SWOT Analysis
- 6.2.1.4. Recent Developments
- 6.2.1.5. Financials (Based on Availability)
- 6.2.2 Mitsubishi Chemical Corporation
- 6.2.2.1. Overview
- 6.2.2.2. Products
- 6.2.2.3. SWOT Analysis
- 6.2.2.4. Recent Developments
- 6.2.2.5. Financials (Based on Availability)
- 6.2.3 PT Perdana Chemindo Perkasa
- 6.2.3.1. Overview
- 6.2.3.2. Products
- 6.2.3.3. SWOT Analysis
- 6.2.3.4. Recent Developments
- 6.2.3.5. Financials (Based on Availability)
- 6.2.4 Technological Developments in Nitric Acid Manufacturing and Recent Government Incentive
- 6.2.4.1. Overview
- 6.2.4.2. Products
- 6.2.4.3. SWOT Analysis
- 6.2.4.4. Recent Developments
- 6.2.4.5. Financials (Based on Availability)
- 6.2.5 MNK
- 6.2.5.1. Overview
- 6.2.5.2. Products
- 6.2.5.3. SWOT Analysis
- 6.2.5.4. Recent Developments
- 6.2.5.5. Financials (Based on Availability)
- 6.2.6 BASF SE
- 6.2.6.1. Overview
- 6.2.6.2. Products
- 6.2.6.3. SWOT Analysis
- 6.2.6.4. Recent Developments
- 6.2.6.5. Financials (Based on Availability)
- 6.2.7 Thermo Fisher Scientific
- 6.2.7.1. Overview
- 6.2.7.2. Products
- 6.2.7.3. SWOT Analysis
- 6.2.7.4. Recent Developments
- 6.2.7.5. Financials (Based on Availability)
- 6.2.8 Hanwha Corporation
- 6.2.8.1. Overview
- 6.2.8.2. Products
- 6.2.8.3. SWOT Analysis
- 6.2.8.4. Recent Developments
- 6.2.8.5. Financials (Based on Availability)
- 6.2.9 Yara
- 6.2.9.1. Overview
- 6.2.9.2. Products
- 6.2.9.3. SWOT Analysis
- 6.2.9.4. Recent Developments
- 6.2.9.5. Financials (Based on Availability)
- 6.2.1 MercK KGaA
List of Figures
- Figure 1: Indonesia Nitric Acid Market Revenue Breakdown (Million, %) by Product 2024 & 2032
- Figure 2: Indonesia Nitric Acid Market Share (%) by Company 2024
List of Tables
- Table 1: Indonesia Nitric Acid Market Revenue Million Forecast, by Region 2019 & 2032
- Table 2: Indonesia Nitric Acid Market Volume liter Forecast, by Region 2019 & 2032
- Table 3: Indonesia Nitric Acid Market Revenue Million Forecast, by End-User Industry 2019 & 2032
- Table 4: Indonesia Nitric Acid Market Volume liter Forecast, by End-User Industry 2019 & 2032
- Table 5: Indonesia Nitric Acid Market Revenue Million Forecast, by Region 2019 & 2032
- Table 6: Indonesia Nitric Acid Market Volume liter Forecast, by Region 2019 & 2032
- Table 7: Indonesia Nitric Acid Market Revenue Million Forecast, by Country 2019 & 2032
- Table 8: Indonesia Nitric Acid Market Volume liter Forecast, by Country 2019 & 2032
- Table 9: Indonesia Nitric Acid Market Revenue Million Forecast, by End-User Industry 2019 & 2032
- Table 10: Indonesia Nitric Acid Market Volume liter Forecast, by End-User Industry 2019 & 2032
- Table 11: Indonesia Nitric Acid Market Revenue Million Forecast, by Country 2019 & 2032
- Table 12: Indonesia Nitric Acid Market Volume liter Forecast, by Country 2019 & 2032
Frequently Asked Questions
1. What is the projected Compound Annual Growth Rate (CAGR) of the Indonesia Nitric Acid Market?
The projected CAGR is approximately > 4.00%.
2. Which companies are prominent players in the Indonesia Nitric Acid Market?
Key companies in the market include MercK KGaA, Mitsubishi Chemical Corporation, PT Perdana Chemindo Perkasa, Technological Developments in Nitric Acid Manufacturing and Recent Government Incentive, MNK, BASF SE, Thermo Fisher Scientific, Hanwha Corporation, Yara.
3. What are the main segments of the Indonesia Nitric Acid Market?
The market segments include End-User Industry.
4. Can you provide details about the market size?
The market size is estimated to be USD XX Million as of 2022.
5. What are some drivers contributing to market growth?
Increasing Demand from the Fertilizer Industry; Growth in the Food Industry.
6. What are the notable trends driving market growth?
Fertilizer Segment to Dominate the Market.
7. Are there any restraints impacting market growth?
Adverse Effects of Nitric Acid on Human Health; Other Restraints.
8. Can you provide examples of recent developments in the market?
February 2022: To treat COVID-19, the Indian tool-kit includes a Nitric Oxide nasal spray (NONS) from Glenmark Pharmaceuticals and SaNOtize Research & Development Corp., a Canadian pharmaceutical company. The product is also approved and sold in Indonesia, Israel, the EU, Bahrain, and Thailand.
9. What pricing options are available for accessing the report?
Pricing options include single-user, multi-user, and enterprise licenses priced at USD 3800, USD 4500, and USD 5800 respectively.
10. Is the market size provided in terms of value or volume?
The market size is provided in terms of value, measured in Million and volume, measured in liter.
11. Are there any specific market keywords associated with the report?
Yes, the market keyword associated with the report is "Indonesia Nitric Acid Market," which aids in identifying and referencing the specific market segment covered.
12. How do I determine which pricing option suits my needs best?
The pricing options vary based on user requirements and access needs. Individual users may opt for single-user licenses, while businesses requiring broader access may choose multi-user or enterprise licenses for cost-effective access to the report.
13. Are there any additional resources or data provided in the Indonesia Nitric Acid Market report?
While the report offers comprehensive insights, it's advisable to review the specific contents or supplementary materials provided to ascertain if additional resources or data are available.
14. How can I stay updated on further developments or reports in the Indonesia Nitric Acid Market?
To stay informed about further developments, trends, and reports in the Indonesia Nitric Acid Market, consider subscribing to industry newsletters, following relevant companies and organizations, or regularly checking reputable industry news sources and publications.
Methodology
Step 1 - Identification of Relevant Samples Size from Population Database


Step 2 - Approaches for Defining Global Market Size (Value, Volume* & Price*)

Note*: In applicable scenarios
Step 3 - Data Sources
Primary Research
- Web Analytics
- Survey Reports
- Research Institute
- Latest Research Reports
- Opinion Leaders
Secondary Research
- Annual Reports
- White Paper
- Latest Press Release
- Industry Association
- Paid Database
- Investor Presentations

Step 4 - Data Triangulation
Involves using different sources of information in order to increase the validity of a study
These sources are likely to be stakeholders in a program - participants, other researchers, program staff, other community members, and so on.
Then we put all data in single framework & apply various statistical tools to find out the dynamic on the market.
During the analysis stage, feedback from the stakeholder groups would be compared to determine areas of agreement as well as areas of divergence


