
Key Insights
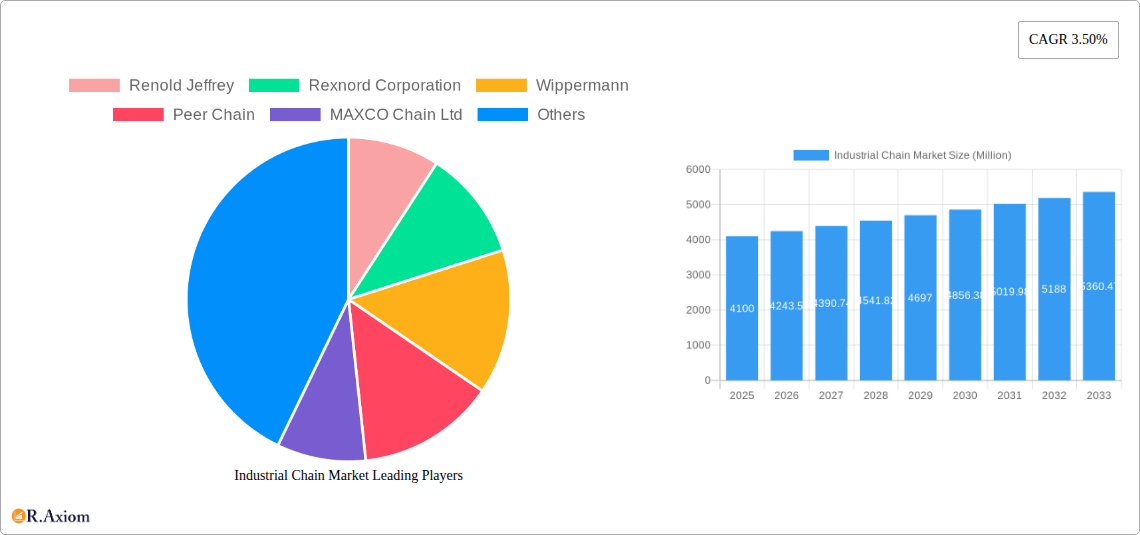
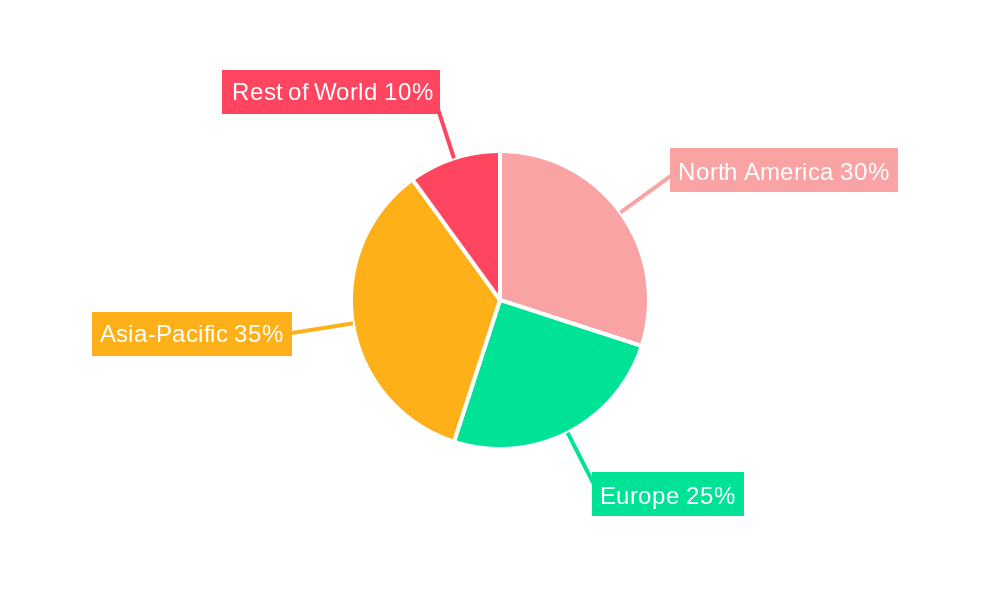
The global industrial chain market, valued at $4.10 billion in 2025, is projected to experience steady growth, driven by increasing industrial automation, rising demand across diverse sectors like automotive, construction, and agriculture, and the expanding adoption of sophisticated material handling systems. The 3.50% CAGR signifies a consistent upward trajectory, indicating sustained investment in infrastructure and manufacturing capabilities globally. While specific regional breakdowns are unavailable, it's reasonable to assume significant market shares for North America, Europe, and Asia-Pacific, reflecting the concentration of manufacturing hubs and industrial activity within these regions. Growth is likely fueled by the ongoing need for efficient and durable power transmission solutions across various industrial applications, further supported by innovations in materials science leading to improved chain strength and longevity. However, potential restraints could include fluctuating raw material prices (e.g., steel), increasing labor costs, and evolving regulatory compliance standards regarding material safety and environmental impact. The market's competitive landscape, featuring established players like Renold Jeffrey, Rexnord Corporation, and Wippermann, alongside emerging regional manufacturers, suggests ongoing innovation and strategic expansions are key to market success.
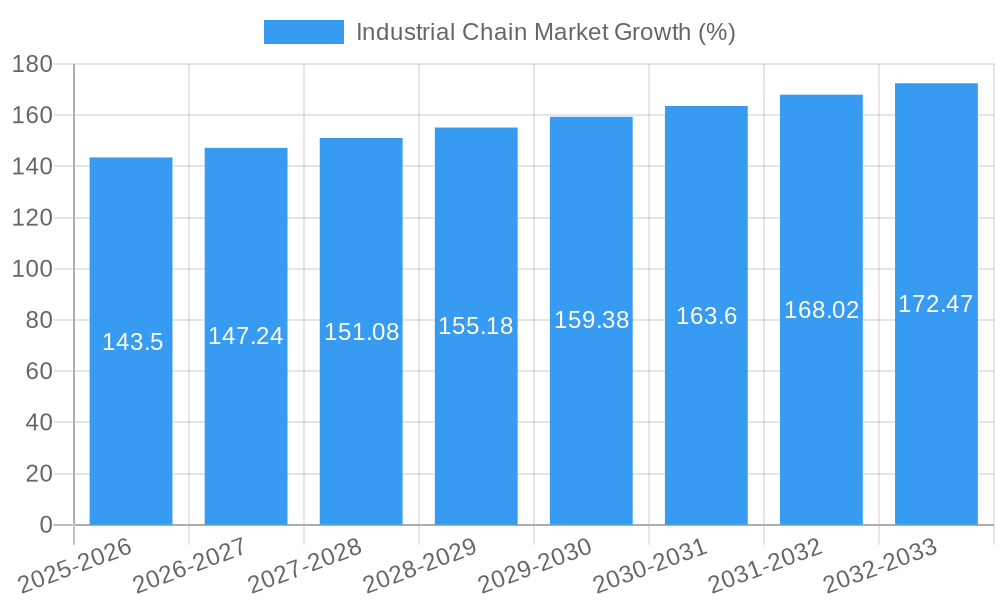
The forecast period (2025-2033) anticipates continued market expansion, particularly as emerging economies experience industrial growth. Major market players are likely to focus on strategic partnerships, product diversification (including specialized chains for niche applications), and technological advancements to maintain a competitive edge. Furthermore, sustainable manufacturing practices and the development of environmentally friendly materials are expected to become increasingly important factors influencing market dynamics, driving innovation towards more eco-conscious production processes. The market's resilience against potential economic downturns will depend on the sustained demand for industrial chains across various sectors and the adaptability of manufacturers in response to evolving market demands and technological advancements.
Industrial Chain Market: A Comprehensive Report (2019-2033)
This detailed report provides a comprehensive analysis of the Industrial Chain Market, covering market size, growth drivers, challenges, key players, and future outlook. The study period spans from 2019 to 2033, with 2025 serving as the base and estimated year. The forecast period is 2025-2033, and the historical period encompasses 2019-2024. This report is invaluable for industry stakeholders, investors, and businesses seeking to understand and capitalize on the opportunities within this dynamic market.
Industrial Chain Market Concentration & Innovation
The Industrial Chain market exhibits a moderately concentrated landscape, with several major players holding significant market share. While precise market share figures for each company are proprietary information and not publicly available for all participants, analysis indicates a top five companies hold approximately xx% of the global market in 2025. This concentration is driven by economies of scale, established distribution networks, and strong brand recognition. However, the market is also witnessing increased innovation, with companies investing in research and development to enhance product performance, efficiency, and durability. Regulatory frameworks, particularly those related to safety and environmental standards, are shaping industry practices. Substitutes, such as belt drives and geared systems, exist, but the inherent advantages of industrial chains in terms of strength, durability, and cost-effectiveness maintain their dominance across various applications. Furthermore, end-user trends toward automation and increased efficiency are fueling demand for advanced chain technologies. Mergers and acquisitions (M&A) activity within the sector remains moderate, with deal values averaging approximately xx Million USD annually in the past five years. Key M&A activities have primarily focused on expanding geographical reach or acquiring specialized technologies.
Industrial Chain Market Industry Trends & Insights
The global Industrial Chain Market is projected to experience a Compound Annual Growth Rate (CAGR) of xx% during the forecast period (2025-2033). This robust growth is fueled by several key factors. Firstly, the burgeoning manufacturing sector across developing economies is creating a significant demand for industrial chains. Simultaneously, increasing automation across various industrial segments, including automotive, food processing, and logistics, is driving the need for high-performance and specialized chains. Technological disruptions, such as the adoption of advanced materials and manufacturing processes, are leading to improvements in chain durability, efficiency, and lifespan. Consumer preferences are shifting towards longer-lasting, energy-efficient, and low-maintenance chains, influencing product development strategies. Competitive dynamics are characterized by intense rivalry amongst established players and the emergence of new entrants with specialized products or niche market focus. The market penetration rate for high-performance chains continues to rise, driven by increasing customer awareness and the willingness to invest in superior technologies that offer improved returns.
Dominant Markets & Segments in Industrial Chain Market
The Asia-Pacific region currently dominates the global Industrial Chain market, driven by rapid industrialization and significant manufacturing capacity. China, in particular, stands out as a major growth driver owing to its extensive manufacturing base and robust infrastructure development.
- Key Drivers in Asia-Pacific:
- Rapid industrialization and urbanization.
- Strong government support for infrastructure projects.
- Rising demand from automotive, construction, and consumer goods sectors.
- Lower labor costs compared to other regions.
Detailed analysis reveals that other factors like favorable government policies that incentivize industrial growth, improving infrastructure (including transportation networks that facilitate efficient delivery of products and materials), and a significant rise in automation within diverse manufacturing industries collectively contribute to the region’s leading role in the Industrial Chain Market. This dominance is further bolstered by a growing middle class and increased consumer spending, driving demand for goods whose production relies heavily on the use of industrial chains.
Industrial Chain Market Product Developments
Recent product innovations in the industrial chain market focus on enhanced durability, lightweight designs, and improved energy efficiency. The integration of advanced materials, such as high-strength alloys and polymers, is leading to chains with extended lifespans and reduced maintenance requirements. New applications are emerging in areas such as robotics, renewable energy, and advanced manufacturing, requiring specialized chain designs to address unique performance demands. These developments provide significant competitive advantages to manufacturers, allowing them to cater to the evolving needs of different industry segments and garner a larger market share. The industry displays a strong emphasis on tailoring chain designs to enhance overall machine efficiency, reducing downtime and improving overall operational costs.
Report Scope & Segmentation Analysis
This report segments the Industrial Chain market based on several key parameters. Firstly, by product type: roller chains, leaf chains, conveyor chains, and other specialized chains. Each segment exhibits different growth trajectories, influenced by factors such as application and technological advancement. The roller chain segment is currently the largest, followed by leaf chains and conveyor chains. Secondly, by end-use industry: automotive, food and beverage, material handling, logistics, and others. The automotive industry is the most significant end-user, driven by high production volumes and automation. Thirdly, by region: North America, Europe, Asia-Pacific, South America, and the Middle East & Africa. Each regional market presents unique growth opportunities and challenges, influenced by economic conditions, infrastructure, and local regulations. Finally, by material: Steel, Stainless Steel, and others.
Key Drivers of Industrial Chain Market Growth
Several key factors fuel the growth of the Industrial Chain market. Technological advancements, resulting in more efficient and durable chain designs, are driving adoption. Strong economic growth in emerging markets increases demand for industrial machinery and infrastructure. Furthermore, favorable government policies, such as investment in infrastructure projects and incentives for manufacturing, contribute positively. Finally, rising automation across various industries necessitates high-quality, reliable chains, further stimulating market expansion.
Challenges in the Industrial Chain Market Sector
The Industrial Chain market faces challenges, including fluctuating raw material prices, increasing labor costs, and intense competition. Stringent environmental regulations and supply chain disruptions, especially those related to steel production and global logistics, pose significant challenges. Additionally, managing fluctuating demand within various end-use industries requires careful production planning. These issues influence overall profitability and require manufacturers to implement cost-efficient and flexible production strategies to remain competitive.
Emerging Opportunities in Industrial Chain Market
Emerging opportunities are present in the specialized chain segments catering to industries like robotics, renewable energy, and advanced manufacturing. The growing demand for energy-efficient and lightweight chains presents a significant opportunity for innovation. The development of sustainable manufacturing processes and the exploration of new materials could deliver enhanced products and cost benefits.
Leading Players in the Industrial Chain Market Market
- Renold Jeffrey
- Rexnord Corporation
- Wippermann
- Peer Chain
- MAXCO Chain Ltd
- Zexus Chain Co Ltd
- Rolcon Engineering Co Ltd
- SKF International
- Katayama Chain (Changzhou) Co Ltd
- Tripcon Engineering Pvt Ltd
- MAXTOP - Ming Chang Chain
- KOBO USA LLC
- Hangzhou Qianjiang Chain Industries Co Ltd
- Shining Industrial Holding Co Ltd *List Not Exhaustive
Key Developments in Industrial Chain Market Industry
- July 2024: Chiaravalli Group Spa and Wippermann jr GmbH signed a distribution agreement for roller chains in Europe, expanding Wippermann's market reach.
- June 2024: India's Ministry of Commerce and Industry mandated the Standard Mark for certain precision chains, impacting market compliance.
- June 2024: CHAIN & Conveyor Ltd partnered with Hoverdale UK Ltd, combining engineering expertise and stockholding for enhanced customer service.
- July 2023: TIDC India highlighted its high-performance leaf chains meeting international standards and serving global OEMs.
Strategic Outlook for Industrial Chain Market Market
The Industrial Chain market is poised for continued growth, driven by sustained industrial expansion and increasing automation across various sectors. Emerging opportunities in specialized applications, coupled with technological advancements in materials and manufacturing processes, will fuel market expansion. Companies focusing on innovation, sustainability, and customer service will be best positioned to capitalize on this growth potential. The long-term outlook remains positive, given the fundamental role industrial chains play in numerous industries.
Industrial Chain Market Segmentation
-
1. Type
- 1.1. Roller Chain
- 1.2. Engineering Class Chain
- 1.3. Leaf Chain
- 1.4. Other Types
-
2. End-user Industry
- 2.1. Automotive Manufacturing
- 2.2. Energy and Power
- 2.3. Food and Beverage
- 2.4. Building and Construction
- 2.5. Other End-user Industries
Industrial Chain Market Segmentation By Geography
- 1. North America
- 2. Europe
- 3. Asia
- 4. Australia and New Zealand
- 5. Latin America
- 6. Middle East and Africa
Industrial Chain Market REPORT HIGHLIGHTS
| Aspects | Details |
|---|---|
| Study Period | 2019-2033 |
| Base Year | 2024 |
| Estimated Year | 2025 |
| Forecast Period | 2025-2033 |
| Historical Period | 2019-2024 |
| Growth Rate | CAGR of 3.50% from 2019-2033 |
| Segmentation |
|
Table of Contents
- 1. Introduction
- 1.1. Research Scope
- 1.2. Market Segmentation
- 1.3. Research Methodology
- 1.4. Definitions and Assumptions
- 2. Executive Summary
- 2.1. Introduction
- 3. Market Dynamics
- 3.1. Introduction
- 3.2. Market Drivers
- 3.2.1. Growing Manufacturing Industries and Increasing Usage of Industrial Chain Across the Industries; Increasing Technological Advancements
- 3.3. Market Restrains
- 3.3.1. Growing Manufacturing Industries and Increasing Usage of Industrial Chain Across the Industries; Increasing Technological Advancements
- 3.4. Market Trends
- 3.4.1. Roller Chain is Expected to Hold Significant Market Share
- 4. Market Factor Analysis
- 4.1. Porters Five Forces
- 4.2. Supply/Value Chain
- 4.3. PESTEL analysis
- 4.4. Market Entropy
- 4.5. Patent/Trademark Analysis
- 5. Global Industrial Chain Market Analysis, Insights and Forecast, 2019-2031
- 5.1. Market Analysis, Insights and Forecast - by Type
- 5.1.1. Roller Chain
- 5.1.2. Engineering Class Chain
- 5.1.3. Leaf Chain
- 5.1.4. Other Types
- 5.2. Market Analysis, Insights and Forecast - by End-user Industry
- 5.2.1. Automotive Manufacturing
- 5.2.2. Energy and Power
- 5.2.3. Food and Beverage
- 5.2.4. Building and Construction
- 5.2.5. Other End-user Industries
- 5.3. Market Analysis, Insights and Forecast - by Region
- 5.3.1. North America
- 5.3.2. Europe
- 5.3.3. Asia
- 5.3.4. Australia and New Zealand
- 5.3.5. Latin America
- 5.3.6. Middle East and Africa
- 5.1. Market Analysis, Insights and Forecast - by Type
- 6. North America Industrial Chain Market Analysis, Insights and Forecast, 2019-2031
- 6.1. Market Analysis, Insights and Forecast - by Type
- 6.1.1. Roller Chain
- 6.1.2. Engineering Class Chain
- 6.1.3. Leaf Chain
- 6.1.4. Other Types
- 6.2. Market Analysis, Insights and Forecast - by End-user Industry
- 6.2.1. Automotive Manufacturing
- 6.2.2. Energy and Power
- 6.2.3. Food and Beverage
- 6.2.4. Building and Construction
- 6.2.5. Other End-user Industries
- 6.1. Market Analysis, Insights and Forecast - by Type
- 7. Europe Industrial Chain Market Analysis, Insights and Forecast, 2019-2031
- 7.1. Market Analysis, Insights and Forecast - by Type
- 7.1.1. Roller Chain
- 7.1.2. Engineering Class Chain
- 7.1.3. Leaf Chain
- 7.1.4. Other Types
- 7.2. Market Analysis, Insights and Forecast - by End-user Industry
- 7.2.1. Automotive Manufacturing
- 7.2.2. Energy and Power
- 7.2.3. Food and Beverage
- 7.2.4. Building and Construction
- 7.2.5. Other End-user Industries
- 7.1. Market Analysis, Insights and Forecast - by Type
- 8. Asia Industrial Chain Market Analysis, Insights and Forecast, 2019-2031
- 8.1. Market Analysis, Insights and Forecast - by Type
- 8.1.1. Roller Chain
- 8.1.2. Engineering Class Chain
- 8.1.3. Leaf Chain
- 8.1.4. Other Types
- 8.2. Market Analysis, Insights and Forecast - by End-user Industry
- 8.2.1. Automotive Manufacturing
- 8.2.2. Energy and Power
- 8.2.3. Food and Beverage
- 8.2.4. Building and Construction
- 8.2.5. Other End-user Industries
- 8.1. Market Analysis, Insights and Forecast - by Type
- 9. Australia and New Zealand Industrial Chain Market Analysis, Insights and Forecast, 2019-2031
- 9.1. Market Analysis, Insights and Forecast - by Type
- 9.1.1. Roller Chain
- 9.1.2. Engineering Class Chain
- 9.1.3. Leaf Chain
- 9.1.4. Other Types
- 9.2. Market Analysis, Insights and Forecast - by End-user Industry
- 9.2.1. Automotive Manufacturing
- 9.2.2. Energy and Power
- 9.2.3. Food and Beverage
- 9.2.4. Building and Construction
- 9.2.5. Other End-user Industries
- 9.1. Market Analysis, Insights and Forecast - by Type
- 10. Latin America Industrial Chain Market Analysis, Insights and Forecast, 2019-2031
- 10.1. Market Analysis, Insights and Forecast - by Type
- 10.1.1. Roller Chain
- 10.1.2. Engineering Class Chain
- 10.1.3. Leaf Chain
- 10.1.4. Other Types
- 10.2. Market Analysis, Insights and Forecast - by End-user Industry
- 10.2.1. Automotive Manufacturing
- 10.2.2. Energy and Power
- 10.2.3. Food and Beverage
- 10.2.4. Building and Construction
- 10.2.5. Other End-user Industries
- 10.1. Market Analysis, Insights and Forecast - by Type
- 11. Middle East and Africa Industrial Chain Market Analysis, Insights and Forecast, 2019-2031
- 11.1. Market Analysis, Insights and Forecast - by Type
- 11.1.1. Roller Chain
- 11.1.2. Engineering Class Chain
- 11.1.3. Leaf Chain
- 11.1.4. Other Types
- 11.2. Market Analysis, Insights and Forecast - by End-user Industry
- 11.2.1. Automotive Manufacturing
- 11.2.2. Energy and Power
- 11.2.3. Food and Beverage
- 11.2.4. Building and Construction
- 11.2.5. Other End-user Industries
- 11.1. Market Analysis, Insights and Forecast - by Type
- 12. Competitive Analysis
- 12.1. Global Market Share Analysis 2024
- 12.2. Company Profiles
- 12.2.1 Renold Jeffrey
- 12.2.1.1. Overview
- 12.2.1.2. Products
- 12.2.1.3. SWOT Analysis
- 12.2.1.4. Recent Developments
- 12.2.1.5. Financials (Based on Availability)
- 12.2.2 Rexnord Corporation
- 12.2.2.1. Overview
- 12.2.2.2. Products
- 12.2.2.3. SWOT Analysis
- 12.2.2.4. Recent Developments
- 12.2.2.5. Financials (Based on Availability)
- 12.2.3 Wippermann
- 12.2.3.1. Overview
- 12.2.3.2. Products
- 12.2.3.3. SWOT Analysis
- 12.2.3.4. Recent Developments
- 12.2.3.5. Financials (Based on Availability)
- 12.2.4 Peer Chain
- 12.2.4.1. Overview
- 12.2.4.2. Products
- 12.2.4.3. SWOT Analysis
- 12.2.4.4. Recent Developments
- 12.2.4.5. Financials (Based on Availability)
- 12.2.5 MAXCO Chain Ltd
- 12.2.5.1. Overview
- 12.2.5.2. Products
- 12.2.5.3. SWOT Analysis
- 12.2.5.4. Recent Developments
- 12.2.5.5. Financials (Based on Availability)
- 12.2.6 Zexus Chain Co Ltd
- 12.2.6.1. Overview
- 12.2.6.2. Products
- 12.2.6.3. SWOT Analysis
- 12.2.6.4. Recent Developments
- 12.2.6.5. Financials (Based on Availability)
- 12.2.7 Rolcon Engineering Co Ltd
- 12.2.7.1. Overview
- 12.2.7.2. Products
- 12.2.7.3. SWOT Analysis
- 12.2.7.4. Recent Developments
- 12.2.7.5. Financials (Based on Availability)
- 12.2.8 SKF International
- 12.2.8.1. Overview
- 12.2.8.2. Products
- 12.2.8.3. SWOT Analysis
- 12.2.8.4. Recent Developments
- 12.2.8.5. Financials (Based on Availability)
- 12.2.9 Katayama Chain (Changzhou) Co Ltd
- 12.2.9.1. Overview
- 12.2.9.2. Products
- 12.2.9.3. SWOT Analysis
- 12.2.9.4. Recent Developments
- 12.2.9.5. Financials (Based on Availability)
- 12.2.10 Tripcon Engineering Pvt Ltd
- 12.2.10.1. Overview
- 12.2.10.2. Products
- 12.2.10.3. SWOT Analysis
- 12.2.10.4. Recent Developments
- 12.2.10.5. Financials (Based on Availability)
- 12.2.11 MAXTOP - Ming Chang Chain
- 12.2.11.1. Overview
- 12.2.11.2. Products
- 12.2.11.3. SWOT Analysis
- 12.2.11.4. Recent Developments
- 12.2.11.5. Financials (Based on Availability)
- 12.2.12 KOBO USA LLC
- 12.2.12.1. Overview
- 12.2.12.2. Products
- 12.2.12.3. SWOT Analysis
- 12.2.12.4. Recent Developments
- 12.2.12.5. Financials (Based on Availability)
- 12.2.13 Hangzhou Qianjiang Chain Industries Co Ltd
- 12.2.13.1. Overview
- 12.2.13.2. Products
- 12.2.13.3. SWOT Analysis
- 12.2.13.4. Recent Developments
- 12.2.13.5. Financials (Based on Availability)
- 12.2.14 Shining Industrial Holding Co Ltd*List Not Exhaustive
- 12.2.14.1. Overview
- 12.2.14.2. Products
- 12.2.14.3. SWOT Analysis
- 12.2.14.4. Recent Developments
- 12.2.14.5. Financials (Based on Availability)
- 12.2.1 Renold Jeffrey
List of Figures
- Figure 1: Global Industrial Chain Market Revenue Breakdown (Million, %) by Region 2024 & 2032
- Figure 2: Global Industrial Chain Market Volume Breakdown (Billion, %) by Region 2024 & 2032
- Figure 3: North America Industrial Chain Market Revenue (Million), by Type 2024 & 2032
- Figure 4: North America Industrial Chain Market Volume (Billion), by Type 2024 & 2032
- Figure 5: North America Industrial Chain Market Revenue Share (%), by Type 2024 & 2032
- Figure 6: North America Industrial Chain Market Volume Share (%), by Type 2024 & 2032
- Figure 7: North America Industrial Chain Market Revenue (Million), by End-user Industry 2024 & 2032
- Figure 8: North America Industrial Chain Market Volume (Billion), by End-user Industry 2024 & 2032
- Figure 9: North America Industrial Chain Market Revenue Share (%), by End-user Industry 2024 & 2032
- Figure 10: North America Industrial Chain Market Volume Share (%), by End-user Industry 2024 & 2032
- Figure 11: North America Industrial Chain Market Revenue (Million), by Country 2024 & 2032
- Figure 12: North America Industrial Chain Market Volume (Billion), by Country 2024 & 2032
- Figure 13: North America Industrial Chain Market Revenue Share (%), by Country 2024 & 2032
- Figure 14: North America Industrial Chain Market Volume Share (%), by Country 2024 & 2032
- Figure 15: Europe Industrial Chain Market Revenue (Million), by Type 2024 & 2032
- Figure 16: Europe Industrial Chain Market Volume (Billion), by Type 2024 & 2032
- Figure 17: Europe Industrial Chain Market Revenue Share (%), by Type 2024 & 2032
- Figure 18: Europe Industrial Chain Market Volume Share (%), by Type 2024 & 2032
- Figure 19: Europe Industrial Chain Market Revenue (Million), by End-user Industry 2024 & 2032
- Figure 20: Europe Industrial Chain Market Volume (Billion), by End-user Industry 2024 & 2032
- Figure 21: Europe Industrial Chain Market Revenue Share (%), by End-user Industry 2024 & 2032
- Figure 22: Europe Industrial Chain Market Volume Share (%), by End-user Industry 2024 & 2032
- Figure 23: Europe Industrial Chain Market Revenue (Million), by Country 2024 & 2032
- Figure 24: Europe Industrial Chain Market Volume (Billion), by Country 2024 & 2032
- Figure 25: Europe Industrial Chain Market Revenue Share (%), by Country 2024 & 2032
- Figure 26: Europe Industrial Chain Market Volume Share (%), by Country 2024 & 2032
- Figure 27: Asia Industrial Chain Market Revenue (Million), by Type 2024 & 2032
- Figure 28: Asia Industrial Chain Market Volume (Billion), by Type 2024 & 2032
- Figure 29: Asia Industrial Chain Market Revenue Share (%), by Type 2024 & 2032
- Figure 30: Asia Industrial Chain Market Volume Share (%), by Type 2024 & 2032
- Figure 31: Asia Industrial Chain Market Revenue (Million), by End-user Industry 2024 & 2032
- Figure 32: Asia Industrial Chain Market Volume (Billion), by End-user Industry 2024 & 2032
- Figure 33: Asia Industrial Chain Market Revenue Share (%), by End-user Industry 2024 & 2032
- Figure 34: Asia Industrial Chain Market Volume Share (%), by End-user Industry 2024 & 2032
- Figure 35: Asia Industrial Chain Market Revenue (Million), by Country 2024 & 2032
- Figure 36: Asia Industrial Chain Market Volume (Billion), by Country 2024 & 2032
- Figure 37: Asia Industrial Chain Market Revenue Share (%), by Country 2024 & 2032
- Figure 38: Asia Industrial Chain Market Volume Share (%), by Country 2024 & 2032
- Figure 39: Australia and New Zealand Industrial Chain Market Revenue (Million), by Type 2024 & 2032
- Figure 40: Australia and New Zealand Industrial Chain Market Volume (Billion), by Type 2024 & 2032
- Figure 41: Australia and New Zealand Industrial Chain Market Revenue Share (%), by Type 2024 & 2032
- Figure 42: Australia and New Zealand Industrial Chain Market Volume Share (%), by Type 2024 & 2032
- Figure 43: Australia and New Zealand Industrial Chain Market Revenue (Million), by End-user Industry 2024 & 2032
- Figure 44: Australia and New Zealand Industrial Chain Market Volume (Billion), by End-user Industry 2024 & 2032
- Figure 45: Australia and New Zealand Industrial Chain Market Revenue Share (%), by End-user Industry 2024 & 2032
- Figure 46: Australia and New Zealand Industrial Chain Market Volume Share (%), by End-user Industry 2024 & 2032
- Figure 47: Australia and New Zealand Industrial Chain Market Revenue (Million), by Country 2024 & 2032
- Figure 48: Australia and New Zealand Industrial Chain Market Volume (Billion), by Country 2024 & 2032
- Figure 49: Australia and New Zealand Industrial Chain Market Revenue Share (%), by Country 2024 & 2032
- Figure 50: Australia and New Zealand Industrial Chain Market Volume Share (%), by Country 2024 & 2032
- Figure 51: Latin America Industrial Chain Market Revenue (Million), by Type 2024 & 2032
- Figure 52: Latin America Industrial Chain Market Volume (Billion), by Type 2024 & 2032
- Figure 53: Latin America Industrial Chain Market Revenue Share (%), by Type 2024 & 2032
- Figure 54: Latin America Industrial Chain Market Volume Share (%), by Type 2024 & 2032
- Figure 55: Latin America Industrial Chain Market Revenue (Million), by End-user Industry 2024 & 2032
- Figure 56: Latin America Industrial Chain Market Volume (Billion), by End-user Industry 2024 & 2032
- Figure 57: Latin America Industrial Chain Market Revenue Share (%), by End-user Industry 2024 & 2032
- Figure 58: Latin America Industrial Chain Market Volume Share (%), by End-user Industry 2024 & 2032
- Figure 59: Latin America Industrial Chain Market Revenue (Million), by Country 2024 & 2032
- Figure 60: Latin America Industrial Chain Market Volume (Billion), by Country 2024 & 2032
- Figure 61: Latin America Industrial Chain Market Revenue Share (%), by Country 2024 & 2032
- Figure 62: Latin America Industrial Chain Market Volume Share (%), by Country 2024 & 2032
- Figure 63: Middle East and Africa Industrial Chain Market Revenue (Million), by Type 2024 & 2032
- Figure 64: Middle East and Africa Industrial Chain Market Volume (Billion), by Type 2024 & 2032
- Figure 65: Middle East and Africa Industrial Chain Market Revenue Share (%), by Type 2024 & 2032
- Figure 66: Middle East and Africa Industrial Chain Market Volume Share (%), by Type 2024 & 2032
- Figure 67: Middle East and Africa Industrial Chain Market Revenue (Million), by End-user Industry 2024 & 2032
- Figure 68: Middle East and Africa Industrial Chain Market Volume (Billion), by End-user Industry 2024 & 2032
- Figure 69: Middle East and Africa Industrial Chain Market Revenue Share (%), by End-user Industry 2024 & 2032
- Figure 70: Middle East and Africa Industrial Chain Market Volume Share (%), by End-user Industry 2024 & 2032
- Figure 71: Middle East and Africa Industrial Chain Market Revenue (Million), by Country 2024 & 2032
- Figure 72: Middle East and Africa Industrial Chain Market Volume (Billion), by Country 2024 & 2032
- Figure 73: Middle East and Africa Industrial Chain Market Revenue Share (%), by Country 2024 & 2032
- Figure 74: Middle East and Africa Industrial Chain Market Volume Share (%), by Country 2024 & 2032
List of Tables
- Table 1: Global Industrial Chain Market Revenue Million Forecast, by Region 2019 & 2032
- Table 2: Global Industrial Chain Market Volume Billion Forecast, by Region 2019 & 2032
- Table 3: Global Industrial Chain Market Revenue Million Forecast, by Type 2019 & 2032
- Table 4: Global Industrial Chain Market Volume Billion Forecast, by Type 2019 & 2032
- Table 5: Global Industrial Chain Market Revenue Million Forecast, by End-user Industry 2019 & 2032
- Table 6: Global Industrial Chain Market Volume Billion Forecast, by End-user Industry 2019 & 2032
- Table 7: Global Industrial Chain Market Revenue Million Forecast, by Region 2019 & 2032
- Table 8: Global Industrial Chain Market Volume Billion Forecast, by Region 2019 & 2032
- Table 9: Global Industrial Chain Market Revenue Million Forecast, by Type 2019 & 2032
- Table 10: Global Industrial Chain Market Volume Billion Forecast, by Type 2019 & 2032
- Table 11: Global Industrial Chain Market Revenue Million Forecast, by End-user Industry 2019 & 2032
- Table 12: Global Industrial Chain Market Volume Billion Forecast, by End-user Industry 2019 & 2032
- Table 13: Global Industrial Chain Market Revenue Million Forecast, by Country 2019 & 2032
- Table 14: Global Industrial Chain Market Volume Billion Forecast, by Country 2019 & 2032
- Table 15: Global Industrial Chain Market Revenue Million Forecast, by Type 2019 & 2032
- Table 16: Global Industrial Chain Market Volume Billion Forecast, by Type 2019 & 2032
- Table 17: Global Industrial Chain Market Revenue Million Forecast, by End-user Industry 2019 & 2032
- Table 18: Global Industrial Chain Market Volume Billion Forecast, by End-user Industry 2019 & 2032
- Table 19: Global Industrial Chain Market Revenue Million Forecast, by Country 2019 & 2032
- Table 20: Global Industrial Chain Market Volume Billion Forecast, by Country 2019 & 2032
- Table 21: Global Industrial Chain Market Revenue Million Forecast, by Type 2019 & 2032
- Table 22: Global Industrial Chain Market Volume Billion Forecast, by Type 2019 & 2032
- Table 23: Global Industrial Chain Market Revenue Million Forecast, by End-user Industry 2019 & 2032
- Table 24: Global Industrial Chain Market Volume Billion Forecast, by End-user Industry 2019 & 2032
- Table 25: Global Industrial Chain Market Revenue Million Forecast, by Country 2019 & 2032
- Table 26: Global Industrial Chain Market Volume Billion Forecast, by Country 2019 & 2032
- Table 27: Global Industrial Chain Market Revenue Million Forecast, by Type 2019 & 2032
- Table 28: Global Industrial Chain Market Volume Billion Forecast, by Type 2019 & 2032
- Table 29: Global Industrial Chain Market Revenue Million Forecast, by End-user Industry 2019 & 2032
- Table 30: Global Industrial Chain Market Volume Billion Forecast, by End-user Industry 2019 & 2032
- Table 31: Global Industrial Chain Market Revenue Million Forecast, by Country 2019 & 2032
- Table 32: Global Industrial Chain Market Volume Billion Forecast, by Country 2019 & 2032
- Table 33: Global Industrial Chain Market Revenue Million Forecast, by Type 2019 & 2032
- Table 34: Global Industrial Chain Market Volume Billion Forecast, by Type 2019 & 2032
- Table 35: Global Industrial Chain Market Revenue Million Forecast, by End-user Industry 2019 & 2032
- Table 36: Global Industrial Chain Market Volume Billion Forecast, by End-user Industry 2019 & 2032
- Table 37: Global Industrial Chain Market Revenue Million Forecast, by Country 2019 & 2032
- Table 38: Global Industrial Chain Market Volume Billion Forecast, by Country 2019 & 2032
- Table 39: Global Industrial Chain Market Revenue Million Forecast, by Type 2019 & 2032
- Table 40: Global Industrial Chain Market Volume Billion Forecast, by Type 2019 & 2032
- Table 41: Global Industrial Chain Market Revenue Million Forecast, by End-user Industry 2019 & 2032
- Table 42: Global Industrial Chain Market Volume Billion Forecast, by End-user Industry 2019 & 2032
- Table 43: Global Industrial Chain Market Revenue Million Forecast, by Country 2019 & 2032
- Table 44: Global Industrial Chain Market Volume Billion Forecast, by Country 2019 & 2032
Frequently Asked Questions
1. What is the projected Compound Annual Growth Rate (CAGR) of the Industrial Chain Market?
The projected CAGR is approximately 3.50%.
2. Which companies are prominent players in the Industrial Chain Market?
Key companies in the market include Renold Jeffrey, Rexnord Corporation, Wippermann, Peer Chain, MAXCO Chain Ltd, Zexus Chain Co Ltd, Rolcon Engineering Co Ltd, SKF International, Katayama Chain (Changzhou) Co Ltd, Tripcon Engineering Pvt Ltd, MAXTOP - Ming Chang Chain, KOBO USA LLC, Hangzhou Qianjiang Chain Industries Co Ltd, Shining Industrial Holding Co Ltd*List Not Exhaustive.
3. What are the main segments of the Industrial Chain Market?
The market segments include Type, End-user Industry.
4. Can you provide details about the market size?
The market size is estimated to be USD 4.10 Million as of 2022.
5. What are some drivers contributing to market growth?
Growing Manufacturing Industries and Increasing Usage of Industrial Chain Across the Industries; Increasing Technological Advancements.
6. What are the notable trends driving market growth?
Roller Chain is Expected to Hold Significant Market Share.
7. Are there any restraints impacting market growth?
Growing Manufacturing Industries and Increasing Usage of Industrial Chain Across the Industries; Increasing Technological Advancements.
8. Can you provide examples of recent developments in the market?
July 2024: Chiaravalli Group Spa signed a distribution agreement with Wippermann jr GmbH for roller chains in the European market. This partnership allows Wippermann to enhance Chiaravalli's offerings with a broader selection of premium solutions. Chiaravalli will oversee the integration of Wippermann's roller chains catalog into its operations.June 2024: The Ministry of Commerce and Industry, through its Department for Promotion of Industry and Internal Trade, issued a directive concerning Precision Roller and Bush Chains, Attachments, and Associated Chains Sprockets. This new directive enforces the mandatory use of the Standard Mark on certain goods that meet Indian Standards. The directive outlines penalties for non-compliance and sets implementation dates tailored to different categories of enterprises.June 2024: CHAIN & Conveyor Ltd (manufacturer of Leaf Chain) partnered with Hoverdale UK Ltd to leverage its combined engineering expertise and global stockholding capabilities. This strategic collaboration aims to maximize benefits for its respective customer bases. By deploying joint engineering teams, both organizations will streamline the installation and servicing of customer assets. This partnership will enhance Chain & Conveyor’s extensive inventory of parts and ancillary components, expanding it to all Hoverdale locations both nationally and internationally.July 2023: TIDC India designs and supplies high-performance Leaf Chains to global Original Equipment Manufacturers (OEMs) in the Material Handling sector. These chains strictly adhere to international standards, including ANSI, BS, and DIN. TIDC India's Leaf Chains are considered to be a trusted chain in Europe and the USA. TIDC India continually enhances the performance of its leaf chains by emphasizing key design elements.
9. What pricing options are available for accessing the report?
Pricing options include single-user, multi-user, and enterprise licenses priced at USD 4750, USD 5250, and USD 8750 respectively.
10. Is the market size provided in terms of value or volume?
The market size is provided in terms of value, measured in Million and volume, measured in Billion.
11. Are there any specific market keywords associated with the report?
Yes, the market keyword associated with the report is "Industrial Chain Market," which aids in identifying and referencing the specific market segment covered.
12. How do I determine which pricing option suits my needs best?
The pricing options vary based on user requirements and access needs. Individual users may opt for single-user licenses, while businesses requiring broader access may choose multi-user or enterprise licenses for cost-effective access to the report.
13. Are there any additional resources or data provided in the Industrial Chain Market report?
While the report offers comprehensive insights, it's advisable to review the specific contents or supplementary materials provided to ascertain if additional resources or data are available.
14. How can I stay updated on further developments or reports in the Industrial Chain Market?
To stay informed about further developments, trends, and reports in the Industrial Chain Market, consider subscribing to industry newsletters, following relevant companies and organizations, or regularly checking reputable industry news sources and publications.
Methodology
Step 1 - Identification of Relevant Samples Size from Population Database


Step 2 - Approaches for Defining Global Market Size (Value, Volume* & Price*)

Note*: In applicable scenarios
Step 3 - Data Sources
Primary Research
- Web Analytics
- Survey Reports
- Research Institute
- Latest Research Reports
- Opinion Leaders
Secondary Research
- Annual Reports
- White Paper
- Latest Press Release
- Industry Association
- Paid Database
- Investor Presentations

Step 4 - Data Triangulation
Involves using different sources of information in order to increase the validity of a study
These sources are likely to be stakeholders in a program - participants, other researchers, program staff, other community members, and so on.
Then we put all data in single framework & apply various statistical tools to find out the dynamic on the market.
During the analysis stage, feedback from the stakeholder groups would be compared to determine areas of agreement as well as areas of divergence


