

Key Insights
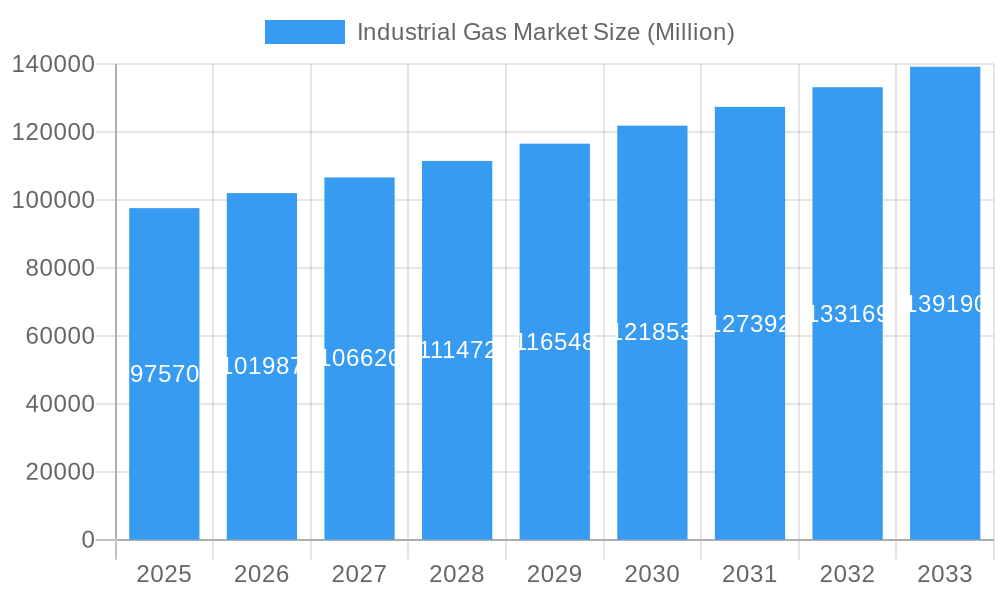
The industrial gas market, valued at $119.11 billion in its 2025 base year, is projected for substantial growth. An anticipated compound annual growth rate (CAGR) of 4.4% from 2025 to 2033 underscores this expansion, driven by escalating demand across key sectors. Prominent drivers include the chemical processing and refining industries, the advanced electronics sector requiring high-purity gases, and the food and beverage industry's reliance on gases for processing and preservation. Further contributing to market expansion are the automotive and transportation sectors' adoption of sophisticated manufacturing techniques, alongside increasing energy and power demands. The burgeoning global population and subsequent industrialization in emerging economies, particularly in the Asia-Pacific region (including China and India), also serve as significant growth catalysts. However, potential challenges include volatile raw material pricing, stringent environmental regulations, and the inherent risks associated with industrial gas handling and transportation. Market segmentation highlights nitrogen, oxygen, and carbon dioxide as leading product types, while chemical processing, electronics, and food and beverage lead in end-user segments. This competitive landscape comprises established global corporations and regional entities vying for market dominance through innovation and strategic alliances.
Industrial Gas Market Market Size (In Billion)
The forecast period of 2026-2033 anticipates sustained market expansion, propelled by continuous industrial development and technological innovation. Regional dynamics will persist, with Asia-Pacific solidifying its position as a key market due to rapid industrialization and a substantial population. North America and Europe are also expected to contribute significantly to overall market growth, driven by technological advancements and industrial activity. The competitive environment is poised to remain dynamic, with mergers, acquisitions, and strategic investments influencing industry direction. Companies will likely prioritize the development of innovative products, supply chain optimization, and sustainable practices to address growing industrial gas demand while adhering to environmental standards.
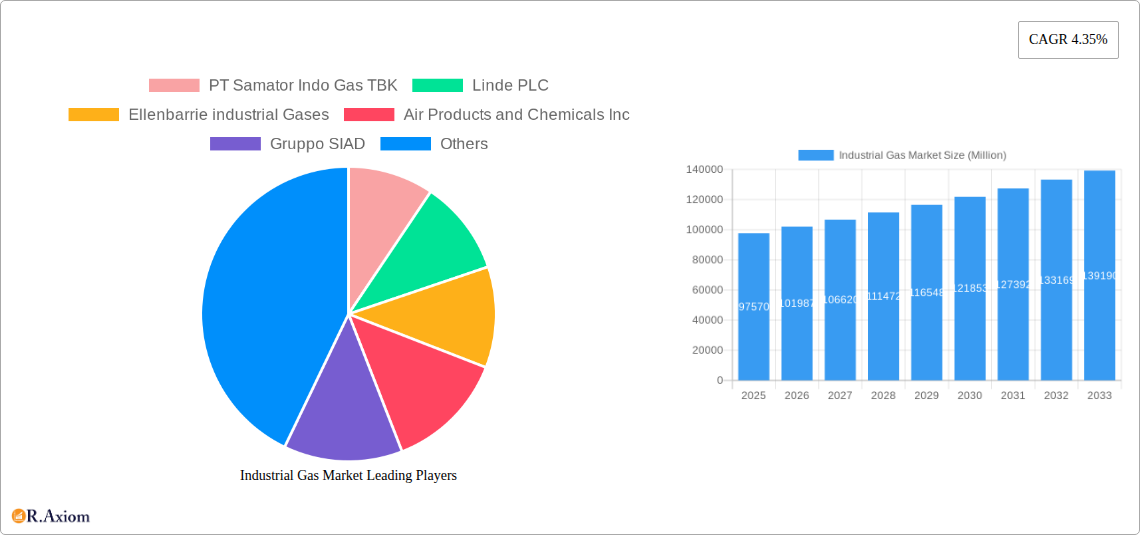
Industrial Gas Market Company Market Share
Industrial Gas Market: A Comprehensive Report (2019-2033)
This in-depth report provides a comprehensive analysis of the Industrial Gas Market, covering historical data (2019-2024), the current state (2025), and future projections (2025-2033). It delves into market dynamics, competitive landscapes, and emerging trends, offering actionable insights for industry stakeholders. The report utilizes a robust methodology, incorporating both quantitative and qualitative data analysis to deliver a complete picture of this vital sector. The total market size is estimated at xx Million in 2025, with significant growth potential throughout the forecast period.
Industrial Gas Market Concentration & Innovation
The industrial gas market exhibits a moderately concentrated structure, with a few large multinational corporations holding significant market share. Key players such as Air Liquide, Linde PLC, and Air Products and Chemicals Inc. dominate globally, benefiting from economies of scale and extensive distribution networks. However, regional players and specialized gas providers also hold notable positions in specific niches. Market share data reveals that the top 5 companies control approximately xx% of the global market in 2025, while regional players contribute xx%.
Innovation Drivers:
- Technological advancements in gas production, purification, and delivery systems.
- Growing demand for high-purity gases in various applications.
- Development of sustainable and energy-efficient production methods.
- Increased focus on safety and regulatory compliance.
Regulatory Frameworks:
Stringent environmental regulations and safety standards significantly impact the industry, driving investment in cleaner production technologies and robust safety protocols. Compliance costs and evolving regulations are key factors affecting market dynamics.
Product Substitutes:
Limited readily available substitutes exist for many industrial gases, making the market relatively inelastic. However, technological advancements are leading to the development of alternative materials and processes, potentially impacting market shares in certain segments.
End-User Trends:
The shift towards cleaner energy sources, particularly in the energy and power sector, drives demand for specific gases like hydrogen and oxygen. Furthermore, increased automation and technological advancements in manufacturing and refining are creating new applications for industrial gases.
M&A Activities:
The industrial gas market has witnessed significant M&A activity in recent years, primarily driven by consolidation efforts among large players. Deal values have reached xx Million in the last five years, largely reflecting expansion strategies and a focus on acquiring regional competitors with specialized expertise.
Industrial Gas Market Industry Trends & Insights
The industrial gas market is characterized by a steady growth trajectory, driven by expanding industrial activity globally. The market is expected to exhibit a Compound Annual Growth Rate (CAGR) of xx% during the forecast period (2025-2033). This growth is influenced by several key factors: rising demand from key end-user industries, technological advancements leading to increased efficiency and new applications, and favorable economic conditions in several regions.
Technological disruptions, such as the rise of advanced gas separation technologies and the increasing adoption of digitalization within the industry, are transforming production methods and enhancing supply chain efficiency. Consumer preferences are shifting towards sustainable and environmentally friendly gas production, driving the adoption of renewable energy-based production processes. Competitive dynamics are primarily shaped by pricing strategies, product differentiation, and service offerings. Larger players leverage their scale to offer competitive pricing, while smaller companies focus on niche markets and specialized services. Market penetration of new technologies, particularly in areas like carbon capture and utilization, remains relatively low but is expected to increase significantly in the coming years.
Dominant Markets & Segments in Industrial Gas Market
The Asia-Pacific region holds a leading position in the global industrial gas market, driven by rapid industrialization and expanding manufacturing capacity in countries like China and India. North America and Europe also represent significant markets, though growth rates may be slightly slower than in the Asia-Pacific region.
Dominant Product Types:
- Nitrogen: Dominates the market due to extensive applications across various industries, including chemical processing, food preservation, and electronics manufacturing.
- Oxygen: Essential for steelmaking, chemical processing, and healthcare, contributing to significant market demand.
- Carbon Dioxide: Utilized in food and beverage, industrial processes, and increasingly in carbon capture and utilization technologies.
Dominant End-user Industries:
- Chemical Processing and Refining: Remains the largest end-user segment, driven by the extensive use of various gases in chemical synthesis and refining processes.
- Metal Manufacturing and Fabrication: Relies heavily on oxygen and other gases for steelmaking, welding, and other fabrication processes.
- Food and Beverage: Employs gases like nitrogen and carbon dioxide for food preservation, packaging, and carbonation.
Key Drivers:
- Strong economic growth in emerging economies.
- Government incentives for industrial development.
- Investments in infrastructure development.
- Growing adoption of advanced technologies.
Industrial Gas Market Product Developments
The industrial gas market is witnessing a wave of dynamic product developments, strategically engineered to meet the evolving needs of diverse industries. A paramount focus is placed on elevating gas purity to meet stringent application requirements in sectors like electronics and pharmaceuticals. Simultaneously, there's a significant push towards optimizing delivery systems, ensuring greater reliability, flexibility, and cost-effectiveness for end-users, including the integration of digital monitoring for proactive maintenance and optimized supply. A critical area of innovation lies in the development of sustainable production processes, moving towards cleaner energy sources and more efficient methods to reduce the environmental footprint. This includes advancements in on-site generation and the utilization of renewable energy in air separation units. New and exciting applications are continuously emerging, particularly in high-growth sectors such as the burgeoning hydrogen fuel cell industry, critical carbon capture and utilization (CCU) technologies for climate mitigation, and advanced materials manufacturing where precise gas compositions are essential. Competitive advantages are increasingly being carved out through a combination of superior, consistent product quality, seamlessly integrated and efficient delivery networks, and an unwavering commitment to robust customer service and technical support. Key technological trends are steering the industry towards greater automation across the value chain, sophisticated data-driven optimization for production and logistics, and the widespread adoption of eco-friendly production methods, all meticulously designed to enhance operational efficiency, product performance, and overall market responsiveness.
Report Scope & Segmentation Analysis
This report segments the industrial gas market by product type (Nitrogen, Oxygen, Carbon Dioxide, Hydrogen, Helium, Argon, Ammonia, Methane, Propane, Butane, Other Product Types) and end-user industry (Chemical Processing and Refining, Electronics, Food and Beverage, Oil and Gas, Metal Manufacturing and Fabrication, Medical and Pharmaceutical, Automotive and Transportation, Energy and Power, Other End-user Industries). Each segment is analyzed based on market size, growth projections, competitive dynamics, and key influencing factors. Growth rates vary across segments based on the demand drivers and industry-specific factors. Competitive dynamics are shaped by factors such as product differentiation, pricing strategies, and geographic reach.
Key Drivers of Industrial Gas Market Growth
The industrial gas market's robust growth trajectory is underpinned by a confluence of powerful and interconnected drivers. Firstly, the relentless and ongoing expansion of foundational industries such as sophisticated chemical processing, expansive metal manufacturing, and the dynamic food and beverage sector are generating a consistently high and growing demand for a wide spectrum of industrial gases. These gases are indispensable for myriad processes, from inerting and welding to food preservation and chemical synthesis. Secondly, continuous and significant technological advancements are not only revolutionizing the industry but also leading to the development of demonstrably more efficient and economically viable production methods. These innovations, including improved separation techniques and energy-saving designs, directly enhance the market's competitiveness and scalability. Thirdly, a growing imperative for environmental sustainability, often driven by increasingly stringent government regulations and global climate initiatives, is powerfully accelerating the adoption of eco-friendly gas production technologies and practices. This includes a shift towards lower-emission processes and the integration of renewable energy sources.
Challenges in the Industrial Gas Market Sector
Despite its promising outlook, the industrial gas market sector navigates a complex landscape of significant challenges. A persistent concern is the inherent volatility in raw material prices, which can substantially impact production costs and, consequently, compress profitability margins. Geopolitical instability and the increasing frequency and severity of extreme weather events pose considerable risks to supply chain integrity, potentially leading to production delays, logistical nightmares, and escalated operational costs. The market is also characterized by intense and often fierce competition, not only among established large multinational corporations but also from agile regional players, collectively exerting downward pressure on pricing and eroding profit margins. Furthermore, the ever-evolving and increasingly stringent environmental regulations necessitate substantial and ongoing investments in advanced emissions reduction technologies and sustainable practices, thereby adding to operational expenditures and requiring strategic capital allocation.
Emerging Opportunities in Industrial Gas Market
The industrial gas market is brimming with compelling emerging opportunities, primarily centered around innovation and the exploration of new frontiers. A significant avenue for growth lies in the research, development, and subsequent commercialization of next-generation gas production technologies. This is particularly true for solutions that leverage renewable energy sources, promising a more sustainable and cost-effective future for gas production. Expanding applications in critical and rapidly developing areas such as the rapidly growing hydrogen fuel cell sector for clean transportation and energy storage, and advanced carbon capture and utilization (CCU) technologies for industrial decarbonization, present substantial and exciting growth potential. Furthermore, the escalating demand for high-purity gases in burgeoning and dynamic emerging markets, especially across the Asia-Pacific region, offers lucrative and strategically important opportunities for market expansion and deeper penetration.
Leading Players in the Industrial Gas Market Market
- PT Samator Indo Gas TBK
- Linde PLC
- Ellenbarrie industrial Gases
- Air Products and Chemicals Inc
- Gruppo SIAD
- Bhuruka Gases Limited
- BASF SE
- Iwatani Corporation
- Asia Technical Gas Co Pte Ltd
- Sapio Group
- Messer Group GmbH
- Yingde Gases Group
- Air Liquide
- Nippon Sanso Holdings Corporation
- SOL SPA
Key Developments in Industrial Gas Market Industry
- January 2023: Iwatani Corporation's acquisition of Aspen Air US, LLC, expands its presence in the US industrial gas sector.
- April 2023: Nippon Gases Operations' new CO2 plant in Italy showcases investment in carbon capture and utilization for food applications.
Strategic Outlook for Industrial Gas Market Market
The industrial gas market is strategically positioned for sustained and robust growth in the foreseeable future. This optimistic outlook is propelled by the synergistic forces of continuous technological advancements, the steady expansion of global industrial activity, and a heightened global awareness and concern regarding environmental sustainability. Significant opportunities abound in the proactive development and implementation of sustainable production methods that minimize environmental impact, the exploration and commercialization of novel and diverse applications for industrial gases across various sectors, and the strategic expansion into high-potential emerging markets. The competitive landscape will continue to be shaped by strategic partnerships, mergers, and acquisitions, fostering consolidation and synergy. Companies that demonstrate a strong commitment to innovation, prioritize sustainability in their operations and product offerings, and maintain agility in responding to market dynamics are exceptionally well-positioned to capture substantial and enduring market share in the coming years.
Industrial Gas Market Segmentation
-
1. Product Type
- 1.1. Nitrogen
- 1.2. Oxygen
- 1.3. Carbon dioxide
- 1.4. Hydrogen
- 1.5. Helium
- 1.6. Argon
- 1.7. Ammonia
- 1.8. Methane
- 1.9. Propane
- 1.10. Butane
- 1.11. Other Product Types
-
2. End-user Industry
- 2.1. Chemical Processing and Refining
- 2.2. Electronics
- 2.3. Food and Beverage
- 2.4. Oil and Gas
- 2.5. Metal Manufacturing and Fabrication
- 2.6. Medical and Pharmaceutical
- 2.7. Automotive and Transportation
- 2.8. Energy and Power
- 2.9. Other End-user Industries
Industrial Gas Market Segmentation By Geography
-
1. Asia Pacific
- 1.1. China
- 1.2. India
- 1.3. Japan
- 1.4. South Korea
- 1.5. ASEAN Countries
- 1.6. Rest of Asia Pacific
-
2. North America
- 2.1. United States
- 2.2. Canada
- 2.3. Mexico
-
3. Europe
- 3.1. Germany
- 3.2. United Kingdom
- 3.3. France
- 3.4. Italy
- 3.5. NORDIC Countries
- 3.6. Rest of Europe
-
4. South America
- 4.1. Brazil
- 4.2. Argentina
- 4.3. Rest of South America
-
5. Middle East and Africa
- 5.1. Saudi Arabia
- 5.2. South Africa
- 5.3. Rest of Middle East and Africa
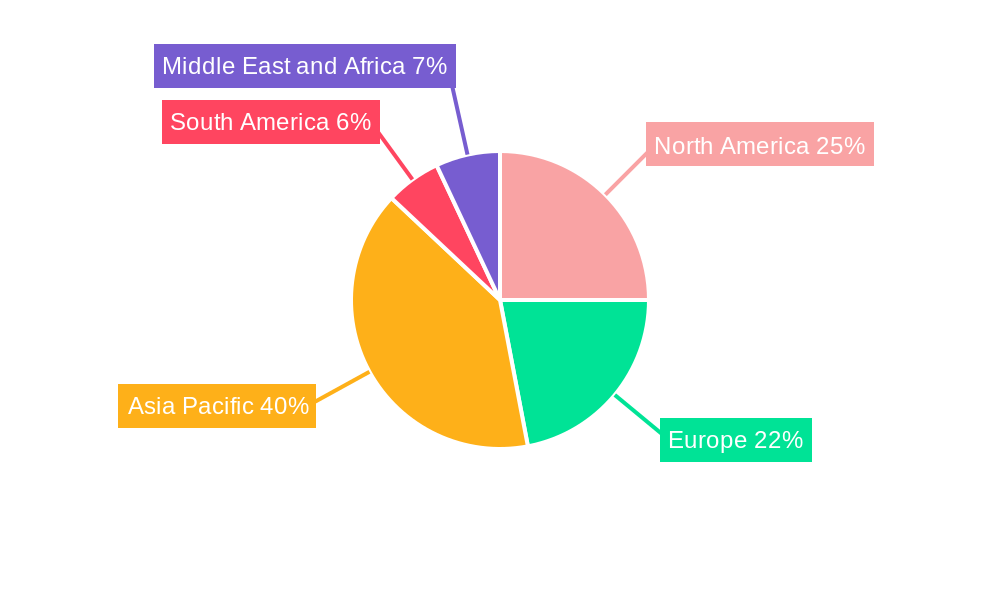
Industrial Gas Market Regional Market Share
Geographic Coverage of Industrial Gas Market
Industrial Gas Market REPORT HIGHLIGHTS
| Aspects | Details |
|---|---|
| Study Period | 2020-2034 |
| Base Year | 2025 |
| Estimated Year | 2026 |
| Forecast Period | 2026-2034 |
| Historical Period | 2020-2025 |
| Growth Rate | CAGR of 4.4% from 2020-2034 |
| Segmentation |
|
Table of Contents
- 1. Introduction
- 1.1. Research Scope
- 1.2. Market Segmentation
- 1.3. Research Objective
- 1.4. Definitions and Assumptions
- 2. Executive Summary
- 2.1. Market Snapshot
- 3. Market Dynamics
- 3.1. Market Drivers
- 3.2. Market Restrains
- 3.3. Market Trends
- 3.4. Market Opportunities
- 4. Market Factor Analysis
- 4.1. Porters Five Forces
- 4.1.1. Bargaining Power of Suppliers
- 4.1.2. Bargaining Power of Buyers
- 4.1.3. Threat of New Entrants
- 4.1.4. Threat of Substitutes
- 4.1.5. Competitive Rivalry
- 4.2. PESTEL analysis
- 4.3. BCG Analysis
- 4.3.1. Stars (High Growth, High Market Share)
- 4.3.2. Cash Cows (Low Growth, High Market Share)
- 4.3.3. Question Mark (High Growth, Low Market Share)
- 4.3.4. Dogs (Low Growth, Low Market Share)
- 4.4. Ansoff Matrix Analysis
- 4.5. Supply Chain Analysis
- 4.6. Regulatory Landscape
- 4.7. Current Market Potential and Opportunity Assessment (TAM–SAM–SOM Framework)
- 4.8. RAX Analyst Note
- 4.1. Porters Five Forces
- 5. Market Analysis, Insights and Forecast 2021-2033
- 5.1. Market Analysis, Insights and Forecast - by Product Type
- 5.1.1. Nitrogen
- 5.1.2. Oxygen
- 5.1.3. Carbon dioxide
- 5.1.4. Hydrogen
- 5.1.5. Helium
- 5.1.6. Argon
- 5.1.7. Ammonia
- 5.1.8. Methane
- 5.1.9. Propane
- 5.1.10. Butane
- 5.1.11. Other Product Types
- 5.2. Market Analysis, Insights and Forecast - by End-user Industry
- 5.2.1. Chemical Processing and Refining
- 5.2.2. Electronics
- 5.2.3. Food and Beverage
- 5.2.4. Oil and Gas
- 5.2.5. Metal Manufacturing and Fabrication
- 5.2.6. Medical and Pharmaceutical
- 5.2.7. Automotive and Transportation
- 5.2.8. Energy and Power
- 5.2.9. Other End-user Industries
- 5.3. Market Analysis, Insights and Forecast - by Region
- 5.3.1. Asia Pacific
- 5.3.2. North America
- 5.3.3. Europe
- 5.3.4. South America
- 5.3.5. Middle East and Africa
- 5.1. Market Analysis, Insights and Forecast - by Product Type
- 6. Global Industrial Gas Market Analysis, Insights and Forecast, 2021-2033
- 6.1. Market Analysis, Insights and Forecast - by Product Type
- 6.1.1. Nitrogen
- 6.1.2. Oxygen
- 6.1.3. Carbon dioxide
- 6.1.4. Hydrogen
- 6.1.5. Helium
- 6.1.6. Argon
- 6.1.7. Ammonia
- 6.1.8. Methane
- 6.1.9. Propane
- 6.1.10. Butane
- 6.1.11. Other Product Types
- 6.2. Market Analysis, Insights and Forecast - by End-user Industry
- 6.2.1. Chemical Processing and Refining
- 6.2.2. Electronics
- 6.2.3. Food and Beverage
- 6.2.4. Oil and Gas
- 6.2.5. Metal Manufacturing and Fabrication
- 6.2.6. Medical and Pharmaceutical
- 6.2.7. Automotive and Transportation
- 6.2.8. Energy and Power
- 6.2.9. Other End-user Industries
- 6.1. Market Analysis, Insights and Forecast - by Product Type
- 7. Asia Pacific Industrial Gas Market Analysis, Insights and Forecast, 2020-2032
- 7.1. Market Analysis, Insights and Forecast - by Product Type
- 7.1.1. Nitrogen
- 7.1.2. Oxygen
- 7.1.3. Carbon dioxide
- 7.1.4. Hydrogen
- 7.1.5. Helium
- 7.1.6. Argon
- 7.1.7. Ammonia
- 7.1.8. Methane
- 7.1.9. Propane
- 7.1.10. Butane
- 7.1.11. Other Product Types
- 7.2. Market Analysis, Insights and Forecast - by End-user Industry
- 7.2.1. Chemical Processing and Refining
- 7.2.2. Electronics
- 7.2.3. Food and Beverage
- 7.2.4. Oil and Gas
- 7.2.5. Metal Manufacturing and Fabrication
- 7.2.6. Medical and Pharmaceutical
- 7.2.7. Automotive and Transportation
- 7.2.8. Energy and Power
- 7.2.9. Other End-user Industries
- 7.1. Market Analysis, Insights and Forecast - by Product Type
- 8. North America Industrial Gas Market Analysis, Insights and Forecast, 2020-2032
- 8.1. Market Analysis, Insights and Forecast - by Product Type
- 8.1.1. Nitrogen
- 8.1.2. Oxygen
- 8.1.3. Carbon dioxide
- 8.1.4. Hydrogen
- 8.1.5. Helium
- 8.1.6. Argon
- 8.1.7. Ammonia
- 8.1.8. Methane
- 8.1.9. Propane
- 8.1.10. Butane
- 8.1.11. Other Product Types
- 8.2. Market Analysis, Insights and Forecast - by End-user Industry
- 8.2.1. Chemical Processing and Refining
- 8.2.2. Electronics
- 8.2.3. Food and Beverage
- 8.2.4. Oil and Gas
- 8.2.5. Metal Manufacturing and Fabrication
- 8.2.6. Medical and Pharmaceutical
- 8.2.7. Automotive and Transportation
- 8.2.8. Energy and Power
- 8.2.9. Other End-user Industries
- 8.1. Market Analysis, Insights and Forecast - by Product Type
- 9. Europe Industrial Gas Market Analysis, Insights and Forecast, 2020-2032
- 9.1. Market Analysis, Insights and Forecast - by Product Type
- 9.1.1. Nitrogen
- 9.1.2. Oxygen
- 9.1.3. Carbon dioxide
- 9.1.4. Hydrogen
- 9.1.5. Helium
- 9.1.6. Argon
- 9.1.7. Ammonia
- 9.1.8. Methane
- 9.1.9. Propane
- 9.1.10. Butane
- 9.1.11. Other Product Types
- 9.2. Market Analysis, Insights and Forecast - by End-user Industry
- 9.2.1. Chemical Processing and Refining
- 9.2.2. Electronics
- 9.2.3. Food and Beverage
- 9.2.4. Oil and Gas
- 9.2.5. Metal Manufacturing and Fabrication
- 9.2.6. Medical and Pharmaceutical
- 9.2.7. Automotive and Transportation
- 9.2.8. Energy and Power
- 9.2.9. Other End-user Industries
- 9.1. Market Analysis, Insights and Forecast - by Product Type
- 10. South America Industrial Gas Market Analysis, Insights and Forecast, 2020-2032
- 10.1. Market Analysis, Insights and Forecast - by Product Type
- 10.1.1. Nitrogen
- 10.1.2. Oxygen
- 10.1.3. Carbon dioxide
- 10.1.4. Hydrogen
- 10.1.5. Helium
- 10.1.6. Argon
- 10.1.7. Ammonia
- 10.1.8. Methane
- 10.1.9. Propane
- 10.1.10. Butane
- 10.1.11. Other Product Types
- 10.2. Market Analysis, Insights and Forecast - by End-user Industry
- 10.2.1. Chemical Processing and Refining
- 10.2.2. Electronics
- 10.2.3. Food and Beverage
- 10.2.4. Oil and Gas
- 10.2.5. Metal Manufacturing and Fabrication
- 10.2.6. Medical and Pharmaceutical
- 10.2.7. Automotive and Transportation
- 10.2.8. Energy and Power
- 10.2.9. Other End-user Industries
- 10.1. Market Analysis, Insights and Forecast - by Product Type
- 11. Middle East and Africa Industrial Gas Market Analysis, Insights and Forecast, 2020-2032
- 11.1. Market Analysis, Insights and Forecast - by Product Type
- 11.1.1. Nitrogen
- 11.1.2. Oxygen
- 11.1.3. Carbon dioxide
- 11.1.4. Hydrogen
- 11.1.5. Helium
- 11.1.6. Argon
- 11.1.7. Ammonia
- 11.1.8. Methane
- 11.1.9. Propane
- 11.1.10. Butane
- 11.1.11. Other Product Types
- 11.2. Market Analysis, Insights and Forecast - by End-user Industry
- 11.2.1. Chemical Processing and Refining
- 11.2.2. Electronics
- 11.2.3. Food and Beverage
- 11.2.4. Oil and Gas
- 11.2.5. Metal Manufacturing and Fabrication
- 11.2.6. Medical and Pharmaceutical
- 11.2.7. Automotive and Transportation
- 11.2.8. Energy and Power
- 11.2.9. Other End-user Industries
- 11.1. Market Analysis, Insights and Forecast - by Product Type
- 12. Competitive Analysis
- 12.1. Company Profiles
- 12.1.1 PT Samator Indo Gas TBK
- 12.1.1.1. Company Overview
- 12.1.1.2. Products
- 12.1.1.3. Company Financials
- 12.1.1.4. SWOT Analysis
- 12.1.2 Linde PLC
- 12.1.2.1. Company Overview
- 12.1.2.2. Products
- 12.1.2.3. Company Financials
- 12.1.2.4. SWOT Analysis
- 12.1.3 Ellenbarrie industrial Gases
- 12.1.3.1. Company Overview
- 12.1.3.2. Products
- 12.1.3.3. Company Financials
- 12.1.3.4. SWOT Analysis
- 12.1.4 Air Products and Chemicals Inc
- 12.1.4.1. Company Overview
- 12.1.4.2. Products
- 12.1.4.3. Company Financials
- 12.1.4.4. SWOT Analysis
- 12.1.5 Gruppo SIAD
- 12.1.5.1. Company Overview
- 12.1.5.2. Products
- 12.1.5.3. Company Financials
- 12.1.5.4. SWOT Analysis
- 12.1.6 Bhuruka Gases Limited
- 12.1.6.1. Company Overview
- 12.1.6.2. Products
- 12.1.6.3. Company Financials
- 12.1.6.4. SWOT Analysis
- 12.1.7 BASF SE
- 12.1.7.1. Company Overview
- 12.1.7.2. Products
- 12.1.7.3. Company Financials
- 12.1.7.4. SWOT Analysis
- 12.1.8 Iwatani Corporation
- 12.1.8.1. Company Overview
- 12.1.8.2. Products
- 12.1.8.3. Company Financials
- 12.1.8.4. SWOT Analysis
- 12.1.9 Asia Technical Gas Co Pte Ltd
- 12.1.9.1. Company Overview
- 12.1.9.2. Products
- 12.1.9.3. Company Financials
- 12.1.9.4. SWOT Analysis
- 12.1.10 Sapio Group
- 12.1.10.1. Company Overview
- 12.1.10.2. Products
- 12.1.10.3. Company Financials
- 12.1.10.4. SWOT Analysis
- 12.1.11 Messer Group GmbH
- 12.1.11.1. Company Overview
- 12.1.11.2. Products
- 12.1.11.3. Company Financials
- 12.1.11.4. SWOT Analysis
- 12.1.12 Yingde Gases Group*List Not Exhaustive
- 12.1.12.1. Company Overview
- 12.1.12.2. Products
- 12.1.12.3. Company Financials
- 12.1.12.4. SWOT Analysis
- 12.1.13 Air Liquide
- 12.1.13.1. Company Overview
- 12.1.13.2. Products
- 12.1.13.3. Company Financials
- 12.1.13.4. SWOT Analysis
- 12.1.14 Nippon Sanso Holdings Corporation
- 12.1.14.1. Company Overview
- 12.1.14.2. Products
- 12.1.14.3. Company Financials
- 12.1.14.4. SWOT Analysis
- 12.1.15 SOL SPA
- 12.1.15.1. Company Overview
- 12.1.15.2. Products
- 12.1.15.3. Company Financials
- 12.1.15.4. SWOT Analysis
- 12.1.1 PT Samator Indo Gas TBK
- 12.2. Market Entropy
- 12.2.1 Company's Key Areas Served
- 12.2.2 Recent Developments
- 12.3. Company Market Share Analysis 2025
- 12.3.1 Top 5 Companies Market Share Analysis
- 12.3.2 Top 3 Companies Market Share Analysis
- 12.4. List of Potential Customers
- 13. Research Methodology
List of Figures
- Figure 1: Global Industrial Gas Market Revenue Breakdown (billion, %) by Region 2025 & 2033
- Figure 2: Global Industrial Gas Market Volume Breakdown (K Tons, %) by Region 2025 & 2033
- Figure 3: Asia Pacific Industrial Gas Market Revenue (billion), by Product Type 2025 & 2033
- Figure 4: Asia Pacific Industrial Gas Market Volume (K Tons), by Product Type 2025 & 2033
- Figure 5: Asia Pacific Industrial Gas Market Revenue Share (%), by Product Type 2025 & 2033
- Figure 6: Asia Pacific Industrial Gas Market Volume Share (%), by Product Type 2025 & 2033
- Figure 7: Asia Pacific Industrial Gas Market Revenue (billion), by End-user Industry 2025 & 2033
- Figure 8: Asia Pacific Industrial Gas Market Volume (K Tons), by End-user Industry 2025 & 2033
- Figure 9: Asia Pacific Industrial Gas Market Revenue Share (%), by End-user Industry 2025 & 2033
- Figure 10: Asia Pacific Industrial Gas Market Volume Share (%), by End-user Industry 2025 & 2033
- Figure 11: Asia Pacific Industrial Gas Market Revenue (billion), by Country 2025 & 2033
- Figure 12: Asia Pacific Industrial Gas Market Volume (K Tons), by Country 2025 & 2033
- Figure 13: Asia Pacific Industrial Gas Market Revenue Share (%), by Country 2025 & 2033
- Figure 14: Asia Pacific Industrial Gas Market Volume Share (%), by Country 2025 & 2033
- Figure 15: North America Industrial Gas Market Revenue (billion), by Product Type 2025 & 2033
- Figure 16: North America Industrial Gas Market Volume (K Tons), by Product Type 2025 & 2033
- Figure 17: North America Industrial Gas Market Revenue Share (%), by Product Type 2025 & 2033
- Figure 18: North America Industrial Gas Market Volume Share (%), by Product Type 2025 & 2033
- Figure 19: North America Industrial Gas Market Revenue (billion), by End-user Industry 2025 & 2033
- Figure 20: North America Industrial Gas Market Volume (K Tons), by End-user Industry 2025 & 2033
- Figure 21: North America Industrial Gas Market Revenue Share (%), by End-user Industry 2025 & 2033
- Figure 22: North America Industrial Gas Market Volume Share (%), by End-user Industry 2025 & 2033
- Figure 23: North America Industrial Gas Market Revenue (billion), by Country 2025 & 2033
- Figure 24: North America Industrial Gas Market Volume (K Tons), by Country 2025 & 2033
- Figure 25: North America Industrial Gas Market Revenue Share (%), by Country 2025 & 2033
- Figure 26: North America Industrial Gas Market Volume Share (%), by Country 2025 & 2033
- Figure 27: Europe Industrial Gas Market Revenue (billion), by Product Type 2025 & 2033
- Figure 28: Europe Industrial Gas Market Volume (K Tons), by Product Type 2025 & 2033
- Figure 29: Europe Industrial Gas Market Revenue Share (%), by Product Type 2025 & 2033
- Figure 30: Europe Industrial Gas Market Volume Share (%), by Product Type 2025 & 2033
- Figure 31: Europe Industrial Gas Market Revenue (billion), by End-user Industry 2025 & 2033
- Figure 32: Europe Industrial Gas Market Volume (K Tons), by End-user Industry 2025 & 2033
- Figure 33: Europe Industrial Gas Market Revenue Share (%), by End-user Industry 2025 & 2033
- Figure 34: Europe Industrial Gas Market Volume Share (%), by End-user Industry 2025 & 2033
- Figure 35: Europe Industrial Gas Market Revenue (billion), by Country 2025 & 2033
- Figure 36: Europe Industrial Gas Market Volume (K Tons), by Country 2025 & 2033
- Figure 37: Europe Industrial Gas Market Revenue Share (%), by Country 2025 & 2033
- Figure 38: Europe Industrial Gas Market Volume Share (%), by Country 2025 & 2033
- Figure 39: South America Industrial Gas Market Revenue (billion), by Product Type 2025 & 2033
- Figure 40: South America Industrial Gas Market Volume (K Tons), by Product Type 2025 & 2033
- Figure 41: South America Industrial Gas Market Revenue Share (%), by Product Type 2025 & 2033
- Figure 42: South America Industrial Gas Market Volume Share (%), by Product Type 2025 & 2033
- Figure 43: South America Industrial Gas Market Revenue (billion), by End-user Industry 2025 & 2033
- Figure 44: South America Industrial Gas Market Volume (K Tons), by End-user Industry 2025 & 2033
- Figure 45: South America Industrial Gas Market Revenue Share (%), by End-user Industry 2025 & 2033
- Figure 46: South America Industrial Gas Market Volume Share (%), by End-user Industry 2025 & 2033
- Figure 47: South America Industrial Gas Market Revenue (billion), by Country 2025 & 2033
- Figure 48: South America Industrial Gas Market Volume (K Tons), by Country 2025 & 2033
- Figure 49: South America Industrial Gas Market Revenue Share (%), by Country 2025 & 2033
- Figure 50: South America Industrial Gas Market Volume Share (%), by Country 2025 & 2033
- Figure 51: Middle East and Africa Industrial Gas Market Revenue (billion), by Product Type 2025 & 2033
- Figure 52: Middle East and Africa Industrial Gas Market Volume (K Tons), by Product Type 2025 & 2033
- Figure 53: Middle East and Africa Industrial Gas Market Revenue Share (%), by Product Type 2025 & 2033
- Figure 54: Middle East and Africa Industrial Gas Market Volume Share (%), by Product Type 2025 & 2033
- Figure 55: Middle East and Africa Industrial Gas Market Revenue (billion), by End-user Industry 2025 & 2033
- Figure 56: Middle East and Africa Industrial Gas Market Volume (K Tons), by End-user Industry 2025 & 2033
- Figure 57: Middle East and Africa Industrial Gas Market Revenue Share (%), by End-user Industry 2025 & 2033
- Figure 58: Middle East and Africa Industrial Gas Market Volume Share (%), by End-user Industry 2025 & 2033
- Figure 59: Middle East and Africa Industrial Gas Market Revenue (billion), by Country 2025 & 2033
- Figure 60: Middle East and Africa Industrial Gas Market Volume (K Tons), by Country 2025 & 2033
- Figure 61: Middle East and Africa Industrial Gas Market Revenue Share (%), by Country 2025 & 2033
- Figure 62: Middle East and Africa Industrial Gas Market Volume Share (%), by Country 2025 & 2033
List of Tables
- Table 1: Global Industrial Gas Market Revenue billion Forecast, by Product Type 2020 & 2033
- Table 2: Global Industrial Gas Market Volume K Tons Forecast, by Product Type 2020 & 2033
- Table 3: Global Industrial Gas Market Revenue billion Forecast, by End-user Industry 2020 & 2033
- Table 4: Global Industrial Gas Market Volume K Tons Forecast, by End-user Industry 2020 & 2033
- Table 5: Global Industrial Gas Market Revenue billion Forecast, by Region 2020 & 2033
- Table 6: Global Industrial Gas Market Volume K Tons Forecast, by Region 2020 & 2033
- Table 7: Global Industrial Gas Market Revenue billion Forecast, by Product Type 2020 & 2033
- Table 8: Global Industrial Gas Market Volume K Tons Forecast, by Product Type 2020 & 2033
- Table 9: Global Industrial Gas Market Revenue billion Forecast, by End-user Industry 2020 & 2033
- Table 10: Global Industrial Gas Market Volume K Tons Forecast, by End-user Industry 2020 & 2033
- Table 11: Global Industrial Gas Market Revenue billion Forecast, by Country 2020 & 2033
- Table 12: Global Industrial Gas Market Volume K Tons Forecast, by Country 2020 & 2033
- Table 13: China Industrial Gas Market Revenue (billion) Forecast, by Application 2020 & 2033
- Table 14: China Industrial Gas Market Volume (K Tons) Forecast, by Application 2020 & 2033
- Table 15: India Industrial Gas Market Revenue (billion) Forecast, by Application 2020 & 2033
- Table 16: India Industrial Gas Market Volume (K Tons) Forecast, by Application 2020 & 2033
- Table 17: Japan Industrial Gas Market Revenue (billion) Forecast, by Application 2020 & 2033
- Table 18: Japan Industrial Gas Market Volume (K Tons) Forecast, by Application 2020 & 2033
- Table 19: South Korea Industrial Gas Market Revenue (billion) Forecast, by Application 2020 & 2033
- Table 20: South Korea Industrial Gas Market Volume (K Tons) Forecast, by Application 2020 & 2033
- Table 21: ASEAN Countries Industrial Gas Market Revenue (billion) Forecast, by Application 2020 & 2033
- Table 22: ASEAN Countries Industrial Gas Market Volume (K Tons) Forecast, by Application 2020 & 2033
- Table 23: Rest of Asia Pacific Industrial Gas Market Revenue (billion) Forecast, by Application 2020 & 2033
- Table 24: Rest of Asia Pacific Industrial Gas Market Volume (K Tons) Forecast, by Application 2020 & 2033
- Table 25: Global Industrial Gas Market Revenue billion Forecast, by Product Type 2020 & 2033
- Table 26: Global Industrial Gas Market Volume K Tons Forecast, by Product Type 2020 & 2033
- Table 27: Global Industrial Gas Market Revenue billion Forecast, by End-user Industry 2020 & 2033
- Table 28: Global Industrial Gas Market Volume K Tons Forecast, by End-user Industry 2020 & 2033
- Table 29: Global Industrial Gas Market Revenue billion Forecast, by Country 2020 & 2033
- Table 30: Global Industrial Gas Market Volume K Tons Forecast, by Country 2020 & 2033
- Table 31: United States Industrial Gas Market Revenue (billion) Forecast, by Application 2020 & 2033
- Table 32: United States Industrial Gas Market Volume (K Tons) Forecast, by Application 2020 & 2033
- Table 33: Canada Industrial Gas Market Revenue (billion) Forecast, by Application 2020 & 2033
- Table 34: Canada Industrial Gas Market Volume (K Tons) Forecast, by Application 2020 & 2033
- Table 35: Mexico Industrial Gas Market Revenue (billion) Forecast, by Application 2020 & 2033
- Table 36: Mexico Industrial Gas Market Volume (K Tons) Forecast, by Application 2020 & 2033
- Table 37: Global Industrial Gas Market Revenue billion Forecast, by Product Type 2020 & 2033
- Table 38: Global Industrial Gas Market Volume K Tons Forecast, by Product Type 2020 & 2033
- Table 39: Global Industrial Gas Market Revenue billion Forecast, by End-user Industry 2020 & 2033
- Table 40: Global Industrial Gas Market Volume K Tons Forecast, by End-user Industry 2020 & 2033
- Table 41: Global Industrial Gas Market Revenue billion Forecast, by Country 2020 & 2033
- Table 42: Global Industrial Gas Market Volume K Tons Forecast, by Country 2020 & 2033
- Table 43: Germany Industrial Gas Market Revenue (billion) Forecast, by Application 2020 & 2033
- Table 44: Germany Industrial Gas Market Volume (K Tons) Forecast, by Application 2020 & 2033
- Table 45: United Kingdom Industrial Gas Market Revenue (billion) Forecast, by Application 2020 & 2033
- Table 46: United Kingdom Industrial Gas Market Volume (K Tons) Forecast, by Application 2020 & 2033
- Table 47: France Industrial Gas Market Revenue (billion) Forecast, by Application 2020 & 2033
- Table 48: France Industrial Gas Market Volume (K Tons) Forecast, by Application 2020 & 2033
- Table 49: Italy Industrial Gas Market Revenue (billion) Forecast, by Application 2020 & 2033
- Table 50: Italy Industrial Gas Market Volume (K Tons) Forecast, by Application 2020 & 2033
- Table 51: NORDIC Countries Industrial Gas Market Revenue (billion) Forecast, by Application 2020 & 2033
- Table 52: NORDIC Countries Industrial Gas Market Volume (K Tons) Forecast, by Application 2020 & 2033
- Table 53: Rest of Europe Industrial Gas Market Revenue (billion) Forecast, by Application 2020 & 2033
- Table 54: Rest of Europe Industrial Gas Market Volume (K Tons) Forecast, by Application 2020 & 2033
- Table 55: Global Industrial Gas Market Revenue billion Forecast, by Product Type 2020 & 2033
- Table 56: Global Industrial Gas Market Volume K Tons Forecast, by Product Type 2020 & 2033
- Table 57: Global Industrial Gas Market Revenue billion Forecast, by End-user Industry 2020 & 2033
- Table 58: Global Industrial Gas Market Volume K Tons Forecast, by End-user Industry 2020 & 2033
- Table 59: Global Industrial Gas Market Revenue billion Forecast, by Country 2020 & 2033
- Table 60: Global Industrial Gas Market Volume K Tons Forecast, by Country 2020 & 2033
- Table 61: Brazil Industrial Gas Market Revenue (billion) Forecast, by Application 2020 & 2033
- Table 62: Brazil Industrial Gas Market Volume (K Tons) Forecast, by Application 2020 & 2033
- Table 63: Argentina Industrial Gas Market Revenue (billion) Forecast, by Application 2020 & 2033
- Table 64: Argentina Industrial Gas Market Volume (K Tons) Forecast, by Application 2020 & 2033
- Table 65: Rest of South America Industrial Gas Market Revenue (billion) Forecast, by Application 2020 & 2033
- Table 66: Rest of South America Industrial Gas Market Volume (K Tons) Forecast, by Application 2020 & 2033
- Table 67: Global Industrial Gas Market Revenue billion Forecast, by Product Type 2020 & 2033
- Table 68: Global Industrial Gas Market Volume K Tons Forecast, by Product Type 2020 & 2033
- Table 69: Global Industrial Gas Market Revenue billion Forecast, by End-user Industry 2020 & 2033
- Table 70: Global Industrial Gas Market Volume K Tons Forecast, by End-user Industry 2020 & 2033
- Table 71: Global Industrial Gas Market Revenue billion Forecast, by Country 2020 & 2033
- Table 72: Global Industrial Gas Market Volume K Tons Forecast, by Country 2020 & 2033
- Table 73: Saudi Arabia Industrial Gas Market Revenue (billion) Forecast, by Application 2020 & 2033
- Table 74: Saudi Arabia Industrial Gas Market Volume (K Tons) Forecast, by Application 2020 & 2033
- Table 75: South Africa Industrial Gas Market Revenue (billion) Forecast, by Application 2020 & 2033
- Table 76: South Africa Industrial Gas Market Volume (K Tons) Forecast, by Application 2020 & 2033
- Table 77: Rest of Middle East and Africa Industrial Gas Market Revenue (billion) Forecast, by Application 2020 & 2033
- Table 78: Rest of Middle East and Africa Industrial Gas Market Volume (K Tons) Forecast, by Application 2020 & 2033
Frequently Asked Questions
1. What is the projected Compound Annual Growth Rate (CAGR) of the Industrial Gas Market?
The projected CAGR is approximately 4.4%.
2. Which companies are prominent players in the Industrial Gas Market?
Key companies in the market include PT Samator Indo Gas TBK, Linde PLC, Ellenbarrie industrial Gases, Air Products and Chemicals Inc, Gruppo SIAD, Bhuruka Gases Limited, BASF SE, Iwatani Corporation, Asia Technical Gas Co Pte Ltd, Sapio Group, Messer Group GmbH, Yingde Gases Group*List Not Exhaustive, Air Liquide, Nippon Sanso Holdings Corporation, SOL SPA.
3. What are the main segments of the Industrial Gas Market?
The market segments include Product Type, End-user Industry.
4. Can you provide details about the market size?
The market size is estimated to be USD 119.11 billion as of 2022.
5. What are some drivers contributing to market growth?
Growing Need for Alternate Energy Sources; Increasing Demand For Frozen and Stored Food; Increasing Demand from the Healthcare Sector.
6. What are the notable trends driving market growth?
Increasing Demand from the Medical and Pharmaceutical Sector.
7. Are there any restraints impacting market growth?
Environmental Regulations and Safety Issues; Other Restraints.
8. Can you provide examples of recent developments in the market?
April 2023: Nippon Gases Operations, a division of Nippon Gases Italia, announced the signing of an agreement with Enel Green Power Italia to construct a new plant for the reuse, purification, and liquefaction of CO2, naturally present in the geothermal fluids of the Piancastagnaio power plants in the province of Siena for food purposes. The significant investment is part of a series of operations planned by the company in Italy to improve production capacity, competitiveness, and customer closeness, emphasizing long-term growth.
9. What pricing options are available for accessing the report?
Pricing options include single-user, multi-user, and enterprise licenses priced at USD 4750, USD 5250, and USD 8750 respectively.
10. Is the market size provided in terms of value or volume?
The market size is provided in terms of value, measured in billion and volume, measured in K Tons.
11. Are there any specific market keywords associated with the report?
Yes, the market keyword associated with the report is "Industrial Gas Market," which aids in identifying and referencing the specific market segment covered.
12. How do I determine which pricing option suits my needs best?
The pricing options vary based on user requirements and access needs. Individual users may opt for single-user licenses, while businesses requiring broader access may choose multi-user or enterprise licenses for cost-effective access to the report.
13. Are there any additional resources or data provided in the Industrial Gas Market report?
While the report offers comprehensive insights, it's advisable to review the specific contents or supplementary materials provided to ascertain if additional resources or data are available.
14. How can I stay updated on further developments or reports in the Industrial Gas Market?
To stay informed about further developments, trends, and reports in the Industrial Gas Market, consider subscribing to industry newsletters, following relevant companies and organizations, or regularly checking reputable industry news sources and publications.
Methodology
Step 1 - Identification of Relevant Samples Size from Population Database


Step 2 - Approaches for Defining Global Market Size (Value, Volume* & Price*)

Note*: In applicable scenarios
Step 3 - Data Sources
Primary Research
- Web Analytics
- Survey Reports
- Research Institute
- Latest Research Reports
- Opinion Leaders
Secondary Research
- Annual Reports
- White Paper
- Latest Press Release
- Industry Association
- Paid Database
- Investor Presentations

Step 4 - Data Triangulation
Involves using different sources of information in order to increase the validity of a study
These sources are likely to be stakeholders in a program - participants, other researchers, program staff, other community members, and so on.
Then we put all data in single framework & apply various statistical tools to find out the dynamic on the market.
During the analysis stage, feedback from the stakeholder groups would be compared to determine areas of agreement as well as areas of divergence