

Key Insights
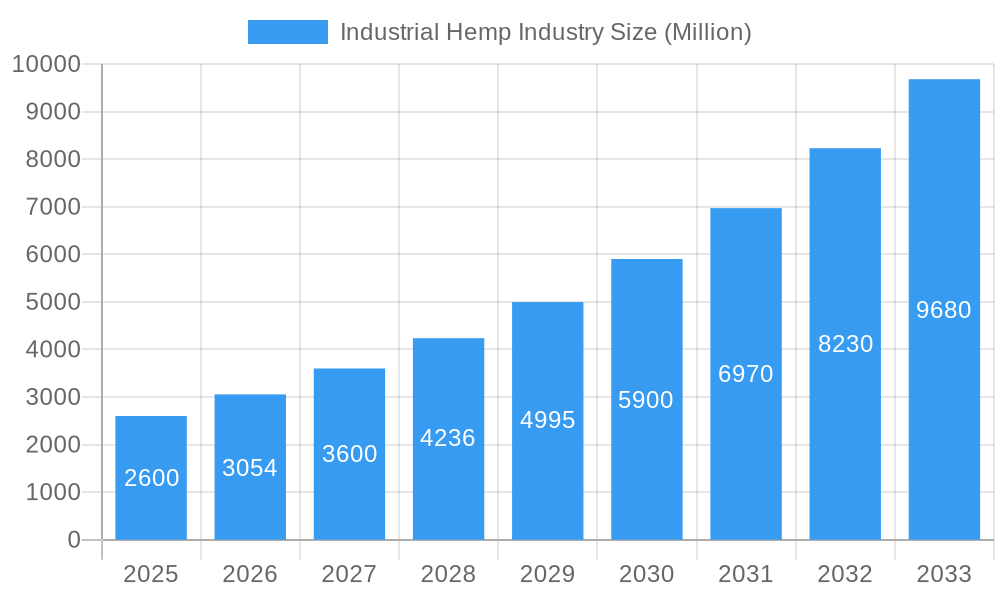
The industrial hemp market, valued at $2.6 billion in 2025, is experiencing robust growth, projected to expand at a Compound Annual Growth Rate (CAGR) exceeding 17% from 2025 to 2033. This significant expansion is driven by increasing demand across diverse sectors. The burgeoning CBD market, fueled by consumer interest in wellness and alternative health solutions, is a primary growth catalyst. Furthermore, the utilization of hemp in textiles, construction materials (hempcrete), and bioplastics is gaining momentum, contributing to the market's overall expansion. Government regulations and policies supporting hemp cultivation and processing are also crucial enablers, fostering innovation and investment within the industry. While challenges remain, such as navigating evolving regulatory landscapes and ensuring consistent product quality, the overall market outlook is overwhelmingly positive.
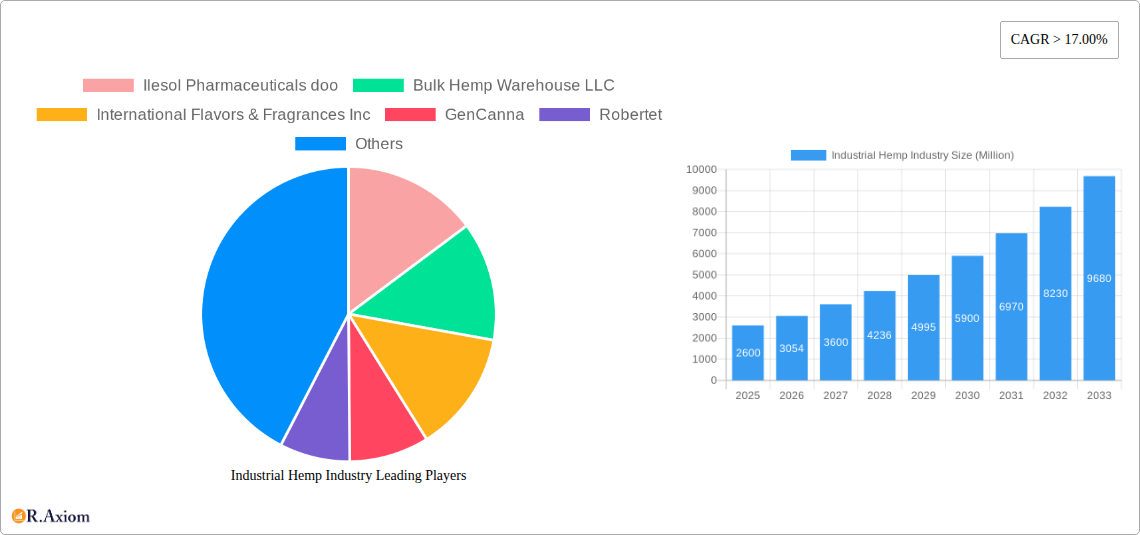
Industrial Hemp Industry Market Size (In Billion)
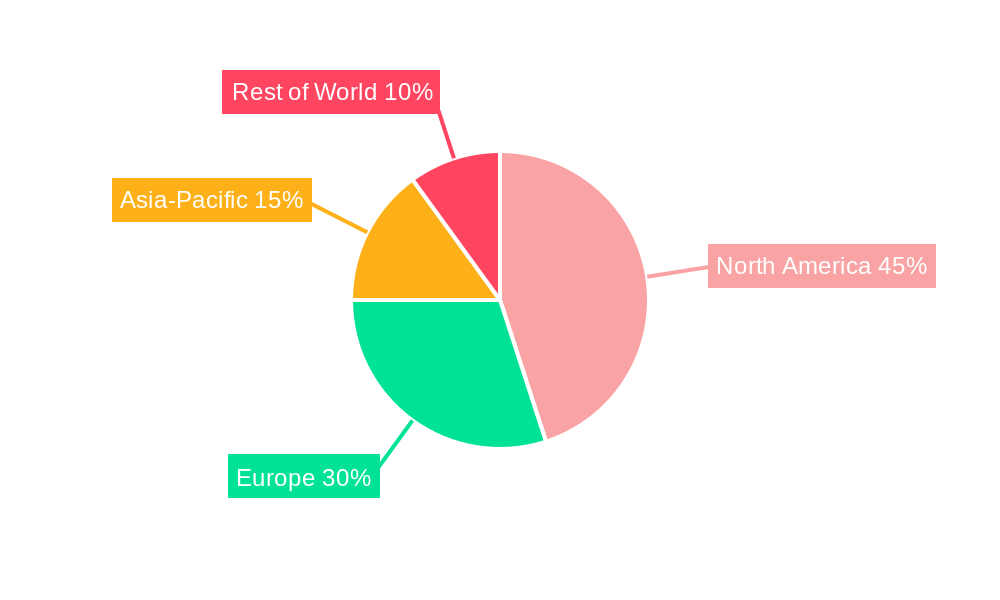
The competitive landscape is characterized by a mix of established players and emerging businesses. Large multinational companies like International Flavors & Fragrances Inc. and Firmenich SA are leveraging their expertise in flavor and fragrance development to capitalize on the hemp market's potential. Simultaneously, smaller companies specializing in hemp cultivation, extraction, and processing are driving innovation and catering to niche market segments. The geographic distribution of the market is expected to be diverse, with North America and Europe currently holding significant market shares, but growth opportunities exist in Asia-Pacific and other regions as consumer awareness and regulatory frameworks evolve. The forecast suggests a substantial increase in market value by 2033, indicating a lucrative and rapidly expanding market with significant potential for further growth and diversification of product applications.
Industrial Hemp Industry Company Market Share
Industrial Hemp Industry: A Comprehensive Market Report (2019-2033)
This in-depth report provides a comprehensive analysis of the Industrial Hemp Industry, covering market trends, competitive landscape, growth drivers, and future outlook from 2019 to 2033. The report leverages extensive data analysis and expert insights to offer actionable intelligence for industry stakeholders, investors, and businesses seeking to capitalize on this rapidly evolving sector. The study period spans 2019-2033, with 2025 as the base and estimated year. The forecast period is 2025-2033 and the historical period is 2019-2024. Projected market values are presented in Millions.
Industrial Hemp Industry Market Concentration & Innovation
This section analyzes the market concentration, innovation drivers, regulatory landscapes, product substitutes, end-user trends, and mergers and acquisitions (M&A) activities within the industrial hemp industry. The highly fragmented nature of the market is characterized by a large number of players, each vying for market share. However, some companies are emerging as key players through strategic acquisitions and innovation.
Market Concentration: The industrial hemp market exhibits a moderately fragmented structure, with no single dominant player commanding a significant market share exceeding xx%. Competition is intense, particularly amongst producers of CBD products.
Innovation Drivers: Significant innovation is fueled by the development of new extraction techniques, product formulations, and applications across diverse sectors. This includes advancements in genetic engineering for enhanced yield and cannabinoid profiles.
Regulatory Frameworks: Varying regulatory landscapes across different regions significantly influence market dynamics and investment decisions. Inconsistencies create challenges for companies operating internationally.
Product Substitutes: The market faces competition from synthetic alternatives and existing materials used in similar applications, which affect overall market penetration.
End-User Trends: Growing consumer demand for natural and sustainable products, coupled with increasing awareness of hemp's health and wellness benefits, drives significant market growth.
M&A Activities: The industrial hemp industry has witnessed a notable increase in M&A activity, with deals primarily focused on consolidation and vertical integration. For example, the combined value of M&A deals in the past five years is estimated at $xx Million. Key acquisitions include MariMed Inc.'s acquisition of Green Growth Group Inc. and Kind Therapeutics USA LLC in January 2022.
Industrial Hemp Industry Industry Trends & Insights
The industrial hemp market is experiencing robust growth, driven by a confluence of factors. The compound annual growth rate (CAGR) during the forecast period (2025-2033) is projected at xx%. Market penetration is increasing steadily across various applications.
Technological disruptions are transforming the sector, particularly in cultivation practices and extraction methods. Consumer preferences are shifting toward higher-quality, sustainably sourced hemp products, influencing product development and marketing strategies. Competitive dynamics are shaped by pricing pressures, innovation, and market access, leading to strategic alliances and acquisitions.
Dominant Markets & Segments in Industrial Hemp Industry
The North American market, particularly the United States and Canada, currently dominates the global industrial hemp industry. This dominance is primarily attributed to supportive regulatory environments, well-established agricultural infrastructure, and significant consumer demand.
- Key Drivers for North American Dominance:
- Supportive government policies and legislation: Changes in legal frameworks have enabled substantial growth within the region.
- Advanced agricultural infrastructure: Existing farming techniques and infrastructure allow for efficient hemp cultivation.
- Strong consumer demand: Consumer acceptance of hemp products, including CBD, fuels considerable market growth.
Other regions, including Europe and parts of Asia, exhibit significant growth potential, although market development is hampered by regulatory uncertainties and infrastructure limitations in some areas.
Industrial Hemp Industry Product Developments
The industrial hemp sector is experiencing rapid product innovation, driven by the versatility of the plant. New applications are continuously emerging, expanding beyond traditional uses to encompass textiles, construction materials, food and beverages, cosmetics, and pharmaceuticals. This progress is propelled by advancements in extraction techniques, leading to higher-quality, specialized products tailored to specific market needs and consumer preferences. Technological innovations in processing and refinement also enhance the range of possible applications.
Report Scope & Segmentation Analysis
This report segments the industrial hemp market based on several key factors. These include product type (e.g., CBD oil, hemp seeds, fiber, and others), application (e.g., food and beverages, cosmetics, textiles, construction, and pharmaceuticals), and geography (e.g., North America, Europe, Asia-Pacific, etc.). Growth projections vary among segments, with some enjoying faster growth than others. Market size estimates are provided for each segment across the forecast period. Competitive landscapes within individual segments also demonstrate variations in terms of concentration and intensity.
Key Drivers of Industrial Hemp Industry Growth
The growth of the industrial hemp industry is fueled by a combination of factors. Technological advancements in cultivation, extraction, and processing techniques lead to improved efficiency and product quality. Supportive government policies and regulatory changes in several regions create a more favorable investment environment. Growing consumer awareness and demand for natural and sustainable products enhance market penetration. The versatility of hemp, allowing applications across various sectors, significantly contributes to its rising popularity.
Challenges in the Industrial Hemp Industry Sector
Despite the considerable potential, the industrial hemp industry faces several challenges. Regulatory uncertainties and inconsistencies across different jurisdictions create obstacles for businesses. Supply chain complexities, including cultivation, processing, and distribution, pose logistical hurdles. Competition from established industries and synthetic alternatives requires strategic positioning and differentiation.
Emerging Opportunities in Industrial Hemp Industry
The industrial hemp industry presents several significant emerging opportunities. Expansion into new markets and applications is a key area for growth. Innovation in biotechnology and genetic engineering can further enhance yield and product quality. The increasing adoption of sustainable and eco-friendly practices resonates well with consumer preferences. These opportunities offer strong potential for market expansion and diversification.
Leading Players in the Industrial Hemp Industry Market
- Ilesol Pharmaceuticals doo
- Bulk Hemp Warehouse LLC
- International Flavors & Fragrances Inc
- GenCanna
- Robertet
- Firmenich SA
- Charlotte's Web Holdings Inc
- True Terpenes
- Puricon
- PharmaCielo Ltd
- Silver Lion Farms
- Bomar Agra Estates LLC
- Colorado Breeders Depot
- 33 Supply LLC
- Green Passion (Canway Schweiz GmbH)
- Victory Hemp Foods
- Hemp Oil Canada
- Manitoba Harvest (Tilray)
- HempFlax Group BV
- Entoura
- Bedrocan
- Signature Products
- Nutiva hemp Oil
- Temp Co Canada
- Hemp Acres USA
- List Not Exhaustive
Key Developments in Industrial Hemp Industry Industry
January 2022: MariMed Inc. signed a definitive agreement to acquire Green Growth Group Inc., holder of a provisional Cannabis Craft License in Illinois. This acquisition expanded MariMed's presence in the Illinois cannabis market.
January 2022: MariMed Inc. entered a definitive agreement to acquire Kind Therapeutics USA LLC, a leading vertically integrated cannabis business in Maryland. This strategic move strengthened MariMed's position in the Maryland cannabis market, enhancing its vertical integration capabilities.
Strategic Outlook for Industrial Hemp Industry Market
The industrial hemp market is poised for substantial growth in the coming years, driven by technological advancements, expanding applications, and increasing consumer acceptance. Strategic investments in research and development, coupled with a focus on sustainability and responsible sourcing, are crucial for long-term success. The market presents significant opportunities for companies to capitalize on the growing demand for hemp-based products across diverse sectors.
Industrial Hemp Industry Segmentation
-
1. Type
- 1.1. Hemp Seed (Consumed Raw, Cooked or Roasted)
- 1.2. Hemp Seed Oil
- 1.3. Cannabidiol (CBD) Hemp Oil
- 1.4. Hemp Protein (Supplement)
- 1.5. Hemp Extract (Without CBD)
-
2. Application
- 2.1. Food and Beverages
- 2.2. Healthcare Supplements
- 2.3. Other Applications
Industrial Hemp Industry Segmentation By Geography
-
1. Asia Pacific
- 1.1. China
- 1.2. India
- 1.3. Japan
- 1.4. South Korea
- 1.5. Malaysia
- 1.6. Thailand
- 1.7. Indonesia
- 1.8. Vietnam
- 1.9. Rest of Asia Pacific
-
2. North America
- 2.1. United States
- 2.2. Canada
- 2.3. Mexico
-
3. Europe
- 3.1. Germany
- 3.2. United Kingdom
- 3.3. France
- 3.4. Italy
- 3.5. Spain
- 3.6. Turkey
- 3.7. Russia
- 3.8. NORDIC Countries
- 3.9. Rest of Europe
-
4. South America
- 4.1. Brazil
- 4.2. Argentina
- 4.3. Colombia
- 4.4. Rest of South America
-
5. Middle East and Africa
- 5.1. Saudi Arabia
- 5.2. Nigeria
- 5.3. Qatar
- 5.4. Egypt
- 5.5. United Arab Emirates
- 5.6. South Africa
- 5.7. Rest of Middle East and Africa
Industrial Hemp Industry Regional Market Share
Geographic Coverage of Industrial Hemp Industry
Industrial Hemp Industry REPORT HIGHLIGHTS
| Aspects | Details |
|---|---|
| Study Period | 2020-2034 |
| Base Year | 2025 |
| Estimated Year | 2026 |
| Forecast Period | 2026-2034 |
| Historical Period | 2020-2025 |
| Growth Rate | CAGR of > 17.00% from 2020-2034 |
| Segmentation |
|
Table of Contents
- 1. Introduction
- 1.1. Research Scope
- 1.2. Market Segmentation
- 1.3. Research Objective
- 1.4. Definitions and Assumptions
- 2. Executive Summary
- 2.1. Market Snapshot
- 3. Market Dynamics
- 3.1. Market Drivers
- 3.2. Market Restrains
- 3.3. Market Trends
- 3.4. Market Opportunities
- 4. Market Factor Analysis
- 4.1. Porters Five Forces
- 4.1.1. Bargaining Power of Suppliers
- 4.1.2. Bargaining Power of Buyers
- 4.1.3. Threat of New Entrants
- 4.1.4. Threat of Substitutes
- 4.1.5. Competitive Rivalry
- 4.2. PESTEL analysis
- 4.3. BCG Analysis
- 4.3.1. Stars (High Growth, High Market Share)
- 4.3.2. Cash Cows (Low Growth, High Market Share)
- 4.3.3. Question Mark (High Growth, Low Market Share)
- 4.3.4. Dogs (Low Growth, Low Market Share)
- 4.4. Ansoff Matrix Analysis
- 4.5. Supply Chain Analysis
- 4.6. Regulatory Landscape
- 4.7. Current Market Potential and Opportunity Assessment (TAM–SAM–SOM Framework)
- 4.8. RAX Analyst Note
- 4.1. Porters Five Forces
- 5. Market Analysis, Insights and Forecast 2021-2033
- 5.1. Market Analysis, Insights and Forecast - by Type
- 5.1.1. Hemp Seed (Consumed Raw, Cooked or Roasted)
- 5.1.2. Hemp Seed Oil
- 5.1.3. Cannabidiol (CBD) Hemp Oil
- 5.1.4. Hemp Protein (Supplement)
- 5.1.5. Hemp Extract (Without CBD)
- 5.2. Market Analysis, Insights and Forecast - by Application
- 5.2.1. Food and Beverages
- 5.2.2. Healthcare Supplements
- 5.2.3. Other Applications
- 5.3. Market Analysis, Insights and Forecast - by Region
- 5.3.1. Asia Pacific
- 5.3.2. North America
- 5.3.3. Europe
- 5.3.4. South America
- 5.3.5. Middle East and Africa
- 5.1. Market Analysis, Insights and Forecast - by Type
- 6. Global Industrial Hemp Industry Analysis, Insights and Forecast, 2021-2033
- 6.1. Market Analysis, Insights and Forecast - by Type
- 6.1.1. Hemp Seed (Consumed Raw, Cooked or Roasted)
- 6.1.2. Hemp Seed Oil
- 6.1.3. Cannabidiol (CBD) Hemp Oil
- 6.1.4. Hemp Protein (Supplement)
- 6.1.5. Hemp Extract (Without CBD)
- 6.2. Market Analysis, Insights and Forecast - by Application
- 6.2.1. Food and Beverages
- 6.2.2. Healthcare Supplements
- 6.2.3. Other Applications
- 6.1. Market Analysis, Insights and Forecast - by Type
- 7. Asia Pacific Industrial Hemp Industry Analysis, Insights and Forecast, 2020-2032
- 7.1. Market Analysis, Insights and Forecast - by Type
- 7.1.1. Hemp Seed (Consumed Raw, Cooked or Roasted)
- 7.1.2. Hemp Seed Oil
- 7.1.3. Cannabidiol (CBD) Hemp Oil
- 7.1.4. Hemp Protein (Supplement)
- 7.1.5. Hemp Extract (Without CBD)
- 7.2. Market Analysis, Insights and Forecast - by Application
- 7.2.1. Food and Beverages
- 7.2.2. Healthcare Supplements
- 7.2.3. Other Applications
- 7.1. Market Analysis, Insights and Forecast - by Type
- 8. North America Industrial Hemp Industry Analysis, Insights and Forecast, 2020-2032
- 8.1. Market Analysis, Insights and Forecast - by Type
- 8.1.1. Hemp Seed (Consumed Raw, Cooked or Roasted)
- 8.1.2. Hemp Seed Oil
- 8.1.3. Cannabidiol (CBD) Hemp Oil
- 8.1.4. Hemp Protein (Supplement)
- 8.1.5. Hemp Extract (Without CBD)
- 8.2. Market Analysis, Insights and Forecast - by Application
- 8.2.1. Food and Beverages
- 8.2.2. Healthcare Supplements
- 8.2.3. Other Applications
- 8.1. Market Analysis, Insights and Forecast - by Type
- 9. Europe Industrial Hemp Industry Analysis, Insights and Forecast, 2020-2032
- 9.1. Market Analysis, Insights and Forecast - by Type
- 9.1.1. Hemp Seed (Consumed Raw, Cooked or Roasted)
- 9.1.2. Hemp Seed Oil
- 9.1.3. Cannabidiol (CBD) Hemp Oil
- 9.1.4. Hemp Protein (Supplement)
- 9.1.5. Hemp Extract (Without CBD)
- 9.2. Market Analysis, Insights and Forecast - by Application
- 9.2.1. Food and Beverages
- 9.2.2. Healthcare Supplements
- 9.2.3. Other Applications
- 9.1. Market Analysis, Insights and Forecast - by Type
- 10. South America Industrial Hemp Industry Analysis, Insights and Forecast, 2020-2032
- 10.1. Market Analysis, Insights and Forecast - by Type
- 10.1.1. Hemp Seed (Consumed Raw, Cooked or Roasted)
- 10.1.2. Hemp Seed Oil
- 10.1.3. Cannabidiol (CBD) Hemp Oil
- 10.1.4. Hemp Protein (Supplement)
- 10.1.5. Hemp Extract (Without CBD)
- 10.2. Market Analysis, Insights and Forecast - by Application
- 10.2.1. Food and Beverages
- 10.2.2. Healthcare Supplements
- 10.2.3. Other Applications
- 10.1. Market Analysis, Insights and Forecast - by Type
- 11. Middle East and Africa Industrial Hemp Industry Analysis, Insights and Forecast, 2020-2032
- 11.1. Market Analysis, Insights and Forecast - by Type
- 11.1.1. Hemp Seed (Consumed Raw, Cooked or Roasted)
- 11.1.2. Hemp Seed Oil
- 11.1.3. Cannabidiol (CBD) Hemp Oil
- 11.1.4. Hemp Protein (Supplement)
- 11.1.5. Hemp Extract (Without CBD)
- 11.2. Market Analysis, Insights and Forecast - by Application
- 11.2.1. Food and Beverages
- 11.2.2. Healthcare Supplements
- 11.2.3. Other Applications
- 11.1. Market Analysis, Insights and Forecast - by Type
- 12. Competitive Analysis
- 12.1. Company Profiles
- 12.1.1 Ilesol Pharmaceuticals doo
- 12.1.1.1. Company Overview
- 12.1.1.2. Products
- 12.1.1.3. Company Financials
- 12.1.1.4. SWOT Analysis
- 12.1.2 Bulk Hemp Warehouse LLC
- 12.1.2.1. Company Overview
- 12.1.2.2. Products
- 12.1.2.3. Company Financials
- 12.1.2.4. SWOT Analysis
- 12.1.3 International Flavors & Fragrances Inc
- 12.1.3.1. Company Overview
- 12.1.3.2. Products
- 12.1.3.3. Company Financials
- 12.1.3.4. SWOT Analysis
- 12.1.4 GenCanna
- 12.1.4.1. Company Overview
- 12.1.4.2. Products
- 12.1.4.3. Company Financials
- 12.1.4.4. SWOT Analysis
- 12.1.5 Robertet
- 12.1.5.1. Company Overview
- 12.1.5.2. Products
- 12.1.5.3. Company Financials
- 12.1.5.4. SWOT Analysis
- 12.1.6 Firmenich SA
- 12.1.6.1. Company Overview
- 12.1.6.2. Products
- 12.1.6.3. Company Financials
- 12.1.6.4. SWOT Analysis
- 12.1.7 Charlotte's Web Holdings Inc
- 12.1.7.1. Company Overview
- 12.1.7.2. Products
- 12.1.7.3. Company Financials
- 12.1.7.4. SWOT Analysis
- 12.1.8 True Terpenes
- 12.1.8.1. Company Overview
- 12.1.8.2. Products
- 12.1.8.3. Company Financials
- 12.1.8.4. SWOT Analysis
- 12.1.9 Puricon
- 12.1.9.1. Company Overview
- 12.1.9.2. Products
- 12.1.9.3. Company Financials
- 12.1.9.4. SWOT Analysis
- 12.1.10 PharmaCielo Ltd
- 12.1.10.1. Company Overview
- 12.1.10.2. Products
- 12.1.10.3. Company Financials
- 12.1.10.4. SWOT Analysis
- 12.1.11 Silver Lion Farms
- 12.1.11.1. Company Overview
- 12.1.11.2. Products
- 12.1.11.3. Company Financials
- 12.1.11.4. SWOT Analysis
- 12.1.12 Bomar Agra Estates LLC
- 12.1.12.1. Company Overview
- 12.1.12.2. Products
- 12.1.12.3. Company Financials
- 12.1.12.4. SWOT Analysis
- 12.1.13 Colorado Breeders Depot
- 12.1.13.1. Company Overview
- 12.1.13.2. Products
- 12.1.13.3. Company Financials
- 12.1.13.4. SWOT Analysis
- 12.1.14 33 Supply LLC
- 12.1.14.1. Company Overview
- 12.1.14.2. Products
- 12.1.14.3. Company Financials
- 12.1.14.4. SWOT Analysis
- 12.1.15 Green Passion (Canway Schweiz GmbH)
- 12.1.15.1. Company Overview
- 12.1.15.2. Products
- 12.1.15.3. Company Financials
- 12.1.15.4. SWOT Analysis
- 12.1.16 Victory Hemp Foods
- 12.1.16.1. Company Overview
- 12.1.16.2. Products
- 12.1.16.3. Company Financials
- 12.1.16.4. SWOT Analysis
- 12.1.17 Hemp Oil Canada
- 12.1.17.1. Company Overview
- 12.1.17.2. Products
- 12.1.17.3. Company Financials
- 12.1.17.4. SWOT Analysis
- 12.1.18 Manitoba Harvest (Tilray)
- 12.1.18.1. Company Overview
- 12.1.18.2. Products
- 12.1.18.3. Company Financials
- 12.1.18.4. SWOT Analysis
- 12.1.19 HempFlax Group BV
- 12.1.19.1. Company Overview
- 12.1.19.2. Products
- 12.1.19.3. Company Financials
- 12.1.19.4. SWOT Analysis
- 12.1.20 Entoura
- 12.1.20.1. Company Overview
- 12.1.20.2. Products
- 12.1.20.3. Company Financials
- 12.1.20.4. SWOT Analysis
- 12.1.21 Bedrocan
- 12.1.21.1. Company Overview
- 12.1.21.2. Products
- 12.1.21.3. Company Financials
- 12.1.21.4. SWOT Analysis
- 12.1.22 Signature Products
- 12.1.22.1. Company Overview
- 12.1.22.2. Products
- 12.1.22.3. Company Financials
- 12.1.22.4. SWOT Analysis
- 12.1.23 Nutiva hemp Oil
- 12.1.23.1. Company Overview
- 12.1.23.2. Products
- 12.1.23.3. Company Financials
- 12.1.23.4. SWOT Analysis
- 12.1.24 Temp Co Canada
- 12.1.24.1. Company Overview
- 12.1.24.2. Products
- 12.1.24.3. Company Financials
- 12.1.24.4. SWOT Analysis
- 12.1.25 Hemp Acres USA*List Not Exhaustive
- 12.1.25.1. Company Overview
- 12.1.25.2. Products
- 12.1.25.3. Company Financials
- 12.1.25.4. SWOT Analysis
- 12.1.1 Ilesol Pharmaceuticals doo
- 12.2. Market Entropy
- 12.2.1 Company's Key Areas Served
- 12.2.2 Recent Developments
- 12.3. Company Market Share Analysis 2025
- 12.3.1 Top 5 Companies Market Share Analysis
- 12.3.2 Top 3 Companies Market Share Analysis
- 12.4. List of Potential Customers
- 13. Research Methodology
List of Figures
- Figure 1: Global Industrial Hemp Industry Revenue Breakdown (Million, %) by Region 2025 & 2033
- Figure 2: Global Industrial Hemp Industry Volume Breakdown (Billion, %) by Region 2025 & 2033
- Figure 3: Asia Pacific Industrial Hemp Industry Revenue (Million), by Type 2025 & 2033
- Figure 4: Asia Pacific Industrial Hemp Industry Volume (Billion), by Type 2025 & 2033
- Figure 5: Asia Pacific Industrial Hemp Industry Revenue Share (%), by Type 2025 & 2033
- Figure 6: Asia Pacific Industrial Hemp Industry Volume Share (%), by Type 2025 & 2033
- Figure 7: Asia Pacific Industrial Hemp Industry Revenue (Million), by Application 2025 & 2033
- Figure 8: Asia Pacific Industrial Hemp Industry Volume (Billion), by Application 2025 & 2033
- Figure 9: Asia Pacific Industrial Hemp Industry Revenue Share (%), by Application 2025 & 2033
- Figure 10: Asia Pacific Industrial Hemp Industry Volume Share (%), by Application 2025 & 2033
- Figure 11: Asia Pacific Industrial Hemp Industry Revenue (Million), by Country 2025 & 2033
- Figure 12: Asia Pacific Industrial Hemp Industry Volume (Billion), by Country 2025 & 2033
- Figure 13: Asia Pacific Industrial Hemp Industry Revenue Share (%), by Country 2025 & 2033
- Figure 14: Asia Pacific Industrial Hemp Industry Volume Share (%), by Country 2025 & 2033
- Figure 15: North America Industrial Hemp Industry Revenue (Million), by Type 2025 & 2033
- Figure 16: North America Industrial Hemp Industry Volume (Billion), by Type 2025 & 2033
- Figure 17: North America Industrial Hemp Industry Revenue Share (%), by Type 2025 & 2033
- Figure 18: North America Industrial Hemp Industry Volume Share (%), by Type 2025 & 2033
- Figure 19: North America Industrial Hemp Industry Revenue (Million), by Application 2025 & 2033
- Figure 20: North America Industrial Hemp Industry Volume (Billion), by Application 2025 & 2033
- Figure 21: North America Industrial Hemp Industry Revenue Share (%), by Application 2025 & 2033
- Figure 22: North America Industrial Hemp Industry Volume Share (%), by Application 2025 & 2033
- Figure 23: North America Industrial Hemp Industry Revenue (Million), by Country 2025 & 2033
- Figure 24: North America Industrial Hemp Industry Volume (Billion), by Country 2025 & 2033
- Figure 25: North America Industrial Hemp Industry Revenue Share (%), by Country 2025 & 2033
- Figure 26: North America Industrial Hemp Industry Volume Share (%), by Country 2025 & 2033
- Figure 27: Europe Industrial Hemp Industry Revenue (Million), by Type 2025 & 2033
- Figure 28: Europe Industrial Hemp Industry Volume (Billion), by Type 2025 & 2033
- Figure 29: Europe Industrial Hemp Industry Revenue Share (%), by Type 2025 & 2033
- Figure 30: Europe Industrial Hemp Industry Volume Share (%), by Type 2025 & 2033
- Figure 31: Europe Industrial Hemp Industry Revenue (Million), by Application 2025 & 2033
- Figure 32: Europe Industrial Hemp Industry Volume (Billion), by Application 2025 & 2033
- Figure 33: Europe Industrial Hemp Industry Revenue Share (%), by Application 2025 & 2033
- Figure 34: Europe Industrial Hemp Industry Volume Share (%), by Application 2025 & 2033
- Figure 35: Europe Industrial Hemp Industry Revenue (Million), by Country 2025 & 2033
- Figure 36: Europe Industrial Hemp Industry Volume (Billion), by Country 2025 & 2033
- Figure 37: Europe Industrial Hemp Industry Revenue Share (%), by Country 2025 & 2033
- Figure 38: Europe Industrial Hemp Industry Volume Share (%), by Country 2025 & 2033
- Figure 39: South America Industrial Hemp Industry Revenue (Million), by Type 2025 & 2033
- Figure 40: South America Industrial Hemp Industry Volume (Billion), by Type 2025 & 2033
- Figure 41: South America Industrial Hemp Industry Revenue Share (%), by Type 2025 & 2033
- Figure 42: South America Industrial Hemp Industry Volume Share (%), by Type 2025 & 2033
- Figure 43: South America Industrial Hemp Industry Revenue (Million), by Application 2025 & 2033
- Figure 44: South America Industrial Hemp Industry Volume (Billion), by Application 2025 & 2033
- Figure 45: South America Industrial Hemp Industry Revenue Share (%), by Application 2025 & 2033
- Figure 46: South America Industrial Hemp Industry Volume Share (%), by Application 2025 & 2033
- Figure 47: South America Industrial Hemp Industry Revenue (Million), by Country 2025 & 2033
- Figure 48: South America Industrial Hemp Industry Volume (Billion), by Country 2025 & 2033
- Figure 49: South America Industrial Hemp Industry Revenue Share (%), by Country 2025 & 2033
- Figure 50: South America Industrial Hemp Industry Volume Share (%), by Country 2025 & 2033
- Figure 51: Middle East and Africa Industrial Hemp Industry Revenue (Million), by Type 2025 & 2033
- Figure 52: Middle East and Africa Industrial Hemp Industry Volume (Billion), by Type 2025 & 2033
- Figure 53: Middle East and Africa Industrial Hemp Industry Revenue Share (%), by Type 2025 & 2033
- Figure 54: Middle East and Africa Industrial Hemp Industry Volume Share (%), by Type 2025 & 2033
- Figure 55: Middle East and Africa Industrial Hemp Industry Revenue (Million), by Application 2025 & 2033
- Figure 56: Middle East and Africa Industrial Hemp Industry Volume (Billion), by Application 2025 & 2033
- Figure 57: Middle East and Africa Industrial Hemp Industry Revenue Share (%), by Application 2025 & 2033
- Figure 58: Middle East and Africa Industrial Hemp Industry Volume Share (%), by Application 2025 & 2033
- Figure 59: Middle East and Africa Industrial Hemp Industry Revenue (Million), by Country 2025 & 2033
- Figure 60: Middle East and Africa Industrial Hemp Industry Volume (Billion), by Country 2025 & 2033
- Figure 61: Middle East and Africa Industrial Hemp Industry Revenue Share (%), by Country 2025 & 2033
- Figure 62: Middle East and Africa Industrial Hemp Industry Volume Share (%), by Country 2025 & 2033
List of Tables
- Table 1: Global Industrial Hemp Industry Revenue Million Forecast, by Type 2020 & 2033
- Table 2: Global Industrial Hemp Industry Volume Billion Forecast, by Type 2020 & 2033
- Table 3: Global Industrial Hemp Industry Revenue Million Forecast, by Application 2020 & 2033
- Table 4: Global Industrial Hemp Industry Volume Billion Forecast, by Application 2020 & 2033
- Table 5: Global Industrial Hemp Industry Revenue Million Forecast, by Region 2020 & 2033
- Table 6: Global Industrial Hemp Industry Volume Billion Forecast, by Region 2020 & 2033
- Table 7: Global Industrial Hemp Industry Revenue Million Forecast, by Type 2020 & 2033
- Table 8: Global Industrial Hemp Industry Volume Billion Forecast, by Type 2020 & 2033
- Table 9: Global Industrial Hemp Industry Revenue Million Forecast, by Application 2020 & 2033
- Table 10: Global Industrial Hemp Industry Volume Billion Forecast, by Application 2020 & 2033
- Table 11: Global Industrial Hemp Industry Revenue Million Forecast, by Country 2020 & 2033
- Table 12: Global Industrial Hemp Industry Volume Billion Forecast, by Country 2020 & 2033
- Table 13: China Industrial Hemp Industry Revenue (Million) Forecast, by Application 2020 & 2033
- Table 14: China Industrial Hemp Industry Volume (Billion) Forecast, by Application 2020 & 2033
- Table 15: India Industrial Hemp Industry Revenue (Million) Forecast, by Application 2020 & 2033
- Table 16: India Industrial Hemp Industry Volume (Billion) Forecast, by Application 2020 & 2033
- Table 17: Japan Industrial Hemp Industry Revenue (Million) Forecast, by Application 2020 & 2033
- Table 18: Japan Industrial Hemp Industry Volume (Billion) Forecast, by Application 2020 & 2033
- Table 19: South Korea Industrial Hemp Industry Revenue (Million) Forecast, by Application 2020 & 2033
- Table 20: South Korea Industrial Hemp Industry Volume (Billion) Forecast, by Application 2020 & 2033
- Table 21: Malaysia Industrial Hemp Industry Revenue (Million) Forecast, by Application 2020 & 2033
- Table 22: Malaysia Industrial Hemp Industry Volume (Billion) Forecast, by Application 2020 & 2033
- Table 23: Thailand Industrial Hemp Industry Revenue (Million) Forecast, by Application 2020 & 2033
- Table 24: Thailand Industrial Hemp Industry Volume (Billion) Forecast, by Application 2020 & 2033
- Table 25: Indonesia Industrial Hemp Industry Revenue (Million) Forecast, by Application 2020 & 2033
- Table 26: Indonesia Industrial Hemp Industry Volume (Billion) Forecast, by Application 2020 & 2033
- Table 27: Vietnam Industrial Hemp Industry Revenue (Million) Forecast, by Application 2020 & 2033
- Table 28: Vietnam Industrial Hemp Industry Volume (Billion) Forecast, by Application 2020 & 2033
- Table 29: Rest of Asia Pacific Industrial Hemp Industry Revenue (Million) Forecast, by Application 2020 & 2033
- Table 30: Rest of Asia Pacific Industrial Hemp Industry Volume (Billion) Forecast, by Application 2020 & 2033
- Table 31: Global Industrial Hemp Industry Revenue Million Forecast, by Type 2020 & 2033
- Table 32: Global Industrial Hemp Industry Volume Billion Forecast, by Type 2020 & 2033
- Table 33: Global Industrial Hemp Industry Revenue Million Forecast, by Application 2020 & 2033
- Table 34: Global Industrial Hemp Industry Volume Billion Forecast, by Application 2020 & 2033
- Table 35: Global Industrial Hemp Industry Revenue Million Forecast, by Country 2020 & 2033
- Table 36: Global Industrial Hemp Industry Volume Billion Forecast, by Country 2020 & 2033
- Table 37: United States Industrial Hemp Industry Revenue (Million) Forecast, by Application 2020 & 2033
- Table 38: United States Industrial Hemp Industry Volume (Billion) Forecast, by Application 2020 & 2033
- Table 39: Canada Industrial Hemp Industry Revenue (Million) Forecast, by Application 2020 & 2033
- Table 40: Canada Industrial Hemp Industry Volume (Billion) Forecast, by Application 2020 & 2033
- Table 41: Mexico Industrial Hemp Industry Revenue (Million) Forecast, by Application 2020 & 2033
- Table 42: Mexico Industrial Hemp Industry Volume (Billion) Forecast, by Application 2020 & 2033
- Table 43: Global Industrial Hemp Industry Revenue Million Forecast, by Type 2020 & 2033
- Table 44: Global Industrial Hemp Industry Volume Billion Forecast, by Type 2020 & 2033
- Table 45: Global Industrial Hemp Industry Revenue Million Forecast, by Application 2020 & 2033
- Table 46: Global Industrial Hemp Industry Volume Billion Forecast, by Application 2020 & 2033
- Table 47: Global Industrial Hemp Industry Revenue Million Forecast, by Country 2020 & 2033
- Table 48: Global Industrial Hemp Industry Volume Billion Forecast, by Country 2020 & 2033
- Table 49: Germany Industrial Hemp Industry Revenue (Million) Forecast, by Application 2020 & 2033
- Table 50: Germany Industrial Hemp Industry Volume (Billion) Forecast, by Application 2020 & 2033
- Table 51: United Kingdom Industrial Hemp Industry Revenue (Million) Forecast, by Application 2020 & 2033
- Table 52: United Kingdom Industrial Hemp Industry Volume (Billion) Forecast, by Application 2020 & 2033
- Table 53: France Industrial Hemp Industry Revenue (Million) Forecast, by Application 2020 & 2033
- Table 54: France Industrial Hemp Industry Volume (Billion) Forecast, by Application 2020 & 2033
- Table 55: Italy Industrial Hemp Industry Revenue (Million) Forecast, by Application 2020 & 2033
- Table 56: Italy Industrial Hemp Industry Volume (Billion) Forecast, by Application 2020 & 2033
- Table 57: Spain Industrial Hemp Industry Revenue (Million) Forecast, by Application 2020 & 2033
- Table 58: Spain Industrial Hemp Industry Volume (Billion) Forecast, by Application 2020 & 2033
- Table 59: Turkey Industrial Hemp Industry Revenue (Million) Forecast, by Application 2020 & 2033
- Table 60: Turkey Industrial Hemp Industry Volume (Billion) Forecast, by Application 2020 & 2033
- Table 61: Russia Industrial Hemp Industry Revenue (Million) Forecast, by Application 2020 & 2033
- Table 62: Russia Industrial Hemp Industry Volume (Billion) Forecast, by Application 2020 & 2033
- Table 63: NORDIC Countries Industrial Hemp Industry Revenue (Million) Forecast, by Application 2020 & 2033
- Table 64: NORDIC Countries Industrial Hemp Industry Volume (Billion) Forecast, by Application 2020 & 2033
- Table 65: Rest of Europe Industrial Hemp Industry Revenue (Million) Forecast, by Application 2020 & 2033
- Table 66: Rest of Europe Industrial Hemp Industry Volume (Billion) Forecast, by Application 2020 & 2033
- Table 67: Global Industrial Hemp Industry Revenue Million Forecast, by Type 2020 & 2033
- Table 68: Global Industrial Hemp Industry Volume Billion Forecast, by Type 2020 & 2033
- Table 69: Global Industrial Hemp Industry Revenue Million Forecast, by Application 2020 & 2033
- Table 70: Global Industrial Hemp Industry Volume Billion Forecast, by Application 2020 & 2033
- Table 71: Global Industrial Hemp Industry Revenue Million Forecast, by Country 2020 & 2033
- Table 72: Global Industrial Hemp Industry Volume Billion Forecast, by Country 2020 & 2033
- Table 73: Brazil Industrial Hemp Industry Revenue (Million) Forecast, by Application 2020 & 2033
- Table 74: Brazil Industrial Hemp Industry Volume (Billion) Forecast, by Application 2020 & 2033
- Table 75: Argentina Industrial Hemp Industry Revenue (Million) Forecast, by Application 2020 & 2033
- Table 76: Argentina Industrial Hemp Industry Volume (Billion) Forecast, by Application 2020 & 2033
- Table 77: Colombia Industrial Hemp Industry Revenue (Million) Forecast, by Application 2020 & 2033
- Table 78: Colombia Industrial Hemp Industry Volume (Billion) Forecast, by Application 2020 & 2033
- Table 79: Rest of South America Industrial Hemp Industry Revenue (Million) Forecast, by Application 2020 & 2033
- Table 80: Rest of South America Industrial Hemp Industry Volume (Billion) Forecast, by Application 2020 & 2033
- Table 81: Global Industrial Hemp Industry Revenue Million Forecast, by Type 2020 & 2033
- Table 82: Global Industrial Hemp Industry Volume Billion Forecast, by Type 2020 & 2033
- Table 83: Global Industrial Hemp Industry Revenue Million Forecast, by Application 2020 & 2033
- Table 84: Global Industrial Hemp Industry Volume Billion Forecast, by Application 2020 & 2033
- Table 85: Global Industrial Hemp Industry Revenue Million Forecast, by Country 2020 & 2033
- Table 86: Global Industrial Hemp Industry Volume Billion Forecast, by Country 2020 & 2033
- Table 87: Saudi Arabia Industrial Hemp Industry Revenue (Million) Forecast, by Application 2020 & 2033
- Table 88: Saudi Arabia Industrial Hemp Industry Volume (Billion) Forecast, by Application 2020 & 2033
- Table 89: Nigeria Industrial Hemp Industry Revenue (Million) Forecast, by Application 2020 & 2033
- Table 90: Nigeria Industrial Hemp Industry Volume (Billion) Forecast, by Application 2020 & 2033
- Table 91: Qatar Industrial Hemp Industry Revenue (Million) Forecast, by Application 2020 & 2033
- Table 92: Qatar Industrial Hemp Industry Volume (Billion) Forecast, by Application 2020 & 2033
- Table 93: Egypt Industrial Hemp Industry Revenue (Million) Forecast, by Application 2020 & 2033
- Table 94: Egypt Industrial Hemp Industry Volume (Billion) Forecast, by Application 2020 & 2033
- Table 95: United Arab Emirates Industrial Hemp Industry Revenue (Million) Forecast, by Application 2020 & 2033
- Table 96: United Arab Emirates Industrial Hemp Industry Volume (Billion) Forecast, by Application 2020 & 2033
- Table 97: South Africa Industrial Hemp Industry Revenue (Million) Forecast, by Application 2020 & 2033
- Table 98: South Africa Industrial Hemp Industry Volume (Billion) Forecast, by Application 2020 & 2033
- Table 99: Rest of Middle East and Africa Industrial Hemp Industry Revenue (Million) Forecast, by Application 2020 & 2033
- Table 100: Rest of Middle East and Africa Industrial Hemp Industry Volume (Billion) Forecast, by Application 2020 & 2033
Frequently Asked Questions
1. What is the projected Compound Annual Growth Rate (CAGR) of the Industrial Hemp Industry?
The projected CAGR is approximately > 17.00%.
2. Which companies are prominent players in the Industrial Hemp Industry?
Key companies in the market include Ilesol Pharmaceuticals doo, Bulk Hemp Warehouse LLC, International Flavors & Fragrances Inc, GenCanna, Robertet, Firmenich SA, Charlotte's Web Holdings Inc, True Terpenes, Puricon, PharmaCielo Ltd, Silver Lion Farms, Bomar Agra Estates LLC, Colorado Breeders Depot, 33 Supply LLC, Green Passion (Canway Schweiz GmbH), Victory Hemp Foods, Hemp Oil Canada, Manitoba Harvest (Tilray), HempFlax Group BV, Entoura, Bedrocan, Signature Products, Nutiva hemp Oil, Temp Co Canada, Hemp Acres USA*List Not Exhaustive.
3. What are the main segments of the Industrial Hemp Industry?
The market segments include Type, Application.
4. Can you provide details about the market size?
The market size is estimated to be USD 2.60 Million as of 2022.
5. What are some drivers contributing to market growth?
Huge Demand for Industrial Hemp Products Across Diverse Applications; High Functional Application in Health Care Sector.
6. What are the notable trends driving market growth?
Increasing Demand from the Food and Beverage Segment.
7. Are there any restraints impacting market growth?
Huge Demand for Industrial Hemp Products Across Diverse Applications; High Functional Application in Health Care Sector.
8. Can you provide examples of recent developments in the market?
January 2022: MariMed Inc. signed a definitive agreement to acquire Green Growth Group Inc., holder of a provisional Cannabis Craft License in Illinois.January 2022: MariMed Inc. entered a definitive agreement to acquire Kind Therapeutics USA LLC, a leading vertically integrated cannabis business in Maryland.
9. What pricing options are available for accessing the report?
Pricing options include single-user, multi-user, and enterprise licenses priced at USD 4750, USD 5250, and USD 8750 respectively.
10. Is the market size provided in terms of value or volume?
The market size is provided in terms of value, measured in Million and volume, measured in Billion.
11. Are there any specific market keywords associated with the report?
Yes, the market keyword associated with the report is "Industrial Hemp Industry," which aids in identifying and referencing the specific market segment covered.
12. How do I determine which pricing option suits my needs best?
The pricing options vary based on user requirements and access needs. Individual users may opt for single-user licenses, while businesses requiring broader access may choose multi-user or enterprise licenses for cost-effective access to the report.
13. Are there any additional resources or data provided in the Industrial Hemp Industry report?
While the report offers comprehensive insights, it's advisable to review the specific contents or supplementary materials provided to ascertain if additional resources or data are available.
14. How can I stay updated on further developments or reports in the Industrial Hemp Industry?
To stay informed about further developments, trends, and reports in the Industrial Hemp Industry, consider subscribing to industry newsletters, following relevant companies and organizations, or regularly checking reputable industry news sources and publications.
Methodology
Step 1 - Identification of Relevant Samples Size from Population Database


Step 2 - Approaches for Defining Global Market Size (Value, Volume* & Price*)

Note*: In applicable scenarios
Step 3 - Data Sources
Primary Research
- Web Analytics
- Survey Reports
- Research Institute
- Latest Research Reports
- Opinion Leaders
Secondary Research
- Annual Reports
- White Paper
- Latest Press Release
- Industry Association
- Paid Database
- Investor Presentations

Step 4 - Data Triangulation
Involves using different sources of information in order to increase the validity of a study
These sources are likely to be stakeholders in a program - participants, other researchers, program staff, other community members, and so on.
Then we put all data in single framework & apply various statistical tools to find out the dynamic on the market.
During the analysis stage, feedback from the stakeholder groups would be compared to determine areas of agreement as well as areas of divergence