Key Insights
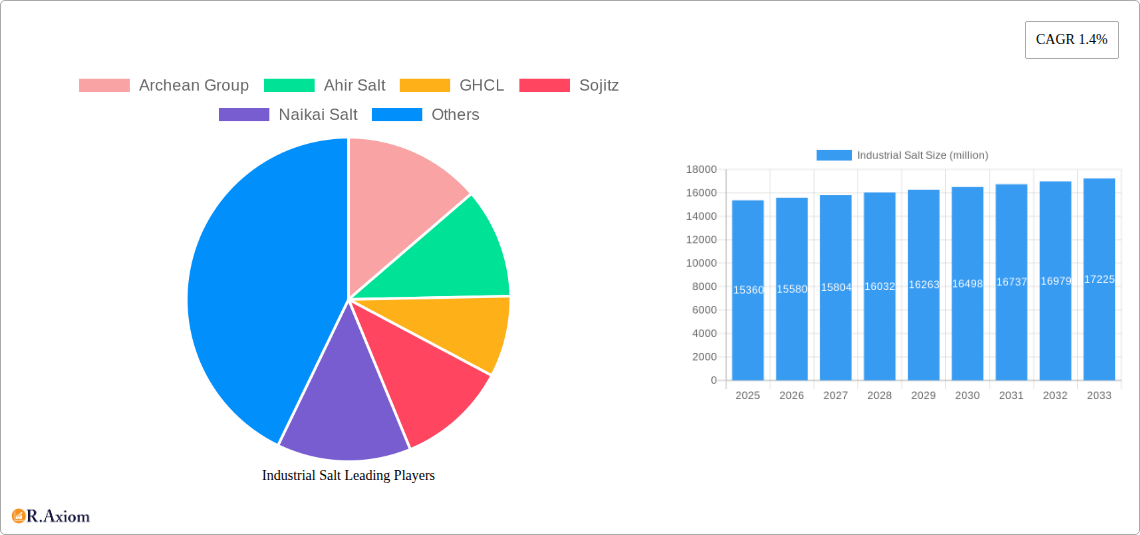
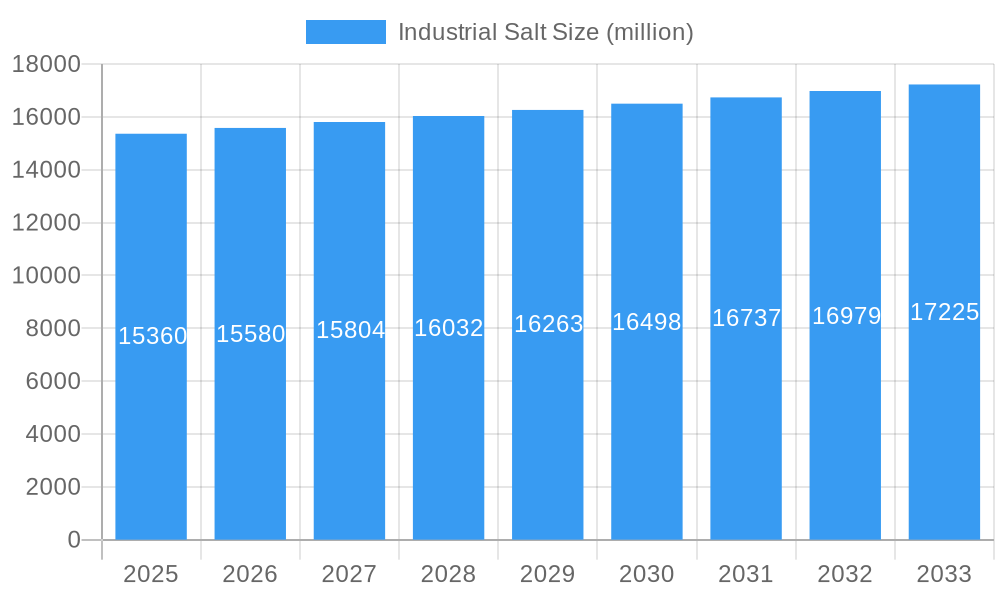
The global industrial salt market, valued at approximately $15.36 billion in 2025, is projected to experience steady growth, with a compound annual growth rate (CAGR) of 1.4% from 2025 to 2033. This moderate growth reflects a mature market, yet underlying drivers such as the increasing demand from various industries contribute to sustained expansion. The chemical industry remains a significant consumer, leveraging salt in numerous processes, including chlorine and caustic soda production. Furthermore, the food processing, water treatment, and oil and gas sectors all rely heavily on industrial salt, creating consistent demand. Growth is expected to be fueled by expanding industrial activity, particularly in developing economies, along with advancements in salt production technologies leading to higher efficiency and lower costs. However, factors such as stringent environmental regulations regarding salt mining and brine disposal, along with price fluctuations in raw materials, pose potential restraints on market expansion. The market is segmented based on various factors including grade (e.g., solar, vacuum, rock salt), application, and region. Competition is substantial, with a mix of large multinational corporations and regional players vying for market share. Key players such as Archean Group, GHCL, and China National Salt dominate the landscape, employing diverse strategies to maintain competitiveness, including strategic partnerships, acquisitions, and capacity expansion.
Industrial Salt Market Size (In Billion)
The forecast period from 2025 to 2033 presents opportunities for players to capitalize on regional variations in demand and implement sustainable practices. While the overall CAGR suggests moderate growth, specific segments within the market, such as specialized high-purity salts for niche applications, might experience more substantial growth rates. Effective supply chain management and strategic partnerships across the value chain will be crucial for success in this competitive market. Technological innovation focusing on reducing environmental impact and enhancing production efficiency will become increasingly important for sustainable market leadership. Market players must adeptly navigate the evolving regulatory landscape and adapt to changing consumer preferences and industrial trends. Continued monitoring of raw material costs, energy prices, and global economic conditions will be essential for informed business decisions and strategic planning.
Industrial Salt Company Market Share
Industrial Salt Market Report: 2019-2033 - A Comprehensive Analysis
This comprehensive report provides an in-depth analysis of the global industrial salt market, covering the period from 2019 to 2033. The report leverages extensive primary and secondary research to offer actionable insights for industry stakeholders, including manufacturers, distributors, investors, and policymakers. With a focus on market concentration, innovation, trends, and leading players, this report is an essential resource for navigating the complexities of this vital industry. The report uses 2025 as the base year and provides forecasts until 2033. The market size values are expressed in millions.
Industrial Salt Market Concentration & Innovation
The global industrial salt market exhibits a moderately concentrated structure, with a handful of major players holding significant market share. The market share of the top five players, including Archean Group, Ahir Salt, GHCL, Sojitz, and Naikai Salt, is estimated at xx% in 2025. However, the presence of numerous regional and smaller players contributes to a competitive landscape. Innovation is driven by the need for higher purity grades, specialized formulations for niche applications, and sustainable production methods. Regulatory frameworks, including environmental regulations and safety standards, influence production practices and product development. The increasing demand for salt substitutes and the rising awareness of sodium intake are creating opportunities for innovative low-sodium or enhanced salt products. Mergers and acquisitions (M&A) activity remains relatively low, with the total value of deals in the past five years estimated at $xx million. Recent M&A activities have focused on expanding geographical reach and product portfolios.
- Market Concentration: Top 5 players hold xx% market share (2025).
- Innovation Drivers: Higher purity grades, specialized formulations, sustainable production.
- Regulatory Framework: Environmental regulations and safety standards are significant.
- Product Substitutes: Growing interest in salt substitutes and low-sodium options.
- M&A Activity: Total value of deals (2019-2024) estimated at $xx million.
Industrial Salt Industry Trends & Insights
The global industrial salt market is projected to experience robust growth during the forecast period (2025-2033), driven by increasing demand from various end-use industries, particularly in construction, chemicals, and food processing. The Compound Annual Growth Rate (CAGR) is estimated at xx% during 2025-2033. This growth is further fueled by the expanding global population, rising disposable incomes, and infrastructural development across emerging economies. Technological advancements, including automation in production and improved purification techniques, are enhancing efficiency and reducing costs. Consumer preferences are shifting towards sustainably produced and higher-quality salt. Intense competition among major players is driving innovation and price optimization. Market penetration for specialized industrial salt grades is increasing, especially in niche applications within the chemical and pharmaceutical industries.
Dominant Markets & Segments in Industrial Salt
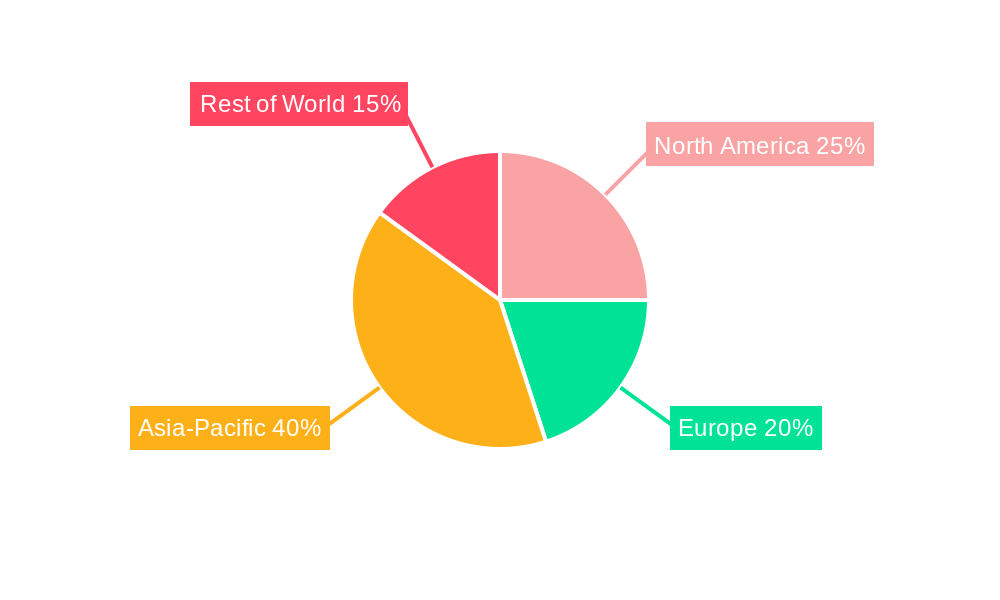
The Asia-Pacific region holds the dominant position in the global industrial salt market, accounting for approximately xx% of the total market share in 2025. China, India, and other Southeast Asian countries contribute significantly to this dominance, driven by factors such as robust economic growth, expanding industrial sectors, and substantial agricultural activities.
- Key Drivers in Asia-Pacific:
- Rapid economic growth and industrialization
- Expanding agricultural sector
- Favorable government policies and investments in infrastructure
- Increasing population and food consumption
- Abundant salt resources
The dominance analysis reveals a strong correlation between economic development and industrial salt consumption. Countries with higher GDP growth rates and substantial investments in infrastructure projects tend to consume significantly more industrial salt.
Industrial Salt Product Developments
Recent product developments have focused on producing higher-purity grades of industrial salt catering to specialized applications in chemicals, pharmaceuticals, and food processing. Technological advances in purification methods, including membrane technology and crystallization techniques, enable the production of salts with reduced impurities and enhanced functionalities. This focus on higher-quality products provides competitive advantages, commanding premium pricing in specific niche markets. The market is seeing a push for sustainable and environmentally friendly production processes.
Report Scope & Segmentation Analysis
This report segments the industrial salt market based on product type (e.g., vacuum pan salt, solar salt), application (e.g., food processing, water treatment, de-icing), and region. Each segment exhibits varying growth rates and competitive dynamics. For instance, the food processing segment is expected to show xx% CAGR due to increased food processing capacity globally, whereas the water treatment segment is expected to grow at xx% due to the focus on water purity and softening. Regional segmentation includes North America, Europe, Asia-Pacific, Latin America, and the Middle East & Africa. Growth projections, market size estimates, and competitive landscape analyses are provided for each segment.
Key Drivers of Industrial Salt Growth
The industrial salt market’s growth is primarily propelled by the burgeoning demand from key end-use industries like chemical manufacturing, food processing, and water treatment. Economic growth, particularly in developing nations, fuels increased industrial activity and construction, leading to higher salt consumption. Furthermore, stringent regulatory frameworks mandating higher-quality salt in various applications contribute to market expansion. Technological advancements in salt production, including enhanced purification techniques, lead to more efficient and cost-effective processes, supporting growth.
Challenges in the Industrial Salt Sector
The industrial salt sector faces challenges such as price volatility due to fluctuations in raw material costs and energy prices. Supply chain disruptions, particularly in regions with limited transportation infrastructure, impact production and distribution. Stringent environmental regulations and the increasing cost of compliance present operational hurdles. Intense competition among established and emerging players also adds pressure on profitability. These factors cumulatively affect the market's growth trajectory. The cumulative impact of these challenges on the 2025 market is estimated to negatively influence growth by approximately xx%.
Emerging Opportunities in Industrial Salt
Emerging opportunities lie in the development of specialized industrial salt products for niche applications, including pharmaceuticals and advanced materials manufacturing. Sustainable production methods and a focus on environmentally friendly practices create new market segments. The growing demand for higher-purity salt in various industries, driven by stringent quality standards, presents significant growth potential. Expansion into new markets, particularly in developing economies with rising industrial activity, offers promising prospects.
Leading Players in the Industrial Salt Market
- Archean Group
- Ahir Salt
- GHCL
- Sojitz
- Naikai Salt
- China National Salt
- 9D Group
- Yunnan Salt
- Lantai Industry
- Chengyuan Salt
- Jingshen Salt & Chemical
- Longwei
- Chengkou
- Lubei Chemical
- Dadi Salt
Key Developments in Industrial Salt Industry
- 2022 Q3: Archean Group announced a significant expansion of its salt production facility in Australia.
- 2023 Q1: GHCL launched a new line of high-purity industrial salt for the pharmaceutical industry.
- 2024 Q2: Sojitz acquired a stake in a leading salt producer in Southeast Asia. (Further key developments with dates will be added in the final report)
Strategic Outlook for Industrial Salt Market
The future of the industrial salt market appears promising, driven by consistent growth in end-use industries and technological advancements that enhance efficiency and product quality. Emerging market opportunities and the focus on sustainable production methods will shape the market's trajectory. Strategic investments in R&D, expansion into new geographical markets, and a focus on producing high-value-added products will be crucial for companies seeking sustained growth in this dynamic market. The forecasted market size for 2033 is $xx million.
Industrial Salt Segmentation
-
1. Application
- 1.1. Chemical Processing
- 1.2. De-Icing
- 1.3. Oil & Gas
- 1.4. Water Treatment
- 1.5. Agriculture
- 1.6. Others
-
2. Type
- 2.1. Sea Salt
- 2.2. Well and Rock Salt
- 2.3. Lake Salt
Industrial Salt Segmentation By Geography
-
1. North America
- 1.1. United States
- 1.2. Canada
- 1.3. Mexico
-
2. South America
- 2.1. Brazil
- 2.2. Argentina
- 2.3. Rest of South America
-
3. Europe
- 3.1. United Kingdom
- 3.2. Germany
- 3.3. France
- 3.4. Italy
- 3.5. Spain
- 3.6. Russia
- 3.7. Benelux
- 3.8. Nordics
- 3.9. Rest of Europe
-
4. Middle East & Africa
- 4.1. Turkey
- 4.2. Israel
- 4.3. GCC
- 4.4. North Africa
- 4.5. South Africa
- 4.6. Rest of Middle East & Africa
-
5. Asia Pacific
- 5.1. China
- 5.2. India
- 5.3. Japan
- 5.4. South Korea
- 5.5. ASEAN
- 5.6. Oceania
- 5.7. Rest of Asia Pacific
Industrial Salt Regional Market Share
Geographic Coverage of Industrial Salt
Industrial Salt REPORT HIGHLIGHTS
| Aspects | Details |
|---|---|
| Study Period | 2020-2034 |
| Base Year | 2025 |
| Estimated Year | 2026 |
| Forecast Period | 2026-2034 |
| Historical Period | 2020-2025 |
| Growth Rate | CAGR of 1.4% from 2020-2034 |
| Segmentation |
|
Table of Contents
- 1. Introduction
- 1.1. Research Scope
- 1.2. Market Segmentation
- 1.3. Research Objective
- 1.4. Definitions and Assumptions
- 2. Executive Summary
- 2.1. Market Snapshot
- 3. Market Dynamics
- 3.1. Market Drivers
- 3.2. Market Restrains
- 3.3. Market Trends
- 3.4. Market Opportunities
- 4. Market Factor Analysis
- 4.1. Porters Five Forces
- 4.1.1. Bargaining Power of Suppliers
- 4.1.2. Bargaining Power of Buyers
- 4.1.3. Threat of New Entrants
- 4.1.4. Threat of Substitutes
- 4.1.5. Competitive Rivalry
- 4.2. PESTEL analysis
- 4.3. BCG Analysis
- 4.3.1. Stars (High Growth, High Market Share)
- 4.3.2. Cash Cows (Low Growth, High Market Share)
- 4.3.3. Question Mark (High Growth, Low Market Share)
- 4.3.4. Dogs (Low Growth, Low Market Share)
- 4.4. Ansoff Matrix Analysis
- 4.5. Supply Chain Analysis
- 4.6. Regulatory Landscape
- 4.7. Current Market Potential and Opportunity Assessment (TAM–SAM–SOM Framework)
- 4.8. RAX Analyst Note
- 4.1. Porters Five Forces
- 5. Market Analysis, Insights and Forecast 2021-2033
- 5.1. Market Analysis, Insights and Forecast - by Application
- 5.1.1. Chemical Processing
- 5.1.2. De-Icing
- 5.1.3. Oil & Gas
- 5.1.4. Water Treatment
- 5.1.5. Agriculture
- 5.1.6. Others
- 5.2. Market Analysis, Insights and Forecast - by Type
- 5.2.1. Sea Salt
- 5.2.2. Well and Rock Salt
- 5.2.3. Lake Salt
- 5.3. Market Analysis, Insights and Forecast - by Region
- 5.3.1. North America
- 5.3.2. South America
- 5.3.3. Europe
- 5.3.4. Middle East & Africa
- 5.3.5. Asia Pacific
- 5.1. Market Analysis, Insights and Forecast - by Application
- 6. Global Industrial Salt Analysis, Insights and Forecast, 2021-2033
- 6.1. Market Analysis, Insights and Forecast - by Application
- 6.1.1. Chemical Processing
- 6.1.2. De-Icing
- 6.1.3. Oil & Gas
- 6.1.4. Water Treatment
- 6.1.5. Agriculture
- 6.1.6. Others
- 6.2. Market Analysis, Insights and Forecast - by Type
- 6.2.1. Sea Salt
- 6.2.2. Well and Rock Salt
- 6.2.3. Lake Salt
- 6.1. Market Analysis, Insights and Forecast - by Application
- 7. North America Industrial Salt Analysis, Insights and Forecast, 2020-2032
- 7.1. Market Analysis, Insights and Forecast - by Application
- 7.1.1. Chemical Processing
- 7.1.2. De-Icing
- 7.1.3. Oil & Gas
- 7.1.4. Water Treatment
- 7.1.5. Agriculture
- 7.1.6. Others
- 7.2. Market Analysis, Insights and Forecast - by Type
- 7.2.1. Sea Salt
- 7.2.2. Well and Rock Salt
- 7.2.3. Lake Salt
- 7.1. Market Analysis, Insights and Forecast - by Application
- 8. South America Industrial Salt Analysis, Insights and Forecast, 2020-2032
- 8.1. Market Analysis, Insights and Forecast - by Application
- 8.1.1. Chemical Processing
- 8.1.2. De-Icing
- 8.1.3. Oil & Gas
- 8.1.4. Water Treatment
- 8.1.5. Agriculture
- 8.1.6. Others
- 8.2. Market Analysis, Insights and Forecast - by Type
- 8.2.1. Sea Salt
- 8.2.2. Well and Rock Salt
- 8.2.3. Lake Salt
- 8.1. Market Analysis, Insights and Forecast - by Application
- 9. Europe Industrial Salt Analysis, Insights and Forecast, 2020-2032
- 9.1. Market Analysis, Insights and Forecast - by Application
- 9.1.1. Chemical Processing
- 9.1.2. De-Icing
- 9.1.3. Oil & Gas
- 9.1.4. Water Treatment
- 9.1.5. Agriculture
- 9.1.6. Others
- 9.2. Market Analysis, Insights and Forecast - by Type
- 9.2.1. Sea Salt
- 9.2.2. Well and Rock Salt
- 9.2.3. Lake Salt
- 9.1. Market Analysis, Insights and Forecast - by Application
- 10. Middle East & Africa Industrial Salt Analysis, Insights and Forecast, 2020-2032
- 10.1. Market Analysis, Insights and Forecast - by Application
- 10.1.1. Chemical Processing
- 10.1.2. De-Icing
- 10.1.3. Oil & Gas
- 10.1.4. Water Treatment
- 10.1.5. Agriculture
- 10.1.6. Others
- 10.2. Market Analysis, Insights and Forecast - by Type
- 10.2.1. Sea Salt
- 10.2.2. Well and Rock Salt
- 10.2.3. Lake Salt
- 10.1. Market Analysis, Insights and Forecast - by Application
- 11. Asia Pacific Industrial Salt Analysis, Insights and Forecast, 2020-2032
- 11.1. Market Analysis, Insights and Forecast - by Application
- 11.1.1. Chemical Processing
- 11.1.2. De-Icing
- 11.1.3. Oil & Gas
- 11.1.4. Water Treatment
- 11.1.5. Agriculture
- 11.1.6. Others
- 11.2. Market Analysis, Insights and Forecast - by Type
- 11.2.1. Sea Salt
- 11.2.2. Well and Rock Salt
- 11.2.3. Lake Salt
- 11.1. Market Analysis, Insights and Forecast - by Application
- 12. Competitive Analysis
- 12.1. Company Profiles
- 12.1.1 Archean Group
- 12.1.1.1. Company Overview
- 12.1.1.2. Products
- 12.1.1.3. Company Financials
- 12.1.1.4. SWOT Analysis
- 12.1.2 Ahir Salt
- 12.1.2.1. Company Overview
- 12.1.2.2. Products
- 12.1.2.3. Company Financials
- 12.1.2.4. SWOT Analysis
- 12.1.3 GHCL
- 12.1.3.1. Company Overview
- 12.1.3.2. Products
- 12.1.3.3. Company Financials
- 12.1.3.4. SWOT Analysis
- 12.1.4 Sojitz
- 12.1.4.1. Company Overview
- 12.1.4.2. Products
- 12.1.4.3. Company Financials
- 12.1.4.4. SWOT Analysis
- 12.1.5 Naikai Salt
- 12.1.5.1. Company Overview
- 12.1.5.2. Products
- 12.1.5.3. Company Financials
- 12.1.5.4. SWOT Analysis
- 12.1.6 China National Salt
- 12.1.6.1. Company Overview
- 12.1.6.2. Products
- 12.1.6.3. Company Financials
- 12.1.6.4. SWOT Analysis
- 12.1.7 9D Group
- 12.1.7.1. Company Overview
- 12.1.7.2. Products
- 12.1.7.3. Company Financials
- 12.1.7.4. SWOT Analysis
- 12.1.8 Yunnan Salt
- 12.1.8.1. Company Overview
- 12.1.8.2. Products
- 12.1.8.3. Company Financials
- 12.1.8.4. SWOT Analysis
- 12.1.9 Lantai Industry
- 12.1.9.1. Company Overview
- 12.1.9.2. Products
- 12.1.9.3. Company Financials
- 12.1.9.4. SWOT Analysis
- 12.1.10 Chengyuan Salt
- 12.1.10.1. Company Overview
- 12.1.10.2. Products
- 12.1.10.3. Company Financials
- 12.1.10.4. SWOT Analysis
- 12.1.11 Jingshen Salt & Chemical
- 12.1.11.1. Company Overview
- 12.1.11.2. Products
- 12.1.11.3. Company Financials
- 12.1.11.4. SWOT Analysis
- 12.1.12 Longwei
- 12.1.12.1. Company Overview
- 12.1.12.2. Products
- 12.1.12.3. Company Financials
- 12.1.12.4. SWOT Analysis
- 12.1.13 Chengkou
- 12.1.13.1. Company Overview
- 12.1.13.2. Products
- 12.1.13.3. Company Financials
- 12.1.13.4. SWOT Analysis
- 12.1.14 Lubei Chemical
- 12.1.14.1. Company Overview
- 12.1.14.2. Products
- 12.1.14.3. Company Financials
- 12.1.14.4. SWOT Analysis
- 12.1.15 Dadi Salt
- 12.1.15.1. Company Overview
- 12.1.15.2. Products
- 12.1.15.3. Company Financials
- 12.1.15.4. SWOT Analysis
- 12.1.1 Archean Group
- 12.2. Market Entropy
- 12.2.1 Company's Key Areas Served
- 12.2.2 Recent Developments
- 12.3. Company Market Share Analysis 2025
- 12.3.1 Top 5 Companies Market Share Analysis
- 12.3.2 Top 3 Companies Market Share Analysis
- 12.4. List of Potential Customers
- 13. Research Methodology
List of Figures
- Figure 1: Global Industrial Salt Revenue Breakdown (million, %) by Region 2025 & 2033
- Figure 2: North America Industrial Salt Revenue (million), by Application 2025 & 2033
- Figure 3: North America Industrial Salt Revenue Share (%), by Application 2025 & 2033
- Figure 4: North America Industrial Salt Revenue (million), by Type 2025 & 2033
- Figure 5: North America Industrial Salt Revenue Share (%), by Type 2025 & 2033
- Figure 6: North America Industrial Salt Revenue (million), by Country 2025 & 2033
- Figure 7: North America Industrial Salt Revenue Share (%), by Country 2025 & 2033
- Figure 8: South America Industrial Salt Revenue (million), by Application 2025 & 2033
- Figure 9: South America Industrial Salt Revenue Share (%), by Application 2025 & 2033
- Figure 10: South America Industrial Salt Revenue (million), by Type 2025 & 2033
- Figure 11: South America Industrial Salt Revenue Share (%), by Type 2025 & 2033
- Figure 12: South America Industrial Salt Revenue (million), by Country 2025 & 2033
- Figure 13: South America Industrial Salt Revenue Share (%), by Country 2025 & 2033
- Figure 14: Europe Industrial Salt Revenue (million), by Application 2025 & 2033
- Figure 15: Europe Industrial Salt Revenue Share (%), by Application 2025 & 2033
- Figure 16: Europe Industrial Salt Revenue (million), by Type 2025 & 2033
- Figure 17: Europe Industrial Salt Revenue Share (%), by Type 2025 & 2033
- Figure 18: Europe Industrial Salt Revenue (million), by Country 2025 & 2033
- Figure 19: Europe Industrial Salt Revenue Share (%), by Country 2025 & 2033
- Figure 20: Middle East & Africa Industrial Salt Revenue (million), by Application 2025 & 2033
- Figure 21: Middle East & Africa Industrial Salt Revenue Share (%), by Application 2025 & 2033
- Figure 22: Middle East & Africa Industrial Salt Revenue (million), by Type 2025 & 2033
- Figure 23: Middle East & Africa Industrial Salt Revenue Share (%), by Type 2025 & 2033
- Figure 24: Middle East & Africa Industrial Salt Revenue (million), by Country 2025 & 2033
- Figure 25: Middle East & Africa Industrial Salt Revenue Share (%), by Country 2025 & 2033
- Figure 26: Asia Pacific Industrial Salt Revenue (million), by Application 2025 & 2033
- Figure 27: Asia Pacific Industrial Salt Revenue Share (%), by Application 2025 & 2033
- Figure 28: Asia Pacific Industrial Salt Revenue (million), by Type 2025 & 2033
- Figure 29: Asia Pacific Industrial Salt Revenue Share (%), by Type 2025 & 2033
- Figure 30: Asia Pacific Industrial Salt Revenue (million), by Country 2025 & 2033
- Figure 31: Asia Pacific Industrial Salt Revenue Share (%), by Country 2025 & 2033
List of Tables
- Table 1: Global Industrial Salt Revenue million Forecast, by Application 2020 & 2033
- Table 2: Global Industrial Salt Revenue million Forecast, by Type 2020 & 2033
- Table 3: Global Industrial Salt Revenue million Forecast, by Region 2020 & 2033
- Table 4: Global Industrial Salt Revenue million Forecast, by Application 2020 & 2033
- Table 5: Global Industrial Salt Revenue million Forecast, by Type 2020 & 2033
- Table 6: Global Industrial Salt Revenue million Forecast, by Country 2020 & 2033
- Table 7: United States Industrial Salt Revenue (million) Forecast, by Application 2020 & 2033
- Table 8: Canada Industrial Salt Revenue (million) Forecast, by Application 2020 & 2033
- Table 9: Mexico Industrial Salt Revenue (million) Forecast, by Application 2020 & 2033
- Table 10: Global Industrial Salt Revenue million Forecast, by Application 2020 & 2033
- Table 11: Global Industrial Salt Revenue million Forecast, by Type 2020 & 2033
- Table 12: Global Industrial Salt Revenue million Forecast, by Country 2020 & 2033
- Table 13: Brazil Industrial Salt Revenue (million) Forecast, by Application 2020 & 2033
- Table 14: Argentina Industrial Salt Revenue (million) Forecast, by Application 2020 & 2033
- Table 15: Rest of South America Industrial Salt Revenue (million) Forecast, by Application 2020 & 2033
- Table 16: Global Industrial Salt Revenue million Forecast, by Application 2020 & 2033
- Table 17: Global Industrial Salt Revenue million Forecast, by Type 2020 & 2033
- Table 18: Global Industrial Salt Revenue million Forecast, by Country 2020 & 2033
- Table 19: United Kingdom Industrial Salt Revenue (million) Forecast, by Application 2020 & 2033
- Table 20: Germany Industrial Salt Revenue (million) Forecast, by Application 2020 & 2033
- Table 21: France Industrial Salt Revenue (million) Forecast, by Application 2020 & 2033
- Table 22: Italy Industrial Salt Revenue (million) Forecast, by Application 2020 & 2033
- Table 23: Spain Industrial Salt Revenue (million) Forecast, by Application 2020 & 2033
- Table 24: Russia Industrial Salt Revenue (million) Forecast, by Application 2020 & 2033
- Table 25: Benelux Industrial Salt Revenue (million) Forecast, by Application 2020 & 2033
- Table 26: Nordics Industrial Salt Revenue (million) Forecast, by Application 2020 & 2033
- Table 27: Rest of Europe Industrial Salt Revenue (million) Forecast, by Application 2020 & 2033
- Table 28: Global Industrial Salt Revenue million Forecast, by Application 2020 & 2033
- Table 29: Global Industrial Salt Revenue million Forecast, by Type 2020 & 2033
- Table 30: Global Industrial Salt Revenue million Forecast, by Country 2020 & 2033
- Table 31: Turkey Industrial Salt Revenue (million) Forecast, by Application 2020 & 2033
- Table 32: Israel Industrial Salt Revenue (million) Forecast, by Application 2020 & 2033
- Table 33: GCC Industrial Salt Revenue (million) Forecast, by Application 2020 & 2033
- Table 34: North Africa Industrial Salt Revenue (million) Forecast, by Application 2020 & 2033
- Table 35: South Africa Industrial Salt Revenue (million) Forecast, by Application 2020 & 2033
- Table 36: Rest of Middle East & Africa Industrial Salt Revenue (million) Forecast, by Application 2020 & 2033
- Table 37: Global Industrial Salt Revenue million Forecast, by Application 2020 & 2033
- Table 38: Global Industrial Salt Revenue million Forecast, by Type 2020 & 2033
- Table 39: Global Industrial Salt Revenue million Forecast, by Country 2020 & 2033
- Table 40: China Industrial Salt Revenue (million) Forecast, by Application 2020 & 2033
- Table 41: India Industrial Salt Revenue (million) Forecast, by Application 2020 & 2033
- Table 42: Japan Industrial Salt Revenue (million) Forecast, by Application 2020 & 2033
- Table 43: South Korea Industrial Salt Revenue (million) Forecast, by Application 2020 & 2033
- Table 44: ASEAN Industrial Salt Revenue (million) Forecast, by Application 2020 & 2033
- Table 45: Oceania Industrial Salt Revenue (million) Forecast, by Application 2020 & 2033
- Table 46: Rest of Asia Pacific Industrial Salt Revenue (million) Forecast, by Application 2020 & 2033
Frequently Asked Questions
1. What is the projected Compound Annual Growth Rate (CAGR) of the Industrial Salt?
The projected CAGR is approximately 1.4%.
2. Which companies are prominent players in the Industrial Salt?
Key companies in the market include Archean Group, Ahir Salt, GHCL, Sojitz, Naikai Salt, China National Salt, 9D Group, Yunnan Salt, Lantai Industry, Chengyuan Salt, Jingshen Salt & Chemical, Longwei, Chengkou, Lubei Chemical, Dadi Salt.
3. What are the main segments of the Industrial Salt?
The market segments include Application, Type.
4. Can you provide details about the market size?
The market size is estimated to be USD 15360 million as of 2022.
5. What are some drivers contributing to market growth?
N/A
6. What are the notable trends driving market growth?
N/A
7. Are there any restraints impacting market growth?
N/A
8. Can you provide examples of recent developments in the market?
N/A
9. What pricing options are available for accessing the report?
Pricing options include single-user, multi-user, and enterprise licenses priced at USD 4250.00, USD 6375.00, and USD 8500.00 respectively.
10. Is the market size provided in terms of value or volume?
The market size is provided in terms of value, measured in million.
11. Are there any specific market keywords associated with the report?
Yes, the market keyword associated with the report is "Industrial Salt," which aids in identifying and referencing the specific market segment covered.
12. How do I determine which pricing option suits my needs best?
The pricing options vary based on user requirements and access needs. Individual users may opt for single-user licenses, while businesses requiring broader access may choose multi-user or enterprise licenses for cost-effective access to the report.
13. Are there any additional resources or data provided in the Industrial Salt report?
While the report offers comprehensive insights, it's advisable to review the specific contents or supplementary materials provided to ascertain if additional resources or data are available.
14. How can I stay updated on further developments or reports in the Industrial Salt?
To stay informed about further developments, trends, and reports in the Industrial Salt, consider subscribing to industry newsletters, following relevant companies and organizations, or regularly checking reputable industry news sources and publications.
Methodology
Step 1 - Identification of Relevant Samples Size from Population Database


Step 2 - Approaches for Defining Global Market Size (Value, Volume* & Price*)

Note*: In applicable scenarios
Step 3 - Data Sources
Primary Research
- Web Analytics
- Survey Reports
- Research Institute
- Latest Research Reports
- Opinion Leaders
Secondary Research
- Annual Reports
- White Paper
- Latest Press Release
- Industry Association
- Paid Database
- Investor Presentations

Step 4 - Data Triangulation
Involves using different sources of information in order to increase the validity of a study
These sources are likely to be stakeholders in a program - participants, other researchers, program staff, other community members, and so on.
Then we put all data in single framework & apply various statistical tools to find out the dynamic on the market.
During the analysis stage, feedback from the stakeholder groups would be compared to determine areas of agreement as well as areas of divergence

