
Key Insights
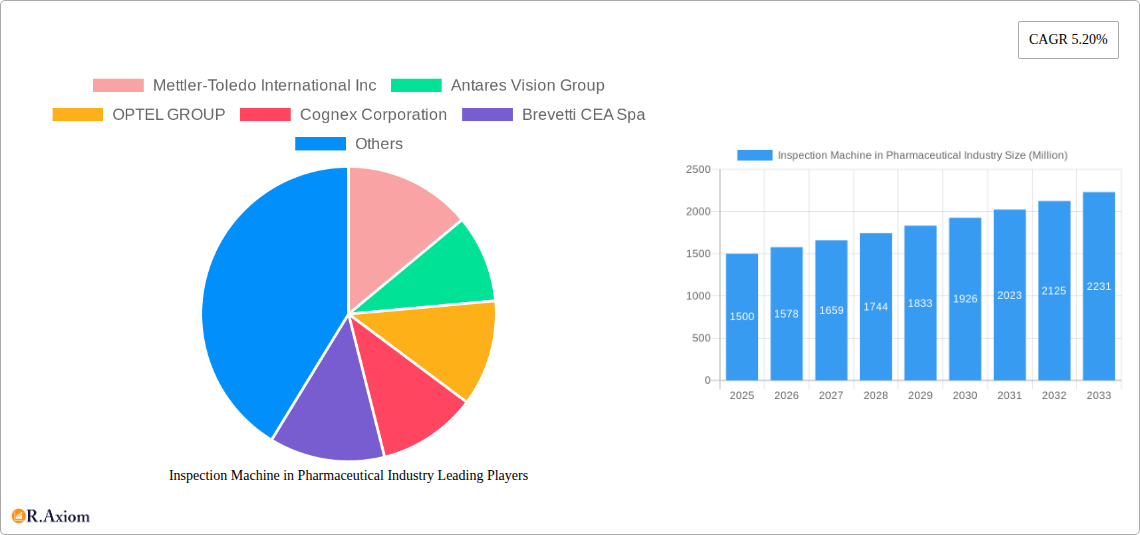
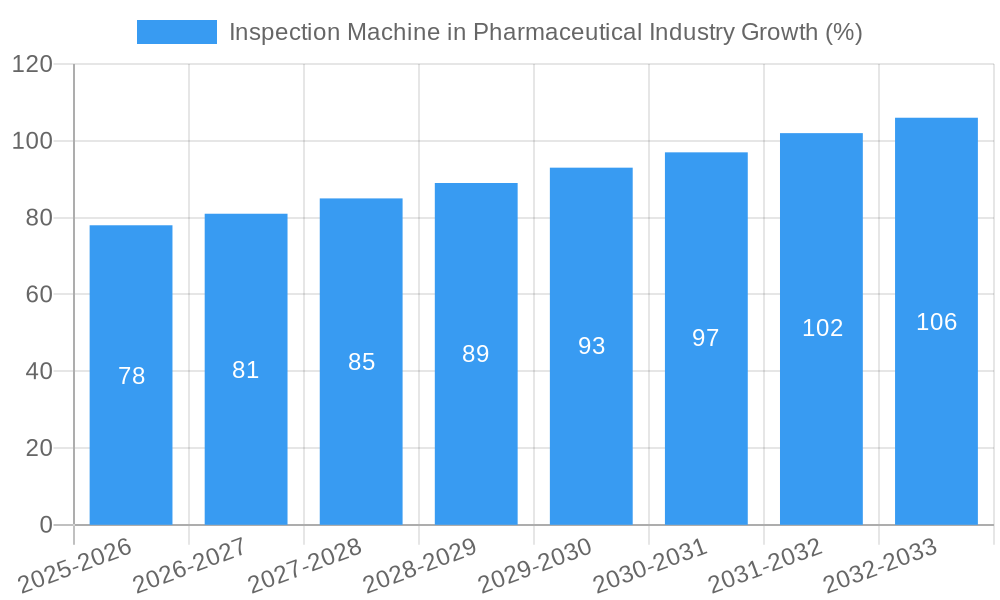
The pharmaceutical inspection machine market is experiencing robust growth, driven by increasing regulatory scrutiny, a rising demand for quality control, and the expanding global pharmaceutical industry. The market, valued at approximately $XX million in 2025, is projected to grow at a Compound Annual Growth Rate (CAGR) of 5.20% from 2025 to 2033. This growth is fueled by several key factors. Firstly, stringent regulatory compliance mandates, such as those from the FDA and EMA, necessitate advanced inspection systems to ensure product safety and efficacy, thereby driving adoption. Secondly, the increasing complexity of pharmaceutical products and packaging necessitates sophisticated inspection technologies capable of detecting even minor defects. This trend is particularly pronounced in the segment for vision inspection systems, x-ray inspection systems, and leak detection systems, which are experiencing above-average growth rates. Finally, the rise of personalized medicine and biologics is further boosting the demand for accurate and high-throughput inspection solutions. Growth is expected to be particularly strong in regions like North America and Asia-Pacific, driven by robust pharmaceutical manufacturing sectors and significant investments in advanced technologies. However, the high initial investment costs associated with advanced inspection machines and the potential for technological obsolescence could act as restraints.
The segmentation of the market reveals significant opportunities within specific areas. Pharmaceutical and biotech companies represent the largest end-user segment, reflecting the crucial role of quality control in this industry. Within product categories, Vision Inspection Systems and X-ray Inspection Systems are expected to maintain their leading positions, due to their versatility and ability to detect a wide range of defects. While established players like Mettler-Toledo, Antares Vision, and Cognex hold significant market share, the market also presents opportunities for smaller, specialized companies offering niche solutions or advanced technologies. Competitive pressures will likely continue, with companies focusing on innovation, partnerships, and strategic acquisitions to maintain a competitive edge. The forecast period (2025-2033) suggests continued market expansion, with growth potentially accelerating due to technological advancements and increasing industry consolidation.
Inspection Machine in Pharmaceutical Industry: A Comprehensive Market Report (2019-2033)
This comprehensive report provides an in-depth analysis of the Inspection Machine in Pharmaceutical Industry market, encompassing market size, growth projections, competitive landscape, technological advancements, and key trends from 2019 to 2033. The study period covers the historical period (2019-2024), the base year (2025), and the forecast period (2025-2033). The report is essential for stakeholders, including pharmaceutical companies, medical device manufacturers, inspection machine providers, investors, and regulatory bodies. The market is valued at $XX Million in 2025 and is projected to reach $XX Million by 2033.
Inspection Machine in Pharmaceutical Industry Market Concentration & Innovation
The global inspection machine market for the pharmaceutical industry exhibits a moderately concentrated landscape, with several key players holding significant market share. While precise market share data for each company requires further proprietary research, key players such as Mettler-Toledo International Inc, Antares Vision Group, OPTEL GROUP, and Cognex Corporation are estimated to collectively hold a xx% market share in 2025. However, the market is also characterized by the presence of numerous smaller, specialized players, particularly within niche segments. Innovation is a key driver, with continuous advancements in technologies like AI-powered vision systems, advanced X-ray inspection, and leak detection systems.
- Market Concentration: Moderately concentrated, with top players holding a significant but not dominant share.
- Innovation Drivers: Demand for higher throughput, improved accuracy, stringent regulatory compliance, and the need for advanced analytics.
- Regulatory Frameworks: Stringent regulations like FDA guidelines and GMP (Good Manufacturing Practices) drive the adoption of advanced inspection technologies.
- Product Substitutes: Limited direct substitutes exist; however, process improvements and manual inspection remain alternatives (though less efficient and accurate).
- End-User Trends: Increasing automation, digitalization, and a focus on reducing product recalls are key end-user trends shaping market growth.
- M&A Activities: The market has witnessed several mergers and acquisitions in recent years, with deal values ranging from $XX Million to $XX Million, primarily driven by the consolidation of market share and the acquisition of specialized technologies. Examples include, but are not limited to, the consolidation of smaller specialized firms by larger players like Antares Vision Group.
Inspection Machine in Pharmaceutical Industry Industry Trends & Insights
The pharmaceutical inspection machine market is experiencing robust growth, fueled by several key factors. The rising demand for higher production efficiency and product quality, stringent regulatory compliance requirements, and the increasing adoption of automation in pharmaceutical manufacturing are significant drivers. The market is estimated to experience a Compound Annual Growth Rate (CAGR) of xx% during the forecast period (2025-2033). Technological advancements, such as the integration of artificial intelligence and machine learning in inspection systems, are revolutionizing the industry, leading to improved accuracy, speed, and efficiency. Market penetration is currently estimated at xx%, with significant potential for growth in emerging markets and the expansion into new applications. Furthermore, changing consumer preferences for higher quality and safety standards are creating a supportive environment for market expansion. Competitive dynamics are characterized by both price competition and innovation-driven differentiation, with leading players focused on developing advanced technologies and expanding their product portfolios.
Dominant Markets & Segments in Inspection Machine in Pharmaceutical Industry
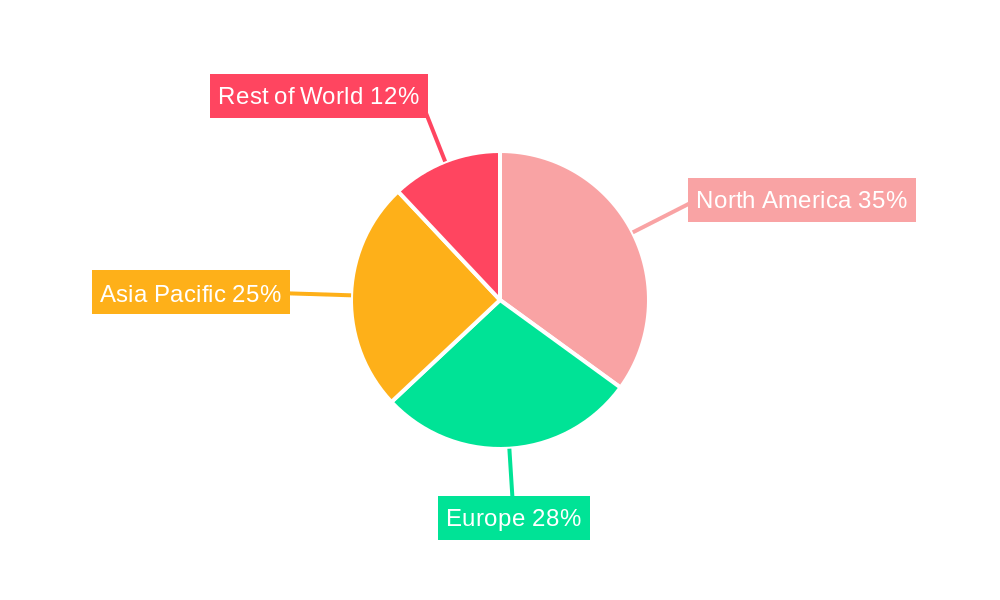
The North American region is currently the dominant market for pharmaceutical inspection machines, driven by high pharmaceutical production, stringent regulatory requirements, and advanced technological adoption. Within this region, the United States holds the largest market share. Europe also represents a significant market, with strong regulatory frameworks and a large pharmaceutical industry. Among product segments, vision inspection systems dominate the market, owing to their versatility and ability to detect a wide range of defects.
- Dominant Regions: North America (particularly the U.S.) and Europe.
- Key Drivers for North American Dominance: Stringent FDA regulations, high pharmaceutical production, and early adoption of advanced technologies.
- Key Drivers for European Dominance: Stringent EU regulations, large pharmaceutical industry, and focus on innovation.
- Dominant End-User Segment: Pharmaceutical and Biotech Companies, followed by Medical Device Companies. These segments are driven by the need to ensure high product quality and regulatory compliance.
- Dominant Product Segment: Vision inspection systems due to their versatility and relatively lower cost compared to other advanced systems.
Inspection Machine in Pharmaceutical Industry Product Developments
Recent years have witnessed significant advancements in pharmaceutical inspection machine technology. The integration of AI and machine learning algorithms has enabled improved defect detection rates and reduced false positives. Miniaturization of components has led to more compact and cost-effective inspection systems. Moreover, the development of advanced sensor technologies and improved data analytics capabilities has facilitated greater efficiency and automation in the inspection process. These innovations are well-aligned with industry needs for greater speed, accuracy, and compliance.
Report Scope & Segmentation Analysis
This report segments the market based on end-user and product type.
End-User:
- Pharmaceutical and Biotech Companies: This segment holds the largest market share, driven by stringent quality control needs. Growth is projected at xx% CAGR during the forecast period. Competitive dynamics are intense due to the large number of players vying for contracts.
- Medical Device Companies: This segment exhibits moderate growth, driven by the increasing demand for high-quality medical devices. Growth is projected at xx% CAGR. Competition is moderate.
- Others: This segment includes contract manufacturing organizations (CMOs) and other related industries. Growth is anticipated at xx% CAGR. Competitive dynamics are diverse.
Product:
- Vision Inspection System: This segment dominates the market due to its versatility and cost-effectiveness. Growth is projected at xx% CAGR. Competition is based on image processing capabilities and integration with other systems.
- X-ray Inspection System: This segment is experiencing strong growth due to its ability to detect internal defects. Growth is projected at xx% CAGR. Competition is based on image resolution and speed of inspection.
- Leak Detection System: This segment is growing steadily driven by the need to prevent contamination. Growth is projected at xx% CAGR. Competition is based on sensitivity and speed.
- Metal Detectors: This segment demonstrates consistent growth, driven by safety and regulatory compliance. Growth is projected at xx% CAGR. Competition is based on detection sensitivity and throughput.
- Others: This includes other specialized inspection systems. Growth is expected to be at xx% CAGR. Competitive dynamics vary greatly depending on the specialization.
Key Drivers of Inspection Machine in Pharmaceutical Industry Growth
Several factors are driving the growth of the inspection machine market in the pharmaceutical industry. Stringent regulatory requirements demanding high product quality and safety are paramount. The increasing adoption of automation and digitalization in pharmaceutical manufacturing enhances efficiency and reduces human error. Technological advancements, such as AI-powered vision systems and advanced X-ray inspection techniques, are leading to improved inspection accuracy and speed. Finally, the growing demand for higher production throughput to meet the increasing global demand for pharmaceutical products is a significant driver.
Challenges in the Inspection Machine in Pharmaceutical Industry Sector
The pharmaceutical inspection machine market faces several challenges. High initial investment costs for advanced inspection systems can be a barrier for smaller companies. The complexity of integrating inspection systems into existing manufacturing lines can also pose a challenge. Furthermore, maintaining compliance with evolving regulatory requirements and ensuring the accuracy and reliability of inspection systems is crucial and presents an ongoing challenge. Supply chain disruptions, exacerbated in recent years, have added further complexity. Finally, intense competition among established players and the emergence of new entrants creates pressure on pricing and profit margins.
Emerging Opportunities in Inspection Machine in Pharmaceutical Industry
The market presents several emerging opportunities. The increasing adoption of Industry 4.0 technologies, such as the Internet of Things (IoT) and cloud computing, will further enhance data analytics and process optimization. The expansion into emerging markets with growing pharmaceutical industries presents significant potential for growth. The development of more specialized inspection systems tailored to specific drug delivery formats and product types represents a key opportunity for innovation. Finally, the integration of advanced analytics and predictive maintenance technologies will improve operational efficiency and reduce downtime.
Leading Players in the Inspection Machine in Pharmaceutical Industry Market
- Mettler-Toledo International Inc
- Antares Vision Group
- OPTEL GROUP
- Cognex Corporation
- Brevetti CEA Spa
- Omron Corporation
- Thermo Fisher Scientific
- ACG
- Robert Bosch GmbH
- Körber AG
- Jekson Vision
- Teledyne Technologies
Key Developments in Inspection Machine in Pharmaceutical Industry Industry
- January 2023: Hanmi Pharmaceutical Company signed an agreement with Euclid Medical Products to sell JVM's Vizen EX, a fully automated drug inspection machine capable of inspecting up to 400 pills per minute. This highlights the growing demand for high-throughput, automated inspection systems.
- October 2022: Antares Vision Group launched the VRI-VI 060 S, an automatic visual inspection system for pre-filled syringes. This showcases the ongoing innovation in visual inspection technologies for specialized drug delivery formats.
Strategic Outlook for Inspection Machine in Pharmaceutical Industry Market
The future of the pharmaceutical inspection machine market appears bright. Continued technological advancements, coupled with the growing need for high-quality and safe pharmaceutical products, will drive market growth. The increasing adoption of automation, digitalization, and data analytics will further enhance efficiency and reduce costs. Expansion into emerging markets and the development of specialized inspection systems for new drug delivery formats will create new growth opportunities. The market is poised for significant expansion, particularly in the areas of AI-powered vision systems, advanced X-ray inspection, and integrated data analytics platforms.
Inspection Machine in Pharmaceutical Industry Segmentation
-
1. Product
- 1.1. Vision Inspection System
- 1.2. X-ray Inspection System
- 1.3. Leak Detection System
- 1.4. Metal Detectors
- 1.5. Others
-
2. End User
- 2.1. Pharmaceutical and Biotech Companies
- 2.2. Medical Device Companies
- 2.3. Others
Inspection Machine in Pharmaceutical Industry Segmentation By Geography
-
1. North America
- 1.1. United States
- 1.2. Canada
- 1.3. Mexico
-
2. Europe
- 2.1. Germany
- 2.2. United Kingdom
- 2.3. France
- 2.4. Italy
- 2.5. Spain
- 2.6. Rest of Europe
-
3. Asia Pacific
- 3.1. China
- 3.2. Japan
- 3.3. India
- 3.4. Australia
- 3.5. South Korea
- 3.6. Rest of Asia Pacific
-
4. Middle East and Africa
- 4.1. GCC
- 4.2. South Africa
- 4.3. Rest of Middle East and Africa
-
5. South America
- 5.1. Brazil
- 5.2. Argentina
- 5.3. Rest of South America
Inspection Machine in Pharmaceutical Industry REPORT HIGHLIGHTS
| Aspects | Details |
|---|---|
| Study Period | 2019-2033 |
| Base Year | 2024 |
| Estimated Year | 2025 |
| Forecast Period | 2025-2033 |
| Historical Period | 2019-2024 |
| Growth Rate | CAGR of 5.20% from 2019-2033 |
| Segmentation |
|
Table of Contents
- 1. Introduction
- 1.1. Research Scope
- 1.2. Market Segmentation
- 1.3. Research Methodology
- 1.4. Definitions and Assumptions
- 2. Executive Summary
- 2.1. Introduction
- 3. Market Dynamics
- 3.1. Introduction
- 3.2. Market Drivers
- 3.2.1. Increasing Regulatory Compliance With Good Manufacturing Practices; Growing Product Recalls
- 3.3. Market Restrains
- 3.3.1. Growing Demand for Refurbished Equipment
- 3.4. Market Trends
- 3.4.1. Vision Inspection System Segment is Expected to Hold a Significant Market Share Over the Forecast Period
- 4. Market Factor Analysis
- 4.1. Porters Five Forces
- 4.2. Supply/Value Chain
- 4.3. PESTEL analysis
- 4.4. Market Entropy
- 4.5. Patent/Trademark Analysis
- 5. Global Inspection Machine in Pharmaceutical Industry Analysis, Insights and Forecast, 2019-2031
- 5.1. Market Analysis, Insights and Forecast - by Product
- 5.1.1. Vision Inspection System
- 5.1.2. X-ray Inspection System
- 5.1.3. Leak Detection System
- 5.1.4. Metal Detectors
- 5.1.5. Others
- 5.2. Market Analysis, Insights and Forecast - by End User
- 5.2.1. Pharmaceutical and Biotech Companies
- 5.2.2. Medical Device Companies
- 5.2.3. Others
- 5.3. Market Analysis, Insights and Forecast - by Region
- 5.3.1. North America
- 5.3.2. Europe
- 5.3.3. Asia Pacific
- 5.3.4. Middle East and Africa
- 5.3.5. South America
- 5.1. Market Analysis, Insights and Forecast - by Product
- 6. North America Inspection Machine in Pharmaceutical Industry Analysis, Insights and Forecast, 2019-2031
- 6.1. Market Analysis, Insights and Forecast - by Product
- 6.1.1. Vision Inspection System
- 6.1.2. X-ray Inspection System
- 6.1.3. Leak Detection System
- 6.1.4. Metal Detectors
- 6.1.5. Others
- 6.2. Market Analysis, Insights and Forecast - by End User
- 6.2.1. Pharmaceutical and Biotech Companies
- 6.2.2. Medical Device Companies
- 6.2.3. Others
- 6.1. Market Analysis, Insights and Forecast - by Product
- 7. Europe Inspection Machine in Pharmaceutical Industry Analysis, Insights and Forecast, 2019-2031
- 7.1. Market Analysis, Insights and Forecast - by Product
- 7.1.1. Vision Inspection System
- 7.1.2. X-ray Inspection System
- 7.1.3. Leak Detection System
- 7.1.4. Metal Detectors
- 7.1.5. Others
- 7.2. Market Analysis, Insights and Forecast - by End User
- 7.2.1. Pharmaceutical and Biotech Companies
- 7.2.2. Medical Device Companies
- 7.2.3. Others
- 7.1. Market Analysis, Insights and Forecast - by Product
- 8. Asia Pacific Inspection Machine in Pharmaceutical Industry Analysis, Insights and Forecast, 2019-2031
- 8.1. Market Analysis, Insights and Forecast - by Product
- 8.1.1. Vision Inspection System
- 8.1.2. X-ray Inspection System
- 8.1.3. Leak Detection System
- 8.1.4. Metal Detectors
- 8.1.5. Others
- 8.2. Market Analysis, Insights and Forecast - by End User
- 8.2.1. Pharmaceutical and Biotech Companies
- 8.2.2. Medical Device Companies
- 8.2.3. Others
- 8.1. Market Analysis, Insights and Forecast - by Product
- 9. Middle East and Africa Inspection Machine in Pharmaceutical Industry Analysis, Insights and Forecast, 2019-2031
- 9.1. Market Analysis, Insights and Forecast - by Product
- 9.1.1. Vision Inspection System
- 9.1.2. X-ray Inspection System
- 9.1.3. Leak Detection System
- 9.1.4. Metal Detectors
- 9.1.5. Others
- 9.2. Market Analysis, Insights and Forecast - by End User
- 9.2.1. Pharmaceutical and Biotech Companies
- 9.2.2. Medical Device Companies
- 9.2.3. Others
- 9.1. Market Analysis, Insights and Forecast - by Product
- 10. South America Inspection Machine in Pharmaceutical Industry Analysis, Insights and Forecast, 2019-2031
- 10.1. Market Analysis, Insights and Forecast - by Product
- 10.1.1. Vision Inspection System
- 10.1.2. X-ray Inspection System
- 10.1.3. Leak Detection System
- 10.1.4. Metal Detectors
- 10.1.5. Others
- 10.2. Market Analysis, Insights and Forecast - by End User
- 10.2.1. Pharmaceutical and Biotech Companies
- 10.2.2. Medical Device Companies
- 10.2.3. Others
- 10.1. Market Analysis, Insights and Forecast - by Product
- 11. North America Inspection Machine in Pharmaceutical Industry Analysis, Insights and Forecast, 2019-2031
- 11.1. Market Analysis, Insights and Forecast - By Country/Sub-region
- 11.1.1 United States
- 11.1.2 Canada
- 11.1.3 Mexico
- 12. South America Inspection Machine in Pharmaceutical Industry Analysis, Insights and Forecast, 2019-2031
- 12.1. Market Analysis, Insights and Forecast - By Country/Sub-region
- 12.1.1 Brazil
- 12.1.2 Mexico
- 12.1.3 Rest of South America
- 13. Europe Inspection Machine in Pharmaceutical Industry Analysis, Insights and Forecast, 2019-2031
- 13.1. Market Analysis, Insights and Forecast - By Country/Sub-region
- 13.1.1 Germany
- 13.1.2 United Kingdom
- 13.1.3 France
- 13.1.4 Italy
- 13.1.5 Spain
- 13.1.6 Rest of Europe
- 14. Asia Pacific Inspection Machine in Pharmaceutical Industry Analysis, Insights and Forecast, 2019-2031
- 14.1. Market Analysis, Insights and Forecast - By Country/Sub-region
- 14.1.1 China
- 14.1.2 Japan
- 14.1.3 India
- 14.1.4 South Korea
- 14.1.5 Taiwan
- 14.1.6 Australia
- 14.1.7 Rest of Asia-Pacific
- 15. MEA Inspection Machine in Pharmaceutical Industry Analysis, Insights and Forecast, 2019-2031
- 15.1. Market Analysis, Insights and Forecast - By Country/Sub-region
- 15.1.1 Middle East
- 15.1.2 Africa
- 16. Competitive Analysis
- 16.1. Global Market Share Analysis 2024
- 16.2. Company Profiles
- 16.2.1 Mettler-Toledo International Inc
- 16.2.1.1. Overview
- 16.2.1.2. Products
- 16.2.1.3. SWOT Analysis
- 16.2.1.4. Recent Developments
- 16.2.1.5. Financials (Based on Availability)
- 16.2.2 Antares Vision Group
- 16.2.2.1. Overview
- 16.2.2.2. Products
- 16.2.2.3. SWOT Analysis
- 16.2.2.4. Recent Developments
- 16.2.2.5. Financials (Based on Availability)
- 16.2.3 OPTEL GROUP
- 16.2.3.1. Overview
- 16.2.3.2. Products
- 16.2.3.3. SWOT Analysis
- 16.2.3.4. Recent Developments
- 16.2.3.5. Financials (Based on Availability)
- 16.2.4 Cognex Corporation
- 16.2.4.1. Overview
- 16.2.4.2. Products
- 16.2.4.3. SWOT Analysis
- 16.2.4.4. Recent Developments
- 16.2.4.5. Financials (Based on Availability)
- 16.2.5 Brevetti CEA Spa
- 16.2.5.1. Overview
- 16.2.5.2. Products
- 16.2.5.3. SWOT Analysis
- 16.2.5.4. Recent Developments
- 16.2.5.5. Financials (Based on Availability)
- 16.2.6 Omron Corporation
- 16.2.6.1. Overview
- 16.2.6.2. Products
- 16.2.6.3. SWOT Analysis
- 16.2.6.4. Recent Developments
- 16.2.6.5. Financials (Based on Availability)
- 16.2.7 Thermo Fisher Scientific*List Not Exhaustive
- 16.2.7.1. Overview
- 16.2.7.2. Products
- 16.2.7.3. SWOT Analysis
- 16.2.7.4. Recent Developments
- 16.2.7.5. Financials (Based on Availability)
- 16.2.8 ACG
- 16.2.8.1. Overview
- 16.2.8.2. Products
- 16.2.8.3. SWOT Analysis
- 16.2.8.4. Recent Developments
- 16.2.8.5. Financials (Based on Availability)
- 16.2.9 Robert Bosch GmbH
- 16.2.9.1. Overview
- 16.2.9.2. Products
- 16.2.9.3. SWOT Analysis
- 16.2.9.4. Recent Developments
- 16.2.9.5. Financials (Based on Availability)
- 16.2.10 Korber AG
- 16.2.10.1. Overview
- 16.2.10.2. Products
- 16.2.10.3. SWOT Analysis
- 16.2.10.4. Recent Developments
- 16.2.10.5. Financials (Based on Availability)
- 16.2.11 Jekson Vision
- 16.2.11.1. Overview
- 16.2.11.2. Products
- 16.2.11.3. SWOT Analysis
- 16.2.11.4. Recent Developments
- 16.2.11.5. Financials (Based on Availability)
- 16.2.12 Teledyne Technologies
- 16.2.12.1. Overview
- 16.2.12.2. Products
- 16.2.12.3. SWOT Analysis
- 16.2.12.4. Recent Developments
- 16.2.12.5. Financials (Based on Availability)
- 16.2.1 Mettler-Toledo International Inc
List of Figures
- Figure 1: Global Inspection Machine in Pharmaceutical Industry Revenue Breakdown (Million, %) by Region 2024 & 2032
- Figure 2: Global Inspection Machine in Pharmaceutical Industry Volume Breakdown (K Units, %) by Region 2024 & 2032
- Figure 3: North America Inspection Machine in Pharmaceutical Industry Revenue (Million), by Country 2024 & 2032
- Figure 4: North America Inspection Machine in Pharmaceutical Industry Volume (K Units), by Country 2024 & 2032
- Figure 5: North America Inspection Machine in Pharmaceutical Industry Revenue Share (%), by Country 2024 & 2032
- Figure 6: North America Inspection Machine in Pharmaceutical Industry Volume Share (%), by Country 2024 & 2032
- Figure 7: South America Inspection Machine in Pharmaceutical Industry Revenue (Million), by Country 2024 & 2032
- Figure 8: South America Inspection Machine in Pharmaceutical Industry Volume (K Units), by Country 2024 & 2032
- Figure 9: South America Inspection Machine in Pharmaceutical Industry Revenue Share (%), by Country 2024 & 2032
- Figure 10: South America Inspection Machine in Pharmaceutical Industry Volume Share (%), by Country 2024 & 2032
- Figure 11: Europe Inspection Machine in Pharmaceutical Industry Revenue (Million), by Country 2024 & 2032
- Figure 12: Europe Inspection Machine in Pharmaceutical Industry Volume (K Units), by Country 2024 & 2032
- Figure 13: Europe Inspection Machine in Pharmaceutical Industry Revenue Share (%), by Country 2024 & 2032
- Figure 14: Europe Inspection Machine in Pharmaceutical Industry Volume Share (%), by Country 2024 & 2032
- Figure 15: Asia Pacific Inspection Machine in Pharmaceutical Industry Revenue (Million), by Country 2024 & 2032
- Figure 16: Asia Pacific Inspection Machine in Pharmaceutical Industry Volume (K Units), by Country 2024 & 2032
- Figure 17: Asia Pacific Inspection Machine in Pharmaceutical Industry Revenue Share (%), by Country 2024 & 2032
- Figure 18: Asia Pacific Inspection Machine in Pharmaceutical Industry Volume Share (%), by Country 2024 & 2032
- Figure 19: MEA Inspection Machine in Pharmaceutical Industry Revenue (Million), by Country 2024 & 2032
- Figure 20: MEA Inspection Machine in Pharmaceutical Industry Volume (K Units), by Country 2024 & 2032
- Figure 21: MEA Inspection Machine in Pharmaceutical Industry Revenue Share (%), by Country 2024 & 2032
- Figure 22: MEA Inspection Machine in Pharmaceutical Industry Volume Share (%), by Country 2024 & 2032
- Figure 23: North America Inspection Machine in Pharmaceutical Industry Revenue (Million), by Product 2024 & 2032
- Figure 24: North America Inspection Machine in Pharmaceutical Industry Volume (K Units), by Product 2024 & 2032
- Figure 25: North America Inspection Machine in Pharmaceutical Industry Revenue Share (%), by Product 2024 & 2032
- Figure 26: North America Inspection Machine in Pharmaceutical Industry Volume Share (%), by Product 2024 & 2032
- Figure 27: North America Inspection Machine in Pharmaceutical Industry Revenue (Million), by End User 2024 & 2032
- Figure 28: North America Inspection Machine in Pharmaceutical Industry Volume (K Units), by End User 2024 & 2032
- Figure 29: North America Inspection Machine in Pharmaceutical Industry Revenue Share (%), by End User 2024 & 2032
- Figure 30: North America Inspection Machine in Pharmaceutical Industry Volume Share (%), by End User 2024 & 2032
- Figure 31: North America Inspection Machine in Pharmaceutical Industry Revenue (Million), by Country 2024 & 2032
- Figure 32: North America Inspection Machine in Pharmaceutical Industry Volume (K Units), by Country 2024 & 2032
- Figure 33: North America Inspection Machine in Pharmaceutical Industry Revenue Share (%), by Country 2024 & 2032
- Figure 34: North America Inspection Machine in Pharmaceutical Industry Volume Share (%), by Country 2024 & 2032
- Figure 35: Europe Inspection Machine in Pharmaceutical Industry Revenue (Million), by Product 2024 & 2032
- Figure 36: Europe Inspection Machine in Pharmaceutical Industry Volume (K Units), by Product 2024 & 2032
- Figure 37: Europe Inspection Machine in Pharmaceutical Industry Revenue Share (%), by Product 2024 & 2032
- Figure 38: Europe Inspection Machine in Pharmaceutical Industry Volume Share (%), by Product 2024 & 2032
- Figure 39: Europe Inspection Machine in Pharmaceutical Industry Revenue (Million), by End User 2024 & 2032
- Figure 40: Europe Inspection Machine in Pharmaceutical Industry Volume (K Units), by End User 2024 & 2032
- Figure 41: Europe Inspection Machine in Pharmaceutical Industry Revenue Share (%), by End User 2024 & 2032
- Figure 42: Europe Inspection Machine in Pharmaceutical Industry Volume Share (%), by End User 2024 & 2032
- Figure 43: Europe Inspection Machine in Pharmaceutical Industry Revenue (Million), by Country 2024 & 2032
- Figure 44: Europe Inspection Machine in Pharmaceutical Industry Volume (K Units), by Country 2024 & 2032
- Figure 45: Europe Inspection Machine in Pharmaceutical Industry Revenue Share (%), by Country 2024 & 2032
- Figure 46: Europe Inspection Machine in Pharmaceutical Industry Volume Share (%), by Country 2024 & 2032
- Figure 47: Asia Pacific Inspection Machine in Pharmaceutical Industry Revenue (Million), by Product 2024 & 2032
- Figure 48: Asia Pacific Inspection Machine in Pharmaceutical Industry Volume (K Units), by Product 2024 & 2032
- Figure 49: Asia Pacific Inspection Machine in Pharmaceutical Industry Revenue Share (%), by Product 2024 & 2032
- Figure 50: Asia Pacific Inspection Machine in Pharmaceutical Industry Volume Share (%), by Product 2024 & 2032
- Figure 51: Asia Pacific Inspection Machine in Pharmaceutical Industry Revenue (Million), by End User 2024 & 2032
- Figure 52: Asia Pacific Inspection Machine in Pharmaceutical Industry Volume (K Units), by End User 2024 & 2032
- Figure 53: Asia Pacific Inspection Machine in Pharmaceutical Industry Revenue Share (%), by End User 2024 & 2032
- Figure 54: Asia Pacific Inspection Machine in Pharmaceutical Industry Volume Share (%), by End User 2024 & 2032
- Figure 55: Asia Pacific Inspection Machine in Pharmaceutical Industry Revenue (Million), by Country 2024 & 2032
- Figure 56: Asia Pacific Inspection Machine in Pharmaceutical Industry Volume (K Units), by Country 2024 & 2032
- Figure 57: Asia Pacific Inspection Machine in Pharmaceutical Industry Revenue Share (%), by Country 2024 & 2032
- Figure 58: Asia Pacific Inspection Machine in Pharmaceutical Industry Volume Share (%), by Country 2024 & 2032
- Figure 59: Middle East and Africa Inspection Machine in Pharmaceutical Industry Revenue (Million), by Product 2024 & 2032
- Figure 60: Middle East and Africa Inspection Machine in Pharmaceutical Industry Volume (K Units), by Product 2024 & 2032
- Figure 61: Middle East and Africa Inspection Machine in Pharmaceutical Industry Revenue Share (%), by Product 2024 & 2032
- Figure 62: Middle East and Africa Inspection Machine in Pharmaceutical Industry Volume Share (%), by Product 2024 & 2032
- Figure 63: Middle East and Africa Inspection Machine in Pharmaceutical Industry Revenue (Million), by End User 2024 & 2032
- Figure 64: Middle East and Africa Inspection Machine in Pharmaceutical Industry Volume (K Units), by End User 2024 & 2032
- Figure 65: Middle East and Africa Inspection Machine in Pharmaceutical Industry Revenue Share (%), by End User 2024 & 2032
- Figure 66: Middle East and Africa Inspection Machine in Pharmaceutical Industry Volume Share (%), by End User 2024 & 2032
- Figure 67: Middle East and Africa Inspection Machine in Pharmaceutical Industry Revenue (Million), by Country 2024 & 2032
- Figure 68: Middle East and Africa Inspection Machine in Pharmaceutical Industry Volume (K Units), by Country 2024 & 2032
- Figure 69: Middle East and Africa Inspection Machine in Pharmaceutical Industry Revenue Share (%), by Country 2024 & 2032
- Figure 70: Middle East and Africa Inspection Machine in Pharmaceutical Industry Volume Share (%), by Country 2024 & 2032
- Figure 71: South America Inspection Machine in Pharmaceutical Industry Revenue (Million), by Product 2024 & 2032
- Figure 72: South America Inspection Machine in Pharmaceutical Industry Volume (K Units), by Product 2024 & 2032
- Figure 73: South America Inspection Machine in Pharmaceutical Industry Revenue Share (%), by Product 2024 & 2032
- Figure 74: South America Inspection Machine in Pharmaceutical Industry Volume Share (%), by Product 2024 & 2032
- Figure 75: South America Inspection Machine in Pharmaceutical Industry Revenue (Million), by End User 2024 & 2032
- Figure 76: South America Inspection Machine in Pharmaceutical Industry Volume (K Units), by End User 2024 & 2032
- Figure 77: South America Inspection Machine in Pharmaceutical Industry Revenue Share (%), by End User 2024 & 2032
- Figure 78: South America Inspection Machine in Pharmaceutical Industry Volume Share (%), by End User 2024 & 2032
- Figure 79: South America Inspection Machine in Pharmaceutical Industry Revenue (Million), by Country 2024 & 2032
- Figure 80: South America Inspection Machine in Pharmaceutical Industry Volume (K Units), by Country 2024 & 2032
- Figure 81: South America Inspection Machine in Pharmaceutical Industry Revenue Share (%), by Country 2024 & 2032
- Figure 82: South America Inspection Machine in Pharmaceutical Industry Volume Share (%), by Country 2024 & 2032
List of Tables
- Table 1: Global Inspection Machine in Pharmaceutical Industry Revenue Million Forecast, by Region 2019 & 2032
- Table 2: Global Inspection Machine in Pharmaceutical Industry Volume K Units Forecast, by Region 2019 & 2032
- Table 3: Global Inspection Machine in Pharmaceutical Industry Revenue Million Forecast, by Product 2019 & 2032
- Table 4: Global Inspection Machine in Pharmaceutical Industry Volume K Units Forecast, by Product 2019 & 2032
- Table 5: Global Inspection Machine in Pharmaceutical Industry Revenue Million Forecast, by End User 2019 & 2032
- Table 6: Global Inspection Machine in Pharmaceutical Industry Volume K Units Forecast, by End User 2019 & 2032
- Table 7: Global Inspection Machine in Pharmaceutical Industry Revenue Million Forecast, by Region 2019 & 2032
- Table 8: Global Inspection Machine in Pharmaceutical Industry Volume K Units Forecast, by Region 2019 & 2032
- Table 9: Global Inspection Machine in Pharmaceutical Industry Revenue Million Forecast, by Country 2019 & 2032
- Table 10: Global Inspection Machine in Pharmaceutical Industry Volume K Units Forecast, by Country 2019 & 2032
- Table 11: United States Inspection Machine in Pharmaceutical Industry Revenue (Million) Forecast, by Application 2019 & 2032
- Table 12: United States Inspection Machine in Pharmaceutical Industry Volume (K Units) Forecast, by Application 2019 & 2032
- Table 13: Canada Inspection Machine in Pharmaceutical Industry Revenue (Million) Forecast, by Application 2019 & 2032
- Table 14: Canada Inspection Machine in Pharmaceutical Industry Volume (K Units) Forecast, by Application 2019 & 2032
- Table 15: Mexico Inspection Machine in Pharmaceutical Industry Revenue (Million) Forecast, by Application 2019 & 2032
- Table 16: Mexico Inspection Machine in Pharmaceutical Industry Volume (K Units) Forecast, by Application 2019 & 2032
- Table 17: Global Inspection Machine in Pharmaceutical Industry Revenue Million Forecast, by Country 2019 & 2032
- Table 18: Global Inspection Machine in Pharmaceutical Industry Volume K Units Forecast, by Country 2019 & 2032
- Table 19: Brazil Inspection Machine in Pharmaceutical Industry Revenue (Million) Forecast, by Application 2019 & 2032
- Table 20: Brazil Inspection Machine in Pharmaceutical Industry Volume (K Units) Forecast, by Application 2019 & 2032
- Table 21: Mexico Inspection Machine in Pharmaceutical Industry Revenue (Million) Forecast, by Application 2019 & 2032
- Table 22: Mexico Inspection Machine in Pharmaceutical Industry Volume (K Units) Forecast, by Application 2019 & 2032
- Table 23: Rest of South America Inspection Machine in Pharmaceutical Industry Revenue (Million) Forecast, by Application 2019 & 2032
- Table 24: Rest of South America Inspection Machine in Pharmaceutical Industry Volume (K Units) Forecast, by Application 2019 & 2032
- Table 25: Global Inspection Machine in Pharmaceutical Industry Revenue Million Forecast, by Country 2019 & 2032
- Table 26: Global Inspection Machine in Pharmaceutical Industry Volume K Units Forecast, by Country 2019 & 2032
- Table 27: Germany Inspection Machine in Pharmaceutical Industry Revenue (Million) Forecast, by Application 2019 & 2032
- Table 28: Germany Inspection Machine in Pharmaceutical Industry Volume (K Units) Forecast, by Application 2019 & 2032
- Table 29: United Kingdom Inspection Machine in Pharmaceutical Industry Revenue (Million) Forecast, by Application 2019 & 2032
- Table 30: United Kingdom Inspection Machine in Pharmaceutical Industry Volume (K Units) Forecast, by Application 2019 & 2032
- Table 31: France Inspection Machine in Pharmaceutical Industry Revenue (Million) Forecast, by Application 2019 & 2032
- Table 32: France Inspection Machine in Pharmaceutical Industry Volume (K Units) Forecast, by Application 2019 & 2032
- Table 33: Italy Inspection Machine in Pharmaceutical Industry Revenue (Million) Forecast, by Application 2019 & 2032
- Table 34: Italy Inspection Machine in Pharmaceutical Industry Volume (K Units) Forecast, by Application 2019 & 2032
- Table 35: Spain Inspection Machine in Pharmaceutical Industry Revenue (Million) Forecast, by Application 2019 & 2032
- Table 36: Spain Inspection Machine in Pharmaceutical Industry Volume (K Units) Forecast, by Application 2019 & 2032
- Table 37: Rest of Europe Inspection Machine in Pharmaceutical Industry Revenue (Million) Forecast, by Application 2019 & 2032
- Table 38: Rest of Europe Inspection Machine in Pharmaceutical Industry Volume (K Units) Forecast, by Application 2019 & 2032
- Table 39: Global Inspection Machine in Pharmaceutical Industry Revenue Million Forecast, by Country 2019 & 2032
- Table 40: Global Inspection Machine in Pharmaceutical Industry Volume K Units Forecast, by Country 2019 & 2032
- Table 41: China Inspection Machine in Pharmaceutical Industry Revenue (Million) Forecast, by Application 2019 & 2032
- Table 42: China Inspection Machine in Pharmaceutical Industry Volume (K Units) Forecast, by Application 2019 & 2032
- Table 43: Japan Inspection Machine in Pharmaceutical Industry Revenue (Million) Forecast, by Application 2019 & 2032
- Table 44: Japan Inspection Machine in Pharmaceutical Industry Volume (K Units) Forecast, by Application 2019 & 2032
- Table 45: India Inspection Machine in Pharmaceutical Industry Revenue (Million) Forecast, by Application 2019 & 2032
- Table 46: India Inspection Machine in Pharmaceutical Industry Volume (K Units) Forecast, by Application 2019 & 2032
- Table 47: South Korea Inspection Machine in Pharmaceutical Industry Revenue (Million) Forecast, by Application 2019 & 2032
- Table 48: South Korea Inspection Machine in Pharmaceutical Industry Volume (K Units) Forecast, by Application 2019 & 2032
- Table 49: Taiwan Inspection Machine in Pharmaceutical Industry Revenue (Million) Forecast, by Application 2019 & 2032
- Table 50: Taiwan Inspection Machine in Pharmaceutical Industry Volume (K Units) Forecast, by Application 2019 & 2032
- Table 51: Australia Inspection Machine in Pharmaceutical Industry Revenue (Million) Forecast, by Application 2019 & 2032
- Table 52: Australia Inspection Machine in Pharmaceutical Industry Volume (K Units) Forecast, by Application 2019 & 2032
- Table 53: Rest of Asia-Pacific Inspection Machine in Pharmaceutical Industry Revenue (Million) Forecast, by Application 2019 & 2032
- Table 54: Rest of Asia-Pacific Inspection Machine in Pharmaceutical Industry Volume (K Units) Forecast, by Application 2019 & 2032
- Table 55: Global Inspection Machine in Pharmaceutical Industry Revenue Million Forecast, by Country 2019 & 2032
- Table 56: Global Inspection Machine in Pharmaceutical Industry Volume K Units Forecast, by Country 2019 & 2032
- Table 57: Middle East Inspection Machine in Pharmaceutical Industry Revenue (Million) Forecast, by Application 2019 & 2032
- Table 58: Middle East Inspection Machine in Pharmaceutical Industry Volume (K Units) Forecast, by Application 2019 & 2032
- Table 59: Africa Inspection Machine in Pharmaceutical Industry Revenue (Million) Forecast, by Application 2019 & 2032
- Table 60: Africa Inspection Machine in Pharmaceutical Industry Volume (K Units) Forecast, by Application 2019 & 2032
- Table 61: Global Inspection Machine in Pharmaceutical Industry Revenue Million Forecast, by Product 2019 & 2032
- Table 62: Global Inspection Machine in Pharmaceutical Industry Volume K Units Forecast, by Product 2019 & 2032
- Table 63: Global Inspection Machine in Pharmaceutical Industry Revenue Million Forecast, by End User 2019 & 2032
- Table 64: Global Inspection Machine in Pharmaceutical Industry Volume K Units Forecast, by End User 2019 & 2032
- Table 65: Global Inspection Machine in Pharmaceutical Industry Revenue Million Forecast, by Country 2019 & 2032
- Table 66: Global Inspection Machine in Pharmaceutical Industry Volume K Units Forecast, by Country 2019 & 2032
- Table 67: United States Inspection Machine in Pharmaceutical Industry Revenue (Million) Forecast, by Application 2019 & 2032
- Table 68: United States Inspection Machine in Pharmaceutical Industry Volume (K Units) Forecast, by Application 2019 & 2032
- Table 69: Canada Inspection Machine in Pharmaceutical Industry Revenue (Million) Forecast, by Application 2019 & 2032
- Table 70: Canada Inspection Machine in Pharmaceutical Industry Volume (K Units) Forecast, by Application 2019 & 2032
- Table 71: Mexico Inspection Machine in Pharmaceutical Industry Revenue (Million) Forecast, by Application 2019 & 2032
- Table 72: Mexico Inspection Machine in Pharmaceutical Industry Volume (K Units) Forecast, by Application 2019 & 2032
- Table 73: Global Inspection Machine in Pharmaceutical Industry Revenue Million Forecast, by Product 2019 & 2032
- Table 74: Global Inspection Machine in Pharmaceutical Industry Volume K Units Forecast, by Product 2019 & 2032
- Table 75: Global Inspection Machine in Pharmaceutical Industry Revenue Million Forecast, by End User 2019 & 2032
- Table 76: Global Inspection Machine in Pharmaceutical Industry Volume K Units Forecast, by End User 2019 & 2032
- Table 77: Global Inspection Machine in Pharmaceutical Industry Revenue Million Forecast, by Country 2019 & 2032
- Table 78: Global Inspection Machine in Pharmaceutical Industry Volume K Units Forecast, by Country 2019 & 2032
- Table 79: Germany Inspection Machine in Pharmaceutical Industry Revenue (Million) Forecast, by Application 2019 & 2032
- Table 80: Germany Inspection Machine in Pharmaceutical Industry Volume (K Units) Forecast, by Application 2019 & 2032
- Table 81: United Kingdom Inspection Machine in Pharmaceutical Industry Revenue (Million) Forecast, by Application 2019 & 2032
- Table 82: United Kingdom Inspection Machine in Pharmaceutical Industry Volume (K Units) Forecast, by Application 2019 & 2032
- Table 83: France Inspection Machine in Pharmaceutical Industry Revenue (Million) Forecast, by Application 2019 & 2032
- Table 84: France Inspection Machine in Pharmaceutical Industry Volume (K Units) Forecast, by Application 2019 & 2032
- Table 85: Italy Inspection Machine in Pharmaceutical Industry Revenue (Million) Forecast, by Application 2019 & 2032
- Table 86: Italy Inspection Machine in Pharmaceutical Industry Volume (K Units) Forecast, by Application 2019 & 2032
- Table 87: Spain Inspection Machine in Pharmaceutical Industry Revenue (Million) Forecast, by Application 2019 & 2032
- Table 88: Spain Inspection Machine in Pharmaceutical Industry Volume (K Units) Forecast, by Application 2019 & 2032
- Table 89: Rest of Europe Inspection Machine in Pharmaceutical Industry Revenue (Million) Forecast, by Application 2019 & 2032
- Table 90: Rest of Europe Inspection Machine in Pharmaceutical Industry Volume (K Units) Forecast, by Application 2019 & 2032
- Table 91: Global Inspection Machine in Pharmaceutical Industry Revenue Million Forecast, by Product 2019 & 2032
- Table 92: Global Inspection Machine in Pharmaceutical Industry Volume K Units Forecast, by Product 2019 & 2032
- Table 93: Global Inspection Machine in Pharmaceutical Industry Revenue Million Forecast, by End User 2019 & 2032
- Table 94: Global Inspection Machine in Pharmaceutical Industry Volume K Units Forecast, by End User 2019 & 2032
- Table 95: Global Inspection Machine in Pharmaceutical Industry Revenue Million Forecast, by Country 2019 & 2032
- Table 96: Global Inspection Machine in Pharmaceutical Industry Volume K Units Forecast, by Country 2019 & 2032
- Table 97: China Inspection Machine in Pharmaceutical Industry Revenue (Million) Forecast, by Application 2019 & 2032
- Table 98: China Inspection Machine in Pharmaceutical Industry Volume (K Units) Forecast, by Application 2019 & 2032
- Table 99: Japan Inspection Machine in Pharmaceutical Industry Revenue (Million) Forecast, by Application 2019 & 2032
- Table 100: Japan Inspection Machine in Pharmaceutical Industry Volume (K Units) Forecast, by Application 2019 & 2032
- Table 101: India Inspection Machine in Pharmaceutical Industry Revenue (Million) Forecast, by Application 2019 & 2032
- Table 102: India Inspection Machine in Pharmaceutical Industry Volume (K Units) Forecast, by Application 2019 & 2032
- Table 103: Australia Inspection Machine in Pharmaceutical Industry Revenue (Million) Forecast, by Application 2019 & 2032
- Table 104: Australia Inspection Machine in Pharmaceutical Industry Volume (K Units) Forecast, by Application 2019 & 2032
- Table 105: South Korea Inspection Machine in Pharmaceutical Industry Revenue (Million) Forecast, by Application 2019 & 2032
- Table 106: South Korea Inspection Machine in Pharmaceutical Industry Volume (K Units) Forecast, by Application 2019 & 2032
- Table 107: Rest of Asia Pacific Inspection Machine in Pharmaceutical Industry Revenue (Million) Forecast, by Application 2019 & 2032
- Table 108: Rest of Asia Pacific Inspection Machine in Pharmaceutical Industry Volume (K Units) Forecast, by Application 2019 & 2032
- Table 109: Global Inspection Machine in Pharmaceutical Industry Revenue Million Forecast, by Product 2019 & 2032
- Table 110: Global Inspection Machine in Pharmaceutical Industry Volume K Units Forecast, by Product 2019 & 2032
- Table 111: Global Inspection Machine in Pharmaceutical Industry Revenue Million Forecast, by End User 2019 & 2032
- Table 112: Global Inspection Machine in Pharmaceutical Industry Volume K Units Forecast, by End User 2019 & 2032
- Table 113: Global Inspection Machine in Pharmaceutical Industry Revenue Million Forecast, by Country 2019 & 2032
- Table 114: Global Inspection Machine in Pharmaceutical Industry Volume K Units Forecast, by Country 2019 & 2032
- Table 115: GCC Inspection Machine in Pharmaceutical Industry Revenue (Million) Forecast, by Application 2019 & 2032
- Table 116: GCC Inspection Machine in Pharmaceutical Industry Volume (K Units) Forecast, by Application 2019 & 2032
- Table 117: South Africa Inspection Machine in Pharmaceutical Industry Revenue (Million) Forecast, by Application 2019 & 2032
- Table 118: South Africa Inspection Machine in Pharmaceutical Industry Volume (K Units) Forecast, by Application 2019 & 2032
- Table 119: Rest of Middle East and Africa Inspection Machine in Pharmaceutical Industry Revenue (Million) Forecast, by Application 2019 & 2032
- Table 120: Rest of Middle East and Africa Inspection Machine in Pharmaceutical Industry Volume (K Units) Forecast, by Application 2019 & 2032
- Table 121: Global Inspection Machine in Pharmaceutical Industry Revenue Million Forecast, by Product 2019 & 2032
- Table 122: Global Inspection Machine in Pharmaceutical Industry Volume K Units Forecast, by Product 2019 & 2032
- Table 123: Global Inspection Machine in Pharmaceutical Industry Revenue Million Forecast, by End User 2019 & 2032
- Table 124: Global Inspection Machine in Pharmaceutical Industry Volume K Units Forecast, by End User 2019 & 2032
- Table 125: Global Inspection Machine in Pharmaceutical Industry Revenue Million Forecast, by Country 2019 & 2032
- Table 126: Global Inspection Machine in Pharmaceutical Industry Volume K Units Forecast, by Country 2019 & 2032
- Table 127: Brazil Inspection Machine in Pharmaceutical Industry Revenue (Million) Forecast, by Application 2019 & 2032
- Table 128: Brazil Inspection Machine in Pharmaceutical Industry Volume (K Units) Forecast, by Application 2019 & 2032
- Table 129: Argentina Inspection Machine in Pharmaceutical Industry Revenue (Million) Forecast, by Application 2019 & 2032
- Table 130: Argentina Inspection Machine in Pharmaceutical Industry Volume (K Units) Forecast, by Application 2019 & 2032
- Table 131: Rest of South America Inspection Machine in Pharmaceutical Industry Revenue (Million) Forecast, by Application 2019 & 2032
- Table 132: Rest of South America Inspection Machine in Pharmaceutical Industry Volume (K Units) Forecast, by Application 2019 & 2032
Frequently Asked Questions
1. What is the projected Compound Annual Growth Rate (CAGR) of the Inspection Machine in Pharmaceutical Industry?
The projected CAGR is approximately 5.20%.
2. Which companies are prominent players in the Inspection Machine in Pharmaceutical Industry?
Key companies in the market include Mettler-Toledo International Inc, Antares Vision Group, OPTEL GROUP, Cognex Corporation, Brevetti CEA Spa, Omron Corporation, Thermo Fisher Scientific*List Not Exhaustive, ACG, Robert Bosch GmbH, Korber AG, Jekson Vision, Teledyne Technologies.
3. What are the main segments of the Inspection Machine in Pharmaceutical Industry?
The market segments include Product, End User.
4. Can you provide details about the market size?
The market size is estimated to be USD XX Million as of 2022.
5. What are some drivers contributing to market growth?
Increasing Regulatory Compliance With Good Manufacturing Practices; Growing Product Recalls.
6. What are the notable trends driving market growth?
Vision Inspection System Segment is Expected to Hold a Significant Market Share Over the Forecast Period.
7. Are there any restraints impacting market growth?
Growing Demand for Refurbished Equipment.
8. Can you provide examples of recent developments in the market?
In January 2023, Hanmi Pharmaceutical Company signed an agreement with Euclid Medical Products to sell a fully automated drug inspection machine, JVM's Vizen EX, that can inspect up to 400 pills per minute by comparing the quantity, size, and shape of pills with the content of the prescription through a built-in special camera, in the United States.
9. What pricing options are available for accessing the report?
Pricing options include single-user, multi-user, and enterprise licenses priced at USD 4750, USD 5250, and USD 8750 respectively.
10. Is the market size provided in terms of value or volume?
The market size is provided in terms of value, measured in Million and volume, measured in K Units.
11. Are there any specific market keywords associated with the report?
Yes, the market keyword associated with the report is "Inspection Machine in Pharmaceutical Industry," which aids in identifying and referencing the specific market segment covered.
12. How do I determine which pricing option suits my needs best?
The pricing options vary based on user requirements and access needs. Individual users may opt for single-user licenses, while businesses requiring broader access may choose multi-user or enterprise licenses for cost-effective access to the report.
13. Are there any additional resources or data provided in the Inspection Machine in Pharmaceutical Industry report?
While the report offers comprehensive insights, it's advisable to review the specific contents or supplementary materials provided to ascertain if additional resources or data are available.
14. How can I stay updated on further developments or reports in the Inspection Machine in Pharmaceutical Industry?
To stay informed about further developments, trends, and reports in the Inspection Machine in Pharmaceutical Industry, consider subscribing to industry newsletters, following relevant companies and organizations, or regularly checking reputable industry news sources and publications.
Methodology
Step 1 - Identification of Relevant Samples Size from Population Database


Step 2 - Approaches for Defining Global Market Size (Value, Volume* & Price*)

Note*: In applicable scenarios
Step 3 - Data Sources
Primary Research
- Web Analytics
- Survey Reports
- Research Institute
- Latest Research Reports
- Opinion Leaders
Secondary Research
- Annual Reports
- White Paper
- Latest Press Release
- Industry Association
- Paid Database
- Investor Presentations

Step 4 - Data Triangulation
Involves using different sources of information in order to increase the validity of a study
These sources are likely to be stakeholders in a program - participants, other researchers, program staff, other community members, and so on.
Then we put all data in single framework & apply various statistical tools to find out the dynamic on the market.
During the analysis stage, feedback from the stakeholder groups would be compared to determine areas of agreement as well as areas of divergence


