

Key Insights
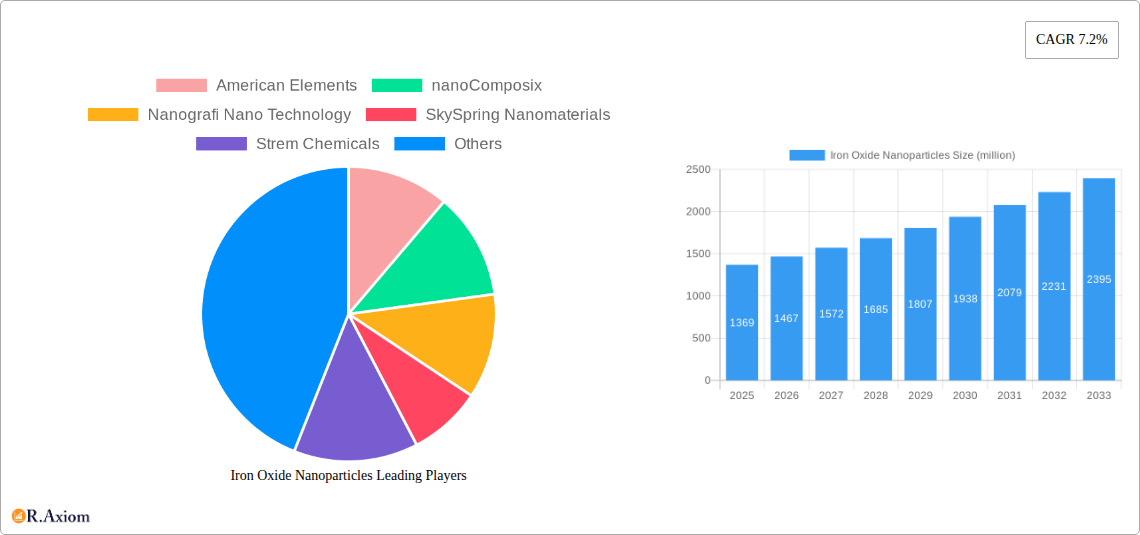
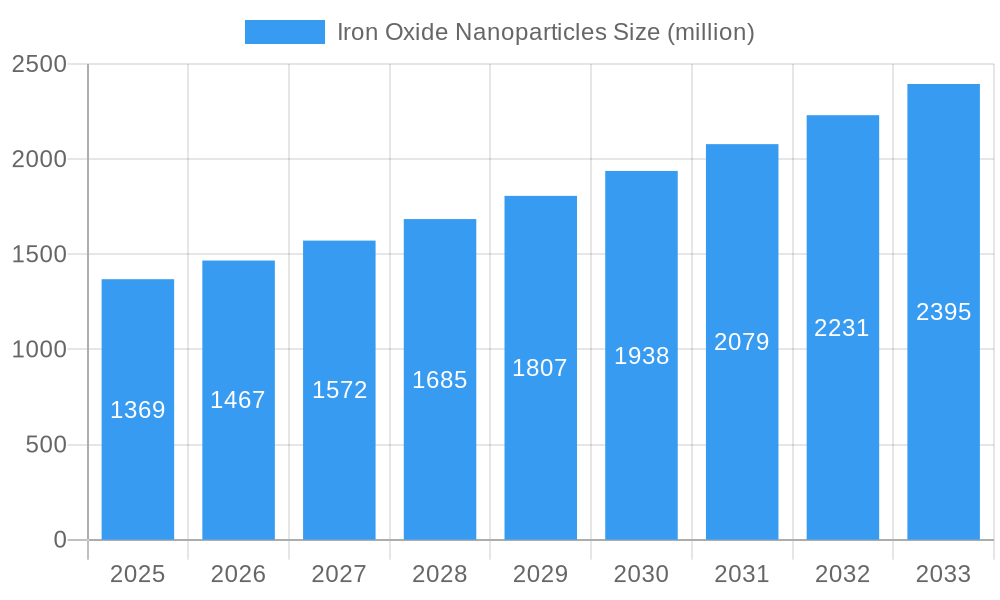
The global Iron Oxide Nanoparticles market is poised for robust expansion, projected to reach an estimated market size of USD 1369 million. This significant growth is underpinned by a healthy Compound Annual Growth Rate (CAGR) of 7.2% expected over the forecast period of 2025-2033. A primary catalyst for this upward trajectory is the burgeoning demand from the healthcare sector, driven by innovative applications in targeted drug delivery, advanced diagnostics, and hyperthermia cancer treatments. The unique magnetic and optical properties of iron oxide nanoparticles make them indispensable for various medical imaging techniques and regenerative medicine. Furthermore, increasing environmental consciousness and the pursuit of sustainable solutions are fueling adoption in water purification, pollution control, and catalytic converters, adding substantial momentum to market growth.
Iron Oxide Nanoparticles Market Size (In Billion)
The market's diversification across various applications, including electronics for data storage and sensors, also contributes to its resilience and expansion. Key trends shaping the landscape include advancements in synthesis techniques leading to improved particle size control, surface functionalization for enhanced biocompatibility and specificity, and the development of novel nanocomposites for specialized industrial uses. While the market enjoys strong drivers, potential restraints such as stringent regulatory frameworks for nanomaterial applications, particularly in healthcare, and the high initial investment costs for advanced manufacturing processes warrant careful consideration. Nevertheless, the continuous innovation and expanding application spectrum are expected to drive market value and penetration across all segments, including Magnetite, Hematite, and Maghemite nanoparticles.
Iron Oxide Nanoparticles Company Market Share
Iron Oxide Nanoparticles Market Concentration & Innovation
The global iron oxide nanoparticles market exhibits moderate to high concentration, with a significant presence of key players like American Elements, nanoComposix, Nanografi Nano Technology, SkySpring Nanomaterials, Strem Chemicals, US Research Nanomaterials, Reade Advanced Materials, Jiangsu Tianyi Ultrafine Metal Powder, Shanghai ST-Nano Science & Technology, and Shanghai Pantian Powder Material. Innovation is a primary driver, fueled by ongoing research in synthesis techniques, surface modifications for targeted applications, and development of novel functionalities. Regulatory frameworks, particularly concerning nanomaterial safety and environmental impact, are evolving and influencing market entry and product development. While direct product substitutes are limited, alternative nanomaterials with similar properties in specific applications can pose competitive pressure. End-user trends are leaning towards high-performance, biocompatible, and environmentally friendly iron oxide nanoparticles. Mergers and acquisitions (M&A) are anticipated to play a role in market consolidation, with potential deal values in the tens to hundreds of million USD as companies seek to expand their portfolios and technological capabilities. The market share of leading players is estimated to be in the range of 5-15% each.
Iron Oxide Nanoparticles Industry Trends & Insights
The iron oxide nanoparticles industry is poised for substantial growth, driven by an ever-increasing demand across diverse sectors. The Compound Annual Growth Rate (CAGR) is projected to be approximately 12.5% from 2025 to 2033, with the market size reaching an estimated USD 4,500 million by the end of the forecast period. This robust expansion is largely attributed to burgeoning applications in healthcare, particularly in targeted drug delivery, magnetic resonance imaging (MRI) contrast agents, and hyperthermia cancer treatments. The environmental sector is also a significant contributor, with iron oxide nanoparticles being utilized in water purification, pollutant remediation, and catalysis. Furthermore, their unique magnetic and optical properties are driving adoption in the electronics industry for data storage, display technologies, and sensors.
Technological disruptions are continuously shaping the landscape. Advancements in synthesis methods, such as co-precipitation, hydrothermal synthesis, and sol-gel methods, are enabling the production of iron oxide nanoparticles with precise control over size, shape, and surface chemistry, thereby enhancing their performance in specific applications. The development of functionalized nanoparticles, coated with specific ligands or polymers, is further expanding their utility and biocompatibility. Consumer preferences are evolving towards safer, more efficient, and sustainable nanomaterial solutions. This trend is pushing manufacturers to focus on eco-friendly production processes and the development of nanoparticles with reduced toxicity.
The competitive dynamics within the iron oxide nanoparticles market are characterized by both intense rivalry among established players and the emergence of innovative start-ups. Companies are differentiating themselves through superior product quality, customized solutions, robust R&D investments, and strategic partnerships. Market penetration is steadily increasing, driven by growing awareness of the benefits offered by iron oxide nanoparticles and the expanding range of commercially viable applications. The development of cost-effective production methods is crucial for wider market adoption, especially in high-volume applications. Continuous innovation in nanoparticle characterization and quality control is also a key factor for building trust and ensuring consistent performance across different batches and applications.
Dominant Markets & Segments in Iron Oxide Nanoparticles
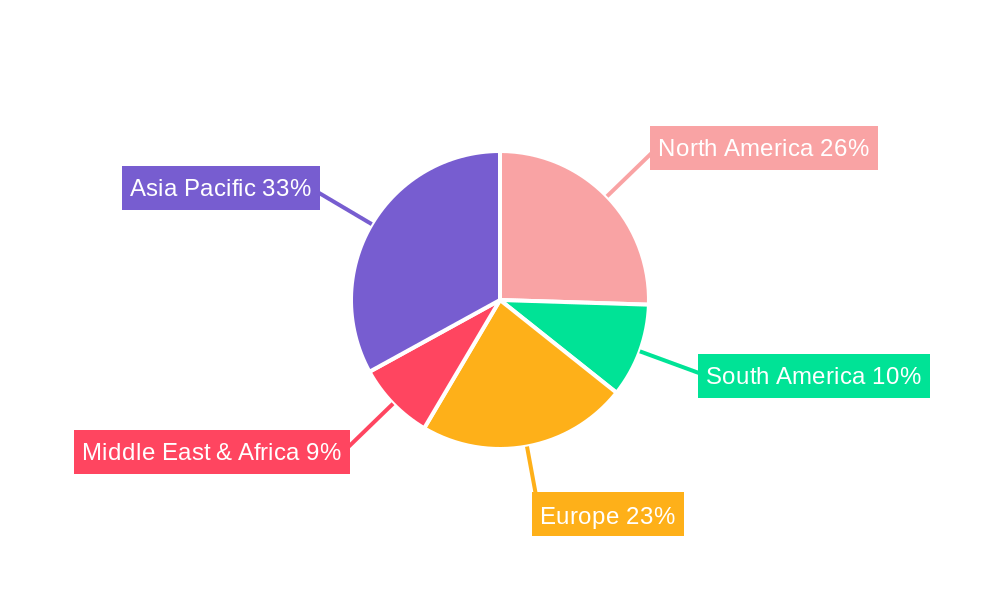
The global iron oxide nanoparticles market is characterized by distinct regional strengths and segment dominance. North America, particularly the United States, is a leading region, driven by strong research and development infrastructure, significant government funding for advanced materials, and a well-established healthcare and electronics industry. Economic policies that encourage innovation and investment in nanotechnology, coupled with substantial investments in infrastructure for advanced manufacturing, further bolster its position.
Application Segment Dominance:
Healthcare: This segment is a primary driver of market growth, projected to account for approximately 35% of the total market share by 2033, valued at over USD 1,500 million.
- Key Drivers: Increasing prevalence of chronic diseases, advancements in diagnostic imaging, growing demand for targeted drug delivery systems, and the potential for non-invasive cancer therapies.
- Dominance Analysis: The biocompatibility and superparamagnetic properties of iron oxide nanoparticles make them ideal for MRI contrast enhancement, hyperthermia treatment, and as carriers for chemotherapy drugs, directly impacting patient outcomes and treatment efficacy. The robust clinical trials and regulatory approvals in this sector further cement its dominance.
Environmental: This segment is experiencing rapid growth, estimated to capture around 25% of the market by 2033, with a market value exceeding USD 1,100 million.
- Key Drivers: Growing environmental concerns, stringent regulations on water and air quality, and the need for cost-effective remediation solutions.
- Dominance Analysis: Iron oxide nanoparticles are highly effective in adsorbing heavy metals, organic pollutants, and other contaminants from water and wastewater. Their magnetic separability simplifies the removal process, making them a preferred choice for environmental cleanup initiatives and industrial effluent treatment.
Electronics: This segment holds a significant share, projected at 20% by 2033, with a market value of approximately USD 900 million.
- Key Drivers: Demand for advanced data storage solutions, high-performance sensors, and innovative display technologies.
- Dominance Analysis: The magnetic properties of iron oxide nanoparticles are crucial for magnetic recording media and magnetic memory devices. Their use in sensors, catalysts for chemical reactions in electronic manufacturing, and as pigments in advanced displays contributes to their market presence.
Others: This segment, encompassing areas like catalysis, coatings, and pigments, is expected to contribute the remaining 20% of the market by 2033, valued at around USD 900 million.
- Key Drivers: Industrial applications in catalysis, specialized coatings for corrosion resistance, and their use as pigments in various materials.
- Dominance Analysis: Their catalytic activity in chemical synthesis and their ability to enhance the durability and aesthetic appeal of coatings drive demand in these diverse industrial applications.
Type Segment Dominance:
Magnetite (Fe₃O₄) Nanoparticles: This type is the most dominant, expected to hold over 40% of the market share by 2033, valued at over USD 1,800 million.
- Key Drivers: Excellent superparamagnetic properties, high magnetic saturation, and biocompatibility, making them ideal for MRI, drug delivery, and magnetic separation.
- Dominance Analysis: Magnetite's inherent magnetic properties are exceptionally well-suited for a broad range of biomedical and industrial applications, leading to its widespread adoption.
Maghemite (γ-Fe₂O₃) Nanoparticles: This type is gaining traction, projected to account for approximately 30% of the market by 2033, with a market value exceeding USD 1,300 million.
- Key Drivers: Enhanced stability compared to magnetite, good biocompatibility, and strong magnetic properties, making them suitable for biomedical imaging and hyperthermia.
- Dominance Analysis: Maghemite offers a balance of magnetic performance and stability, making it a versatile option for advanced applications in healthcare.
Hematite (Fe₂O₃) Nanoparticles: This type holds a substantial share, expected to comprise around 30% of the market by 2033, with a market value of approximately USD 1,300 million.
- Key Drivers: Lower cost of production, good optical properties, and applications in catalysis, pigments, and sensors.
- Dominance Analysis: Hematite's cost-effectiveness and its utility in non-biomedical applications like catalysis and pigments contribute to its significant market presence.
Iron Oxide Nanoparticles Product Developments
Recent product developments in the iron oxide nanoparticles market focus on enhanced biocompatibility, targeted delivery, and improved catalytic efficiency. Companies are innovating with surface functionalization techniques, creating nanoparticles with specific ligands to bind to particular cells or tissues, thereby improving their efficacy in drug delivery and diagnostics. Developments also include the creation of core-shell structures for improved stability and controlled release of therapeutic agents. Furthermore, advancements in synthesis are yielding nanoparticles with tailored magnetic properties for applications in magnetic hyperthermia cancer treatment and advanced data storage. The competitive advantage lies in offering high-purity, well-characterized nanoparticles with reproducible properties, meeting stringent industry standards.
Report Scope & Segmentation Analysis
This report offers a comprehensive analysis of the global iron oxide nanoparticles market, encompassing detailed segmentations by application and type. The Application segments analyzed include Healthcare, which is projected to see robust growth due to advancements in diagnostics and therapeutics, and Environmental, driven by increasing demand for sustainable pollution control solutions. The Electronics segment is poised for steady expansion with the growing need for advanced materials in electronic devices. The Others segment covers diverse industrial applications like catalysis and coatings. The Type segmentation includes Magnetite (Fe₃O₄) Nanoparticles, the dominant type due to its superior magnetic properties for biomedical applications; Hematite (Fe₂O₃) Nanoparticles, valued for its cost-effectiveness and use in catalysis and pigments; and Maghemite (γ-Fe₂O₃) Nanoparticles, favored for its balance of magnetic performance and stability in advanced applications. Market sizes and growth projections for each segment are detailed, alongside analyses of competitive dynamics within these categories.
Key Drivers of Iron Oxide Nanoparticles Growth
The growth of the iron oxide nanoparticles market is propelled by several key factors. Technologically, advancements in synthesis methods enabling precise control over size, shape, and surface chemistry are crucial. Increased R&D in biomedical applications, particularly in cancer therapy and diagnostics, and growing environmental concerns driving demand for efficient remediation technologies are significant economic and regulatory drivers. Government initiatives promoting nanotechnology research and development, coupled with supportive regulatory frameworks for new material applications, further catalyze growth. The inherent versatility of iron oxide nanoparticles, allowing for customization for specific needs, also contributes significantly to their expanding market presence.
Challenges in the Iron Oxide Nanoparticles Sector
Despite its promising growth, the iron oxide nanoparticles sector faces several challenges. Regulatory hurdles related to the safety and long-term environmental impact of nanomaterials can slow down market penetration and product approvals, especially in sensitive applications like healthcare. Supply chain complexities and the cost-effective production of high-purity, uniform nanoparticles at scale remain a concern, impacting affordability for certain high-volume applications. Competitive pressures from alternative nanomaterials and established technologies also exist. Ensuring consistent quality control and addressing potential toxicity concerns through rigorous testing are essential to overcome these barriers and build market confidence, with potential market restriction estimated at 5-10% in specific sub-segments.
Emerging Opportunities in Iron Oxide Nanoparticles
Emerging opportunities in the iron oxide nanoparticles market are diverse and capitalize on ongoing technological advancements and evolving consumer preferences. The development of smart drug delivery systems that respond to external stimuli, such as magnetic fields or pH changes, presents a significant opportunity in healthcare. In the environmental sector, novel applications in CO₂ capture and conversion, and advanced wastewater treatment processes are gaining traction. The growing demand for sustainable and eco-friendly materials offers opportunities for iron oxide nanoparticles in green catalysis and as replacements for hazardous pigments. Furthermore, advancements in additive manufacturing and 3D printing using iron oxide nanoparticles are opening new avenues in specialized material fabrication.
Leading Players in the Iron Oxide Nanoparticles Market
- American Elements
- nanoComposix
- Nanografi Nano Technology
- SkySpring Nanomaterials
- Strem Chemicals
- US Research Nanomaterials
- Reade Advanced Materials
- Jiangsu Tianyi Ultrafine Metal Powder
- Shanghai ST-Nano Science & Technology
- Shanghai Pantian Powder Material
Key Developments in Iron Oxide Nanoparticles Industry
- 2023/10: Launch of a new range of superparamagnetic iron oxide nanoparticles with enhanced surface functionalization for targeted cancer therapy by American Elements, impacting the healthcare segment.
- 2023/08: Nanografi Nano Technology announces a breakthrough in scalable synthesis of uniform magnetite nanoparticles, aiming to reduce production costs by 15-20%.
- 2023/05: nanoComposix partners with a leading pharmaceutical company to develop iron oxide nanoparticle-based contrast agents for advanced MRI imaging, enhancing its footprint in healthcare diagnostics.
- 2022/11: SkySpring Nanomaterials introduces novel hematite nanoparticles with improved catalytic activity for industrial wastewater treatment, boosting its environmental segment offerings.
- 2022/07: Strem Chemicals expands its portfolio of iron oxide nanoparticles with a focus on ultra-high purity grades for demanding electronic applications.
- 2022/03: US Research Nanomaterials develops a cost-effective method for producing maghemite nanoparticles, making them more accessible for a wider range of applications.
- 2021/09: Reade Advanced Materials acquires a smaller competitor, strengthening its market position in specialty iron oxide powders and nanoparticles.
- 2021/04: Jiangsu Tianyi Ultrafine Metal Powder invests in new R&D facilities to explore advanced applications of iron oxide nanoparticles in battery technology.
- 2020/12: Shanghai ST-Nano Science & Technology secures significant funding to scale up production of its proprietary iron oxide nanoparticle formulations for the Chinese market.
- 2020/06: Shanghai Pantian Powder Material launches a new series of magnetic iron oxide nanoparticles for hyperthermia treatments, further solidifying its presence in the biomedical sector.
Strategic Outlook for Iron Oxide Nanoparticles Market
The strategic outlook for the iron oxide nanoparticles market is exceptionally positive, driven by continuous innovation and expanding application frontiers. Future growth catalysts will stem from further advancements in targeted drug delivery systems, non-invasive diagnostics, and highly efficient environmental remediation technologies. The increasing demand for sustainable and high-performance materials in electronics and energy storage also presents significant opportunities. Companies that focus on developing novel functionalities, ensuring product safety and regulatory compliance, and establishing strategic partnerships will be well-positioned to capitalize on the sustained growth trajectory and capture a substantial share of the estimated USD 6,500 million market by 2033.
Iron Oxide Nanoparticles Segmentation
-
1. Application
- 1.1. Healthcare
- 1.2. Environmental
- 1.3. Electronics
- 1.4. Others
-
2. Type
- 2.1. Magnetite (Fe₃O₄) Nanoparticles
- 2.2. Hematite (Fe₂O₃) Nanoparticles
- 2.3. Maghemite (γ-Fe₂O₃) Nanoparticles
Iron Oxide Nanoparticles Segmentation By Geography
-
1. North America
- 1.1. United States
- 1.2. Canada
- 1.3. Mexico
-
2. South America
- 2.1. Brazil
- 2.2. Argentina
- 2.3. Rest of South America
-
3. Europe
- 3.1. United Kingdom
- 3.2. Germany
- 3.3. France
- 3.4. Italy
- 3.5. Spain
- 3.6. Russia
- 3.7. Benelux
- 3.8. Nordics
- 3.9. Rest of Europe
-
4. Middle East & Africa
- 4.1. Turkey
- 4.2. Israel
- 4.3. GCC
- 4.4. North Africa
- 4.5. South Africa
- 4.6. Rest of Middle East & Africa
-
5. Asia Pacific
- 5.1. China
- 5.2. India
- 5.3. Japan
- 5.4. South Korea
- 5.5. ASEAN
- 5.6. Oceania
- 5.7. Rest of Asia Pacific
Iron Oxide Nanoparticles Regional Market Share
Geographic Coverage of Iron Oxide Nanoparticles
Iron Oxide Nanoparticles REPORT HIGHLIGHTS
| Aspects | Details |
|---|---|
| Study Period | 2020-2034 |
| Base Year | 2025 |
| Estimated Year | 2026 |
| Forecast Period | 2026-2034 |
| Historical Period | 2020-2025 |
| Growth Rate | CAGR of 7.2% from 2020-2034 |
| Segmentation |
|
Table of Contents
- 1. Introduction
- 1.1. Research Scope
- 1.2. Market Segmentation
- 1.3. Research Objective
- 1.4. Definitions and Assumptions
- 2. Executive Summary
- 2.1. Market Snapshot
- 3. Market Dynamics
- 3.1. Market Drivers
- 3.2. Market Restrains
- 3.3. Market Trends
- 3.4. Market Opportunities
- 4. Market Factor Analysis
- 4.1. Porters Five Forces
- 4.1.1. Bargaining Power of Suppliers
- 4.1.2. Bargaining Power of Buyers
- 4.1.3. Threat of New Entrants
- 4.1.4. Threat of Substitutes
- 4.1.5. Competitive Rivalry
- 4.2. PESTEL analysis
- 4.3. BCG Analysis
- 4.3.1. Stars (High Growth, High Market Share)
- 4.3.2. Cash Cows (Low Growth, High Market Share)
- 4.3.3. Question Mark (High Growth, Low Market Share)
- 4.3.4. Dogs (Low Growth, Low Market Share)
- 4.4. Ansoff Matrix Analysis
- 4.5. Supply Chain Analysis
- 4.6. Regulatory Landscape
- 4.7. Current Market Potential and Opportunity Assessment (TAM–SAM–SOM Framework)
- 4.8. RAX Analyst Note
- 4.1. Porters Five Forces
- 5. Market Analysis, Insights and Forecast 2021-2033
- 5.1. Market Analysis, Insights and Forecast - by Application
- 5.1.1. Healthcare
- 5.1.2. Environmental
- 5.1.3. Electronics
- 5.1.4. Others
- 5.2. Market Analysis, Insights and Forecast - by Type
- 5.2.1. Magnetite (Fe₃O₄) Nanoparticles
- 5.2.2. Hematite (Fe₂O₃) Nanoparticles
- 5.2.3. Maghemite (γ-Fe₂O₃) Nanoparticles
- 5.3. Market Analysis, Insights and Forecast - by Region
- 5.3.1. North America
- 5.3.2. South America
- 5.3.3. Europe
- 5.3.4. Middle East & Africa
- 5.3.5. Asia Pacific
- 5.1. Market Analysis, Insights and Forecast - by Application
- 6. Global Iron Oxide Nanoparticles Analysis, Insights and Forecast, 2021-2033
- 6.1. Market Analysis, Insights and Forecast - by Application
- 6.1.1. Healthcare
- 6.1.2. Environmental
- 6.1.3. Electronics
- 6.1.4. Others
- 6.2. Market Analysis, Insights and Forecast - by Type
- 6.2.1. Magnetite (Fe₃O₄) Nanoparticles
- 6.2.2. Hematite (Fe₂O₃) Nanoparticles
- 6.2.3. Maghemite (γ-Fe₂O₃) Nanoparticles
- 6.1. Market Analysis, Insights and Forecast - by Application
- 7. North America Iron Oxide Nanoparticles Analysis, Insights and Forecast, 2020-2032
- 7.1. Market Analysis, Insights and Forecast - by Application
- 7.1.1. Healthcare
- 7.1.2. Environmental
- 7.1.3. Electronics
- 7.1.4. Others
- 7.2. Market Analysis, Insights and Forecast - by Type
- 7.2.1. Magnetite (Fe₃O₄) Nanoparticles
- 7.2.2. Hematite (Fe₂O₃) Nanoparticles
- 7.2.3. Maghemite (γ-Fe₂O₃) Nanoparticles
- 7.1. Market Analysis, Insights and Forecast - by Application
- 8. South America Iron Oxide Nanoparticles Analysis, Insights and Forecast, 2020-2032
- 8.1. Market Analysis, Insights and Forecast - by Application
- 8.1.1. Healthcare
- 8.1.2. Environmental
- 8.1.3. Electronics
- 8.1.4. Others
- 8.2. Market Analysis, Insights and Forecast - by Type
- 8.2.1. Magnetite (Fe₃O₄) Nanoparticles
- 8.2.2. Hematite (Fe₂O₃) Nanoparticles
- 8.2.3. Maghemite (γ-Fe₂O₃) Nanoparticles
- 8.1. Market Analysis, Insights and Forecast - by Application
- 9. Europe Iron Oxide Nanoparticles Analysis, Insights and Forecast, 2020-2032
- 9.1. Market Analysis, Insights and Forecast - by Application
- 9.1.1. Healthcare
- 9.1.2. Environmental
- 9.1.3. Electronics
- 9.1.4. Others
- 9.2. Market Analysis, Insights and Forecast - by Type
- 9.2.1. Magnetite (Fe₃O₄) Nanoparticles
- 9.2.2. Hematite (Fe₂O₃) Nanoparticles
- 9.2.3. Maghemite (γ-Fe₂O₃) Nanoparticles
- 9.1. Market Analysis, Insights and Forecast - by Application
- 10. Middle East & Africa Iron Oxide Nanoparticles Analysis, Insights and Forecast, 2020-2032
- 10.1. Market Analysis, Insights and Forecast - by Application
- 10.1.1. Healthcare
- 10.1.2. Environmental
- 10.1.3. Electronics
- 10.1.4. Others
- 10.2. Market Analysis, Insights and Forecast - by Type
- 10.2.1. Magnetite (Fe₃O₄) Nanoparticles
- 10.2.2. Hematite (Fe₂O₃) Nanoparticles
- 10.2.3. Maghemite (γ-Fe₂O₃) Nanoparticles
- 10.1. Market Analysis, Insights and Forecast - by Application
- 11. Asia Pacific Iron Oxide Nanoparticles Analysis, Insights and Forecast, 2020-2032
- 11.1. Market Analysis, Insights and Forecast - by Application
- 11.1.1. Healthcare
- 11.1.2. Environmental
- 11.1.3. Electronics
- 11.1.4. Others
- 11.2. Market Analysis, Insights and Forecast - by Type
- 11.2.1. Magnetite (Fe₃O₄) Nanoparticles
- 11.2.2. Hematite (Fe₂O₃) Nanoparticles
- 11.2.3. Maghemite (γ-Fe₂O₃) Nanoparticles
- 11.1. Market Analysis, Insights and Forecast - by Application
- 12. Competitive Analysis
- 12.1. Company Profiles
- 12.1.1 American Elements
- 12.1.1.1. Company Overview
- 12.1.1.2. Products
- 12.1.1.3. Company Financials
- 12.1.1.4. SWOT Analysis
- 12.1.2 nanoComposix
- 12.1.2.1. Company Overview
- 12.1.2.2. Products
- 12.1.2.3. Company Financials
- 12.1.2.4. SWOT Analysis
- 12.1.3 Nanografi Nano Technology
- 12.1.3.1. Company Overview
- 12.1.3.2. Products
- 12.1.3.3. Company Financials
- 12.1.3.4. SWOT Analysis
- 12.1.4 SkySpring Nanomaterials
- 12.1.4.1. Company Overview
- 12.1.4.2. Products
- 12.1.4.3. Company Financials
- 12.1.4.4. SWOT Analysis
- 12.1.5 Strem Chemicals
- 12.1.5.1. Company Overview
- 12.1.5.2. Products
- 12.1.5.3. Company Financials
- 12.1.5.4. SWOT Analysis
- 12.1.6 US Research Nanomaterials
- 12.1.6.1. Company Overview
- 12.1.6.2. Products
- 12.1.6.3. Company Financials
- 12.1.6.4. SWOT Analysis
- 12.1.7 Reade Advanced Materials
- 12.1.7.1. Company Overview
- 12.1.7.2. Products
- 12.1.7.3. Company Financials
- 12.1.7.4. SWOT Analysis
- 12.1.8 Jiangsu Tianyi Ultrafine Metal Powder
- 12.1.8.1. Company Overview
- 12.1.8.2. Products
- 12.1.8.3. Company Financials
- 12.1.8.4. SWOT Analysis
- 12.1.9 Shanghai ST-Nano Science & Technology
- 12.1.9.1. Company Overview
- 12.1.9.2. Products
- 12.1.9.3. Company Financials
- 12.1.9.4. SWOT Analysis
- 12.1.10 Shanghai Pantian Powder Material
- 12.1.10.1. Company Overview
- 12.1.10.2. Products
- 12.1.10.3. Company Financials
- 12.1.10.4. SWOT Analysis
- 12.1.1 American Elements
- 12.2. Market Entropy
- 12.2.1 Company's Key Areas Served
- 12.2.2 Recent Developments
- 12.3. Company Market Share Analysis 2025
- 12.3.1 Top 5 Companies Market Share Analysis
- 12.3.2 Top 3 Companies Market Share Analysis
- 12.4. List of Potential Customers
- 13. Research Methodology
List of Figures
- Figure 1: Global Iron Oxide Nanoparticles Revenue Breakdown (million, %) by Region 2025 & 2033
- Figure 2: Global Iron Oxide Nanoparticles Volume Breakdown (K, %) by Region 2025 & 2033
- Figure 3: North America Iron Oxide Nanoparticles Revenue (million), by Application 2025 & 2033
- Figure 4: North America Iron Oxide Nanoparticles Volume (K), by Application 2025 & 2033
- Figure 5: North America Iron Oxide Nanoparticles Revenue Share (%), by Application 2025 & 2033
- Figure 6: North America Iron Oxide Nanoparticles Volume Share (%), by Application 2025 & 2033
- Figure 7: North America Iron Oxide Nanoparticles Revenue (million), by Type 2025 & 2033
- Figure 8: North America Iron Oxide Nanoparticles Volume (K), by Type 2025 & 2033
- Figure 9: North America Iron Oxide Nanoparticles Revenue Share (%), by Type 2025 & 2033
- Figure 10: North America Iron Oxide Nanoparticles Volume Share (%), by Type 2025 & 2033
- Figure 11: North America Iron Oxide Nanoparticles Revenue (million), by Country 2025 & 2033
- Figure 12: North America Iron Oxide Nanoparticles Volume (K), by Country 2025 & 2033
- Figure 13: North America Iron Oxide Nanoparticles Revenue Share (%), by Country 2025 & 2033
- Figure 14: North America Iron Oxide Nanoparticles Volume Share (%), by Country 2025 & 2033
- Figure 15: South America Iron Oxide Nanoparticles Revenue (million), by Application 2025 & 2033
- Figure 16: South America Iron Oxide Nanoparticles Volume (K), by Application 2025 & 2033
- Figure 17: South America Iron Oxide Nanoparticles Revenue Share (%), by Application 2025 & 2033
- Figure 18: South America Iron Oxide Nanoparticles Volume Share (%), by Application 2025 & 2033
- Figure 19: South America Iron Oxide Nanoparticles Revenue (million), by Type 2025 & 2033
- Figure 20: South America Iron Oxide Nanoparticles Volume (K), by Type 2025 & 2033
- Figure 21: South America Iron Oxide Nanoparticles Revenue Share (%), by Type 2025 & 2033
- Figure 22: South America Iron Oxide Nanoparticles Volume Share (%), by Type 2025 & 2033
- Figure 23: South America Iron Oxide Nanoparticles Revenue (million), by Country 2025 & 2033
- Figure 24: South America Iron Oxide Nanoparticles Volume (K), by Country 2025 & 2033
- Figure 25: South America Iron Oxide Nanoparticles Revenue Share (%), by Country 2025 & 2033
- Figure 26: South America Iron Oxide Nanoparticles Volume Share (%), by Country 2025 & 2033
- Figure 27: Europe Iron Oxide Nanoparticles Revenue (million), by Application 2025 & 2033
- Figure 28: Europe Iron Oxide Nanoparticles Volume (K), by Application 2025 & 2033
- Figure 29: Europe Iron Oxide Nanoparticles Revenue Share (%), by Application 2025 & 2033
- Figure 30: Europe Iron Oxide Nanoparticles Volume Share (%), by Application 2025 & 2033
- Figure 31: Europe Iron Oxide Nanoparticles Revenue (million), by Type 2025 & 2033
- Figure 32: Europe Iron Oxide Nanoparticles Volume (K), by Type 2025 & 2033
- Figure 33: Europe Iron Oxide Nanoparticles Revenue Share (%), by Type 2025 & 2033
- Figure 34: Europe Iron Oxide Nanoparticles Volume Share (%), by Type 2025 & 2033
- Figure 35: Europe Iron Oxide Nanoparticles Revenue (million), by Country 2025 & 2033
- Figure 36: Europe Iron Oxide Nanoparticles Volume (K), by Country 2025 & 2033
- Figure 37: Europe Iron Oxide Nanoparticles Revenue Share (%), by Country 2025 & 2033
- Figure 38: Europe Iron Oxide Nanoparticles Volume Share (%), by Country 2025 & 2033
- Figure 39: Middle East & Africa Iron Oxide Nanoparticles Revenue (million), by Application 2025 & 2033
- Figure 40: Middle East & Africa Iron Oxide Nanoparticles Volume (K), by Application 2025 & 2033
- Figure 41: Middle East & Africa Iron Oxide Nanoparticles Revenue Share (%), by Application 2025 & 2033
- Figure 42: Middle East & Africa Iron Oxide Nanoparticles Volume Share (%), by Application 2025 & 2033
- Figure 43: Middle East & Africa Iron Oxide Nanoparticles Revenue (million), by Type 2025 & 2033
- Figure 44: Middle East & Africa Iron Oxide Nanoparticles Volume (K), by Type 2025 & 2033
- Figure 45: Middle East & Africa Iron Oxide Nanoparticles Revenue Share (%), by Type 2025 & 2033
- Figure 46: Middle East & Africa Iron Oxide Nanoparticles Volume Share (%), by Type 2025 & 2033
- Figure 47: Middle East & Africa Iron Oxide Nanoparticles Revenue (million), by Country 2025 & 2033
- Figure 48: Middle East & Africa Iron Oxide Nanoparticles Volume (K), by Country 2025 & 2033
- Figure 49: Middle East & Africa Iron Oxide Nanoparticles Revenue Share (%), by Country 2025 & 2033
- Figure 50: Middle East & Africa Iron Oxide Nanoparticles Volume Share (%), by Country 2025 & 2033
- Figure 51: Asia Pacific Iron Oxide Nanoparticles Revenue (million), by Application 2025 & 2033
- Figure 52: Asia Pacific Iron Oxide Nanoparticles Volume (K), by Application 2025 & 2033
- Figure 53: Asia Pacific Iron Oxide Nanoparticles Revenue Share (%), by Application 2025 & 2033
- Figure 54: Asia Pacific Iron Oxide Nanoparticles Volume Share (%), by Application 2025 & 2033
- Figure 55: Asia Pacific Iron Oxide Nanoparticles Revenue (million), by Type 2025 & 2033
- Figure 56: Asia Pacific Iron Oxide Nanoparticles Volume (K), by Type 2025 & 2033
- Figure 57: Asia Pacific Iron Oxide Nanoparticles Revenue Share (%), by Type 2025 & 2033
- Figure 58: Asia Pacific Iron Oxide Nanoparticles Volume Share (%), by Type 2025 & 2033
- Figure 59: Asia Pacific Iron Oxide Nanoparticles Revenue (million), by Country 2025 & 2033
- Figure 60: Asia Pacific Iron Oxide Nanoparticles Volume (K), by Country 2025 & 2033
- Figure 61: Asia Pacific Iron Oxide Nanoparticles Revenue Share (%), by Country 2025 & 2033
- Figure 62: Asia Pacific Iron Oxide Nanoparticles Volume Share (%), by Country 2025 & 2033
List of Tables
- Table 1: Global Iron Oxide Nanoparticles Revenue million Forecast, by Application 2020 & 2033
- Table 2: Global Iron Oxide Nanoparticles Volume K Forecast, by Application 2020 & 2033
- Table 3: Global Iron Oxide Nanoparticles Revenue million Forecast, by Type 2020 & 2033
- Table 4: Global Iron Oxide Nanoparticles Volume K Forecast, by Type 2020 & 2033
- Table 5: Global Iron Oxide Nanoparticles Revenue million Forecast, by Region 2020 & 2033
- Table 6: Global Iron Oxide Nanoparticles Volume K Forecast, by Region 2020 & 2033
- Table 7: Global Iron Oxide Nanoparticles Revenue million Forecast, by Application 2020 & 2033
- Table 8: Global Iron Oxide Nanoparticles Volume K Forecast, by Application 2020 & 2033
- Table 9: Global Iron Oxide Nanoparticles Revenue million Forecast, by Type 2020 & 2033
- Table 10: Global Iron Oxide Nanoparticles Volume K Forecast, by Type 2020 & 2033
- Table 11: Global Iron Oxide Nanoparticles Revenue million Forecast, by Country 2020 & 2033
- Table 12: Global Iron Oxide Nanoparticles Volume K Forecast, by Country 2020 & 2033
- Table 13: United States Iron Oxide Nanoparticles Revenue (million) Forecast, by Application 2020 & 2033
- Table 14: United States Iron Oxide Nanoparticles Volume (K) Forecast, by Application 2020 & 2033
- Table 15: Canada Iron Oxide Nanoparticles Revenue (million) Forecast, by Application 2020 & 2033
- Table 16: Canada Iron Oxide Nanoparticles Volume (K) Forecast, by Application 2020 & 2033
- Table 17: Mexico Iron Oxide Nanoparticles Revenue (million) Forecast, by Application 2020 & 2033
- Table 18: Mexico Iron Oxide Nanoparticles Volume (K) Forecast, by Application 2020 & 2033
- Table 19: Global Iron Oxide Nanoparticles Revenue million Forecast, by Application 2020 & 2033
- Table 20: Global Iron Oxide Nanoparticles Volume K Forecast, by Application 2020 & 2033
- Table 21: Global Iron Oxide Nanoparticles Revenue million Forecast, by Type 2020 & 2033
- Table 22: Global Iron Oxide Nanoparticles Volume K Forecast, by Type 2020 & 2033
- Table 23: Global Iron Oxide Nanoparticles Revenue million Forecast, by Country 2020 & 2033
- Table 24: Global Iron Oxide Nanoparticles Volume K Forecast, by Country 2020 & 2033
- Table 25: Brazil Iron Oxide Nanoparticles Revenue (million) Forecast, by Application 2020 & 2033
- Table 26: Brazil Iron Oxide Nanoparticles Volume (K) Forecast, by Application 2020 & 2033
- Table 27: Argentina Iron Oxide Nanoparticles Revenue (million) Forecast, by Application 2020 & 2033
- Table 28: Argentina Iron Oxide Nanoparticles Volume (K) Forecast, by Application 2020 & 2033
- Table 29: Rest of South America Iron Oxide Nanoparticles Revenue (million) Forecast, by Application 2020 & 2033
- Table 30: Rest of South America Iron Oxide Nanoparticles Volume (K) Forecast, by Application 2020 & 2033
- Table 31: Global Iron Oxide Nanoparticles Revenue million Forecast, by Application 2020 & 2033
- Table 32: Global Iron Oxide Nanoparticles Volume K Forecast, by Application 2020 & 2033
- Table 33: Global Iron Oxide Nanoparticles Revenue million Forecast, by Type 2020 & 2033
- Table 34: Global Iron Oxide Nanoparticles Volume K Forecast, by Type 2020 & 2033
- Table 35: Global Iron Oxide Nanoparticles Revenue million Forecast, by Country 2020 & 2033
- Table 36: Global Iron Oxide Nanoparticles Volume K Forecast, by Country 2020 & 2033
- Table 37: United Kingdom Iron Oxide Nanoparticles Revenue (million) Forecast, by Application 2020 & 2033
- Table 38: United Kingdom Iron Oxide Nanoparticles Volume (K) Forecast, by Application 2020 & 2033
- Table 39: Germany Iron Oxide Nanoparticles Revenue (million) Forecast, by Application 2020 & 2033
- Table 40: Germany Iron Oxide Nanoparticles Volume (K) Forecast, by Application 2020 & 2033
- Table 41: France Iron Oxide Nanoparticles Revenue (million) Forecast, by Application 2020 & 2033
- Table 42: France Iron Oxide Nanoparticles Volume (K) Forecast, by Application 2020 & 2033
- Table 43: Italy Iron Oxide Nanoparticles Revenue (million) Forecast, by Application 2020 & 2033
- Table 44: Italy Iron Oxide Nanoparticles Volume (K) Forecast, by Application 2020 & 2033
- Table 45: Spain Iron Oxide Nanoparticles Revenue (million) Forecast, by Application 2020 & 2033
- Table 46: Spain Iron Oxide Nanoparticles Volume (K) Forecast, by Application 2020 & 2033
- Table 47: Russia Iron Oxide Nanoparticles Revenue (million) Forecast, by Application 2020 & 2033
- Table 48: Russia Iron Oxide Nanoparticles Volume (K) Forecast, by Application 2020 & 2033
- Table 49: Benelux Iron Oxide Nanoparticles Revenue (million) Forecast, by Application 2020 & 2033
- Table 50: Benelux Iron Oxide Nanoparticles Volume (K) Forecast, by Application 2020 & 2033
- Table 51: Nordics Iron Oxide Nanoparticles Revenue (million) Forecast, by Application 2020 & 2033
- Table 52: Nordics Iron Oxide Nanoparticles Volume (K) Forecast, by Application 2020 & 2033
- Table 53: Rest of Europe Iron Oxide Nanoparticles Revenue (million) Forecast, by Application 2020 & 2033
- Table 54: Rest of Europe Iron Oxide Nanoparticles Volume (K) Forecast, by Application 2020 & 2033
- Table 55: Global Iron Oxide Nanoparticles Revenue million Forecast, by Application 2020 & 2033
- Table 56: Global Iron Oxide Nanoparticles Volume K Forecast, by Application 2020 & 2033
- Table 57: Global Iron Oxide Nanoparticles Revenue million Forecast, by Type 2020 & 2033
- Table 58: Global Iron Oxide Nanoparticles Volume K Forecast, by Type 2020 & 2033
- Table 59: Global Iron Oxide Nanoparticles Revenue million Forecast, by Country 2020 & 2033
- Table 60: Global Iron Oxide Nanoparticles Volume K Forecast, by Country 2020 & 2033
- Table 61: Turkey Iron Oxide Nanoparticles Revenue (million) Forecast, by Application 2020 & 2033
- Table 62: Turkey Iron Oxide Nanoparticles Volume (K) Forecast, by Application 2020 & 2033
- Table 63: Israel Iron Oxide Nanoparticles Revenue (million) Forecast, by Application 2020 & 2033
- Table 64: Israel Iron Oxide Nanoparticles Volume (K) Forecast, by Application 2020 & 2033
- Table 65: GCC Iron Oxide Nanoparticles Revenue (million) Forecast, by Application 2020 & 2033
- Table 66: GCC Iron Oxide Nanoparticles Volume (K) Forecast, by Application 2020 & 2033
- Table 67: North Africa Iron Oxide Nanoparticles Revenue (million) Forecast, by Application 2020 & 2033
- Table 68: North Africa Iron Oxide Nanoparticles Volume (K) Forecast, by Application 2020 & 2033
- Table 69: South Africa Iron Oxide Nanoparticles Revenue (million) Forecast, by Application 2020 & 2033
- Table 70: South Africa Iron Oxide Nanoparticles Volume (K) Forecast, by Application 2020 & 2033
- Table 71: Rest of Middle East & Africa Iron Oxide Nanoparticles Revenue (million) Forecast, by Application 2020 & 2033
- Table 72: Rest of Middle East & Africa Iron Oxide Nanoparticles Volume (K) Forecast, by Application 2020 & 2033
- Table 73: Global Iron Oxide Nanoparticles Revenue million Forecast, by Application 2020 & 2033
- Table 74: Global Iron Oxide Nanoparticles Volume K Forecast, by Application 2020 & 2033
- Table 75: Global Iron Oxide Nanoparticles Revenue million Forecast, by Type 2020 & 2033
- Table 76: Global Iron Oxide Nanoparticles Volume K Forecast, by Type 2020 & 2033
- Table 77: Global Iron Oxide Nanoparticles Revenue million Forecast, by Country 2020 & 2033
- Table 78: Global Iron Oxide Nanoparticles Volume K Forecast, by Country 2020 & 2033
- Table 79: China Iron Oxide Nanoparticles Revenue (million) Forecast, by Application 2020 & 2033
- Table 80: China Iron Oxide Nanoparticles Volume (K) Forecast, by Application 2020 & 2033
- Table 81: India Iron Oxide Nanoparticles Revenue (million) Forecast, by Application 2020 & 2033
- Table 82: India Iron Oxide Nanoparticles Volume (K) Forecast, by Application 2020 & 2033
- Table 83: Japan Iron Oxide Nanoparticles Revenue (million) Forecast, by Application 2020 & 2033
- Table 84: Japan Iron Oxide Nanoparticles Volume (K) Forecast, by Application 2020 & 2033
- Table 85: South Korea Iron Oxide Nanoparticles Revenue (million) Forecast, by Application 2020 & 2033
- Table 86: South Korea Iron Oxide Nanoparticles Volume (K) Forecast, by Application 2020 & 2033
- Table 87: ASEAN Iron Oxide Nanoparticles Revenue (million) Forecast, by Application 2020 & 2033
- Table 88: ASEAN Iron Oxide Nanoparticles Volume (K) Forecast, by Application 2020 & 2033
- Table 89: Oceania Iron Oxide Nanoparticles Revenue (million) Forecast, by Application 2020 & 2033
- Table 90: Oceania Iron Oxide Nanoparticles Volume (K) Forecast, by Application 2020 & 2033
- Table 91: Rest of Asia Pacific Iron Oxide Nanoparticles Revenue (million) Forecast, by Application 2020 & 2033
- Table 92: Rest of Asia Pacific Iron Oxide Nanoparticles Volume (K) Forecast, by Application 2020 & 2033
Frequently Asked Questions
1. What is the projected Compound Annual Growth Rate (CAGR) of the Iron Oxide Nanoparticles?
The projected CAGR is approximately 7.2%.
2. Which companies are prominent players in the Iron Oxide Nanoparticles?
Key companies in the market include American Elements, nanoComposix, Nanografi Nano Technology, SkySpring Nanomaterials, Strem Chemicals, US Research Nanomaterials, Reade Advanced Materials, Jiangsu Tianyi Ultrafine Metal Powder, Shanghai ST-Nano Science & Technology, Shanghai Pantian Powder Material.
3. What are the main segments of the Iron Oxide Nanoparticles?
The market segments include Application, Type.
4. Can you provide details about the market size?
The market size is estimated to be USD 1369 million as of 2022.
5. What are some drivers contributing to market growth?
N/A
6. What are the notable trends driving market growth?
N/A
7. Are there any restraints impacting market growth?
N/A
8. Can you provide examples of recent developments in the market?
N/A
9. What pricing options are available for accessing the report?
Pricing options include single-user, multi-user, and enterprise licenses priced at USD 3950.00, USD 5925.00, and USD 7900.00 respectively.
10. Is the market size provided in terms of value or volume?
The market size is provided in terms of value, measured in million and volume, measured in K.
11. Are there any specific market keywords associated with the report?
Yes, the market keyword associated with the report is "Iron Oxide Nanoparticles," which aids in identifying and referencing the specific market segment covered.
12. How do I determine which pricing option suits my needs best?
The pricing options vary based on user requirements and access needs. Individual users may opt for single-user licenses, while businesses requiring broader access may choose multi-user or enterprise licenses for cost-effective access to the report.
13. Are there any additional resources or data provided in the Iron Oxide Nanoparticles report?
While the report offers comprehensive insights, it's advisable to review the specific contents or supplementary materials provided to ascertain if additional resources or data are available.
14. How can I stay updated on further developments or reports in the Iron Oxide Nanoparticles?
To stay informed about further developments, trends, and reports in the Iron Oxide Nanoparticles, consider subscribing to industry newsletters, following relevant companies and organizations, or regularly checking reputable industry news sources and publications.
Methodology
Step 1 - Identification of Relevant Samples Size from Population Database


Step 2 - Approaches for Defining Global Market Size (Value, Volume* & Price*)

Note*: In applicable scenarios
Step 3 - Data Sources
Primary Research
- Web Analytics
- Survey Reports
- Research Institute
- Latest Research Reports
- Opinion Leaders
Secondary Research
- Annual Reports
- White Paper
- Latest Press Release
- Industry Association
- Paid Database
- Investor Presentations

Step 4 - Data Triangulation
Involves using different sources of information in order to increase the validity of a study
These sources are likely to be stakeholders in a program - participants, other researchers, program staff, other community members, and so on.
Then we put all data in single framework & apply various statistical tools to find out the dynamic on the market.
During the analysis stage, feedback from the stakeholder groups would be compared to determine areas of agreement as well as areas of divergence