

Key Insights
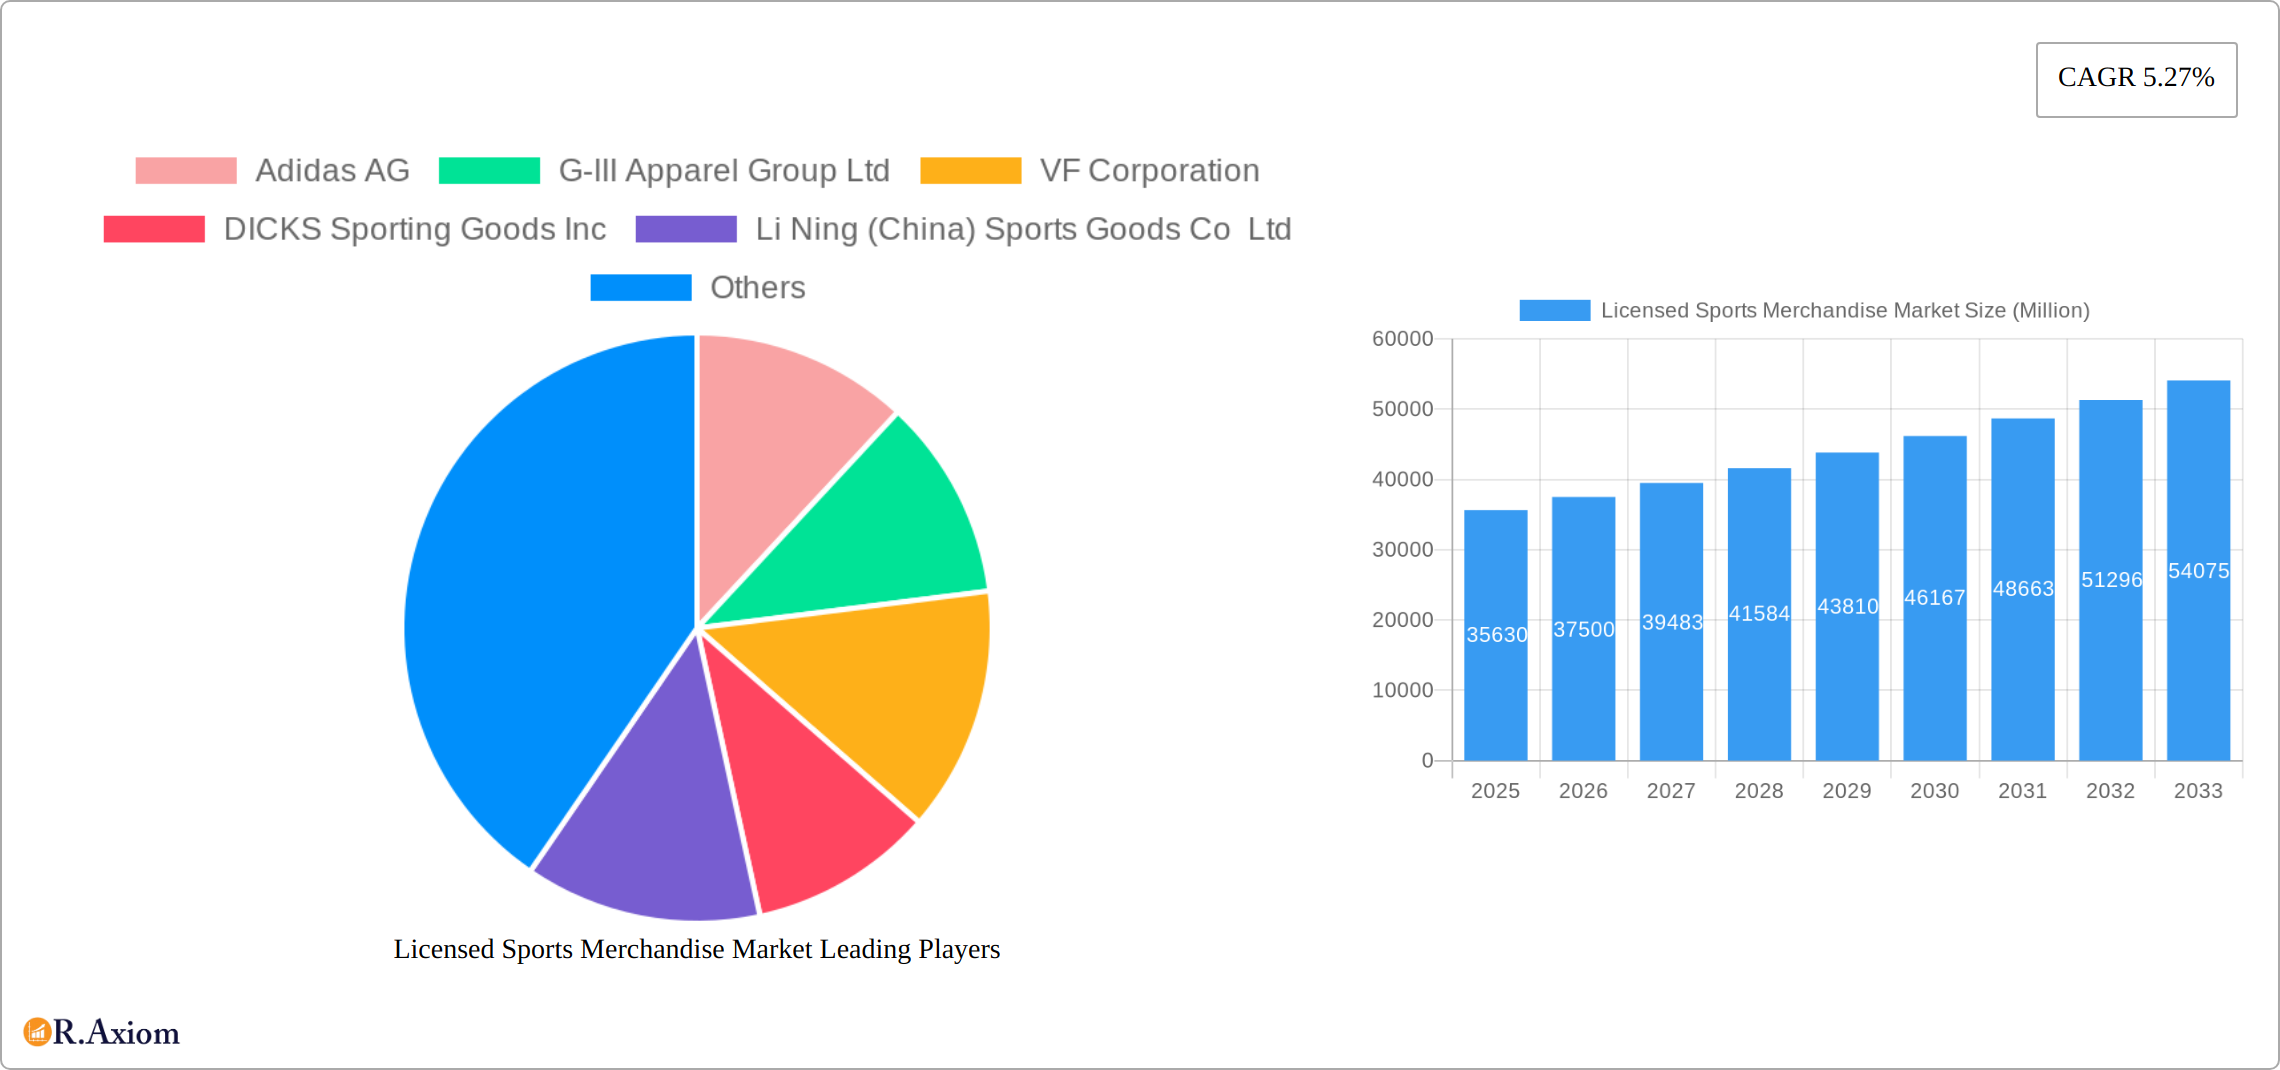
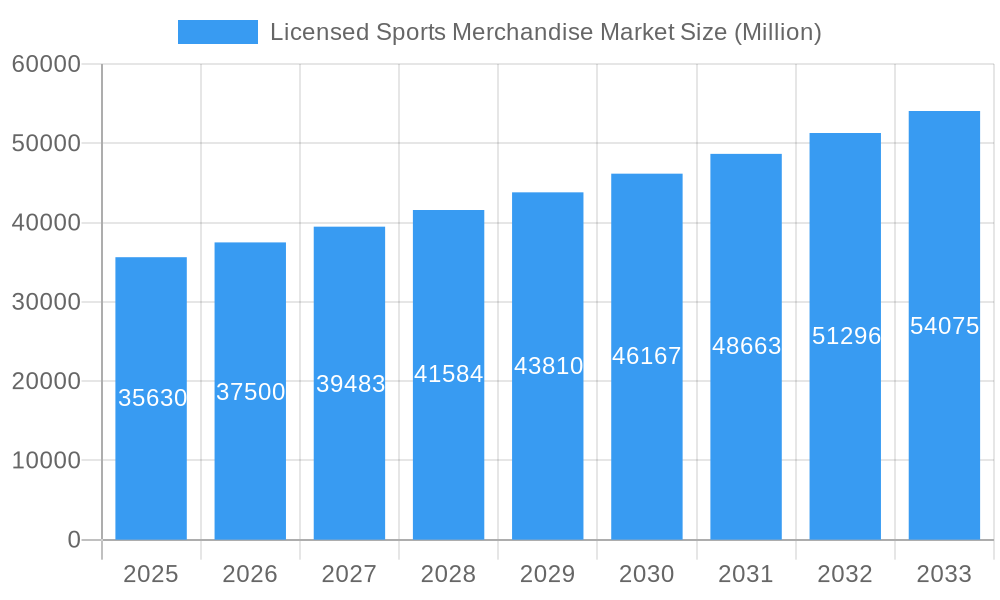
The Licensed Sports Merchandise Market, valued at $35.63 billion in 2025, is projected to experience robust growth, exhibiting a Compound Annual Growth Rate (CAGR) of 5.27% from 2025 to 2033. This expansion is driven by several key factors. Firstly, the enduring popularity of major sporting events, leagues, and teams fuels consistent demand for associated merchandise. Secondly, the rise of e-commerce platforms and omnichannel retail strategies provides wider access to licensed products, expanding market reach and boosting sales. The increasing influence of social media and celebrity endorsements further amplifies brand visibility and product desirability, contributing to market growth. Segmentation analysis reveals that apparel and footwear consistently dominate the product type segment, reflecting consumers' preference for wearable merchandise showcasing team affiliations. Online retail stores are witnessing faster growth compared to offline channels, indicating a shift in consumer purchasing behavior towards convenience and digital accessibility. Geographic variations exist; North America and Europe currently hold significant market share due to strong sporting cultures and high disposable incomes, while the Asia-Pacific region demonstrates promising growth potential driven by rising middle-class affluence and increasing participation in sports. Competitive landscape analysis reveals the presence of established giants like Nike, Adidas, and Under Armour, along with other key players vying for market share through innovation, strategic partnerships, and expanding product lines.
Licensed Sports Merchandise Market Market Size (In Billion)
Despite positive growth projections, the market faces certain challenges. Fluctuations in consumer spending due to economic uncertainties or changing sporting event schedules can impact sales. Counterfeit merchandise continues to be a significant threat, undermining brand authenticity and eroding legitimate revenue streams. Moreover, maintaining brand relevance and appealing to evolving consumer preferences requires ongoing investment in innovative products, marketing campaigns, and sustainable practices. Future market success hinges on navigating these challenges and effectively capitalizing on emerging opportunities, particularly within the burgeoning digital landscape and expanding global sporting events. The strategic integration of technology, data analytics, and effective brand storytelling will play crucial roles in shaping the future trajectory of this dynamic market.
Licensed Sports Merchandise Market Company Market Share
Licensed Sports Merchandise Market: A Comprehensive Report (2019-2033)
This detailed report provides a comprehensive analysis of the Licensed Sports Merchandise Market, covering the period 2019-2033. It delves into market dynamics, competitive landscapes, and future growth projections, offering actionable insights for industry stakeholders. The report leverages extensive data analysis and incorporates key industry developments to present a robust and reliable forecast. With a base year of 2025 and an estimated year of 2025, this report offers a thorough understanding of the past, present, and future of the licensed sports merchandise market, segmented by product type and distribution channel.
Licensed Sports Merchandise Market Concentration & Innovation
This section analyzes the competitive landscape of the licensed sports merchandise market, encompassing market concentration, innovation drivers, regulatory influences, product substitution, end-user trends, and mergers & acquisitions (M&A) activities. The global market is characterized by a moderately concentrated structure, with key players such as Nike Inc., Adidas AG, Puma SE, and Under Armour Inc. holding significant market share. However, the presence of numerous smaller players and emerging brands signifies a dynamic and competitive environment.
Market Share: Nike and Adidas together command an estimated xx% of the global market share in 2025, followed by Under Armour and Puma with xx% and xx%, respectively. The remaining market share is distributed among various other players, including smaller licensed brands and regional players. The exact figures are detailed within the full report.
Innovation Drivers: Technological advancements in apparel materials, manufacturing processes, and personalized customization are driving innovation. The increasing adoption of e-commerce and digital marketing strategies is also a key innovation driver.
Regulatory Frameworks: Compliance with regulations related to product safety, intellectual property rights, and fair trade practices influence market dynamics. Changes in these regulations can significantly impact the market.
Product Substitutes: The market faces competition from alternative products such as generic sportswear and non-licensed merchandise, affecting the market share of licensed products. The report quantifies this competitive pressure.
End-User Trends: Growing consumer preference for sustainable and ethically sourced products, personalized merchandise, and team-specific merchandise is shaping market demands.
M&A Activities: The industry has witnessed several significant M&A activities in recent years, with deal values reaching xx Million. These transactions have led to market consolidation and expanded market reach for major players. Specific deals and their impacts are analyzed in detail in the report.
Licensed Sports Merchandise Market Industry Trends & Insights
The Licensed Sports Merchandise Market is poised for significant growth, projected to achieve a Compound Annual Growth Rate (CAGR) of xx% during the forecast period (2025-2033). This robust expansion is driven by a confluence of factors. The global surge in sports popularity, coupled with rising disposable incomes in developing economies, creates a fertile ground for increased consumer spending. Furthermore, the pervasive influence of social media and celebrity endorsements significantly impacts purchasing decisions, boosting demand for licensed sports merchandise.
Technological advancements are revolutionizing the industry across the value chain. From design and material sourcing to production and distribution, innovation is paramount. 3D printing and additive manufacturing facilitate personalized product customization, enhancing consumer engagement. E-commerce platforms and omni-channel distribution strategies provide unparalleled accessibility and convenience. Simultaneously, the growing consumer awareness of sustainability and ethical sourcing is reshaping market dynamics. Consumers increasingly favor brands committed to environmental and social responsibility, driving demand for ethically produced and eco-friendly merchandise. This necessitates the adoption of sustainable manufacturing practices and responsible sourcing throughout the supply chain. The competitive landscape is fiercely contested, characterized by intense competition among established players, the emergence of new brands, and the continuous need for innovation to maintain a competitive edge.
Dominant Markets & Segments in Licensed Sports Merchandise Market
This section identifies the leading regions, countries, and segments within the Licensed Sports Merchandise Market. North America and Europe currently hold the largest market share, driven by high sports participation rates, strong consumer spending power, and established licensing infrastructure. However, the Asia-Pacific region is projected to exhibit the highest growth rate during the forecast period, fueled by rapid economic growth, rising middle-class disposable incomes, and the growing popularity of various sports.
Dominant Product Type: Apparel holds the largest market share amongst product types, followed by Footwear. The ‘Other Product Types’ segment (e.g., accessories, equipment) also accounts for a significant market portion.
Dominant Distribution Channel: Offline Retail Stores are currently the dominant distribution channel, but Online Retail Stores are experiencing the fastest growth rate and are expected to close the gap significantly in the coming years.
Key Drivers (By Region):
North America: Strong consumer spending power, high sports participation rates, and well-established licensing frameworks.
Europe: Similar to North America, with the addition of strong governmental support for sports development in certain countries.
Asia-Pacific: Rapid economic growth, rising middle class, increasing disposable incomes, and growing popularity of various sports.
Licensed Sports Merchandise Market Product Developments
Recent product innovations focus on enhanced performance features, sustainable materials, personalized designs, and technological integration (e.g., wearable tech integration in apparel). Companies are leveraging advanced materials such as recycled fabrics and breathable textiles to cater to the growing demand for sustainable products. The integration of technology, including sensors and connectivity features, is creating new product applications and expanding the market beyond traditional apparel and footwear. This market evolution signifies the importance of aligning products with modern technological and sustainable trends.
Report Scope & Segmentation Analysis
This report segments the Licensed Sports Merchandise Market based on Product Type (Apparel, Footwear, Toys and Games, Other Product Types) and Distribution Channel (Offline Retail Stores, Online Retail Stores). Each segment's growth projections, market sizes, and competitive dynamics are comprehensively analyzed. The Apparel segment is projected to maintain its leading position due to high demand, whereas the Online Retail Stores segment is expected to witness rapid growth driven by evolving consumer preferences. The report provides granular details on each segment and its expected trajectory through 2033.
Key Drivers of Licensed Sports Merchandise Market Growth
The growth of the Licensed Sports Merchandise Market is primarily driven by increasing sports participation, rising disposable incomes, the growing popularity of e-commerce, and the influence of celebrity endorsements. The expansion of international sporting events and leagues significantly contributes to the market's growth, boosting demand for licensed merchandise associated with these events. Furthermore, the adoption of digital marketing and social media campaigns enhances brand visibility and increases consumer engagement, driving sales. Governmental support for sports development and related infrastructure in various regions also contribute to the overall market growth.
Challenges in the Licensed Sports Merchandise Market Sector
The Licensed Sports Merchandise Market faces challenges such as counterfeiting and intellectual property rights infringement. These activities significantly impact the revenue of legitimate brands and hamper market growth. Supply chain disruptions, particularly those related to raw material sourcing and manufacturing, present another major challenge. Fluctuating raw material prices and geopolitical instability can lead to cost increases and production delays. Finally, intense competition among established brands and the increasing entry of new players create a highly competitive environment, necessitating continuous innovation and efficient marketing strategies to maintain market share.
Emerging Opportunities in Licensed Sports Merchandise Market
The Licensed Sports Merchandise Market presents several compelling emerging opportunities. The explosive growth of esports and virtual sports creates new avenues for licensed merchandise associated with virtual athletes and teams. The ability to offer personalized customization, fueled by advancements in 3D printing and digital design tools, provides opportunities for enhanced customer engagement and product differentiation. The increasing consumer demand for sustainable and ethically sourced products presents a significant opportunity for brands to adopt eco-friendly materials and manufacturing processes, aligning with the growing environmental consciousness. Finally, expanding into new geographical markets, particularly in developing economies with high growth potential, offers substantial market expansion opportunities.
Leading Players in the Licensed Sports Merchandise Market Market
- Adidas AG
- G-III Apparel Group Ltd
- VF Corporation
- DICKS Sporting Goods Inc
- Li Ning (China) Sports Goods Co Ltd
- Iconix Brand Group
- Puma SE
- Under Armour Inc
- Nike Inc
- ASICS Corporation
Key Developments in Licensed Sports Merchandise Market Industry
September 2023: Adidas capitalized on Messi's World Cup victory with the launch of the X Crazyfast Messi 'Las Estrellas' and 'Infinito' boots, leveraging a global superstar's popularity to drive sales.
June 2023: Adidas launched a new Team India cricket jersey for all three formats, strategically utilizing the popularity of player Rohit Sharma to target a key cricketing market and boost sales.
May 2023: PUMA secured a significant deal with Formula 1, becoming the official licensing partner and gaining substantial brand visibility within a vast global audience.
November 2022: The Saudi Arabian Football Federation's switch from Nike to Adidas as its kit supplier represents a noteworthy shift in market share for Adidas.
March 2022: Puma's extended partnership with the W Series reinforces its commitment to women's motorsports and the associated merchandise market.
Strategic Outlook for Licensed Sports Merchandise Market Market
The Licensed Sports Merchandise Market is poised for continued growth, driven by the factors outlined above. The increasing adoption of digital technologies, personalized product offerings, and sustainability initiatives will shape the future of the market. The integration of technology within merchandise and the expansion into new sporting disciplines will further contribute to market expansion. Brands that can effectively leverage technological advancements, embrace sustainability, and personalize their offerings will be best positioned for success in the years to come.
Licensed Sports Merchandise Market Segmentation
-
1. Product Type
- 1.1. Apparel
- 1.2. Footwear
- 1.3. Toys and Games
- 1.4. Other Product Types
-
2. Distribution Channel
- 2.1. Offline Retail Stores
- 2.2. Online Retail Stores
Licensed Sports Merchandise Market Segmentation By Geography
-
1. North America
- 1.1. United States
- 1.2. Canada
- 1.3. Mexico
- 1.4. Rest of North America
-
2. Europe
- 2.1. Spain
- 2.2. United Kingdom
- 2.3. Germany
- 2.4. France
- 2.5. Italy
- 2.6. Russia
- 2.7. Rest of Europe
-
3. Asia Pacific
- 3.1. China
- 3.2. Japan
- 3.3. India
- 3.4. Australia
- 3.5. Rest of Asia Pacific
-
4. South America
- 4.1. Brazil
- 4.2. Argentina
- 4.3. Rest of South America
-
5. Middle East and Africa
- 5.1. South Africa
- 5.2. Saudi Arabia
- 5.3. Rest of Middle East and Africa
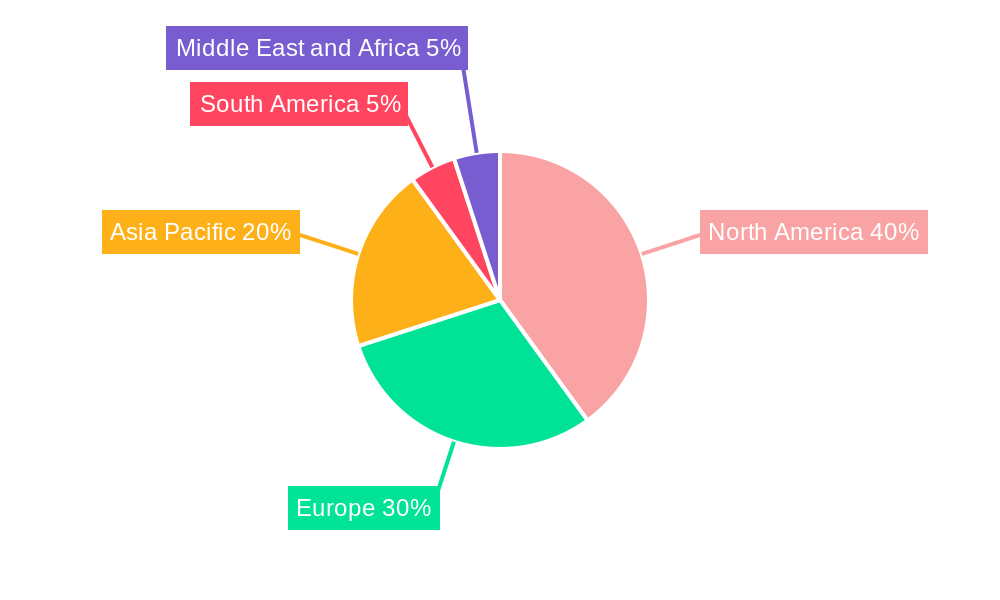
Licensed Sports Merchandise Market Regional Market Share
Geographic Coverage of Licensed Sports Merchandise Market
Licensed Sports Merchandise Market REPORT HIGHLIGHTS
| Aspects | Details |
|---|---|
| Study Period | 2020-2034 |
| Base Year | 2025 |
| Estimated Year | 2026 |
| Forecast Period | 2026-2034 |
| Historical Period | 2020-2025 |
| Growth Rate | CAGR of 5.27% from 2020-2034 |
| Segmentation |
|
Table of Contents
- 1. Introduction
- 1.1. Research Scope
- 1.2. Market Segmentation
- 1.3. Research Objective
- 1.4. Definitions and Assumptions
- 2. Executive Summary
- 2.1. Market Snapshot
- 3. Market Dynamics
- 3.1. Market Drivers
- 3.2. Market Restrains
- 3.3. Market Trends
- 3.4. Market Opportunities
- 4. Market Factor Analysis
- 4.1. Porters Five Forces
- 4.1.1. Bargaining Power of Suppliers
- 4.1.2. Bargaining Power of Buyers
- 4.1.3. Threat of New Entrants
- 4.1.4. Threat of Substitutes
- 4.1.5. Competitive Rivalry
- 4.2. PESTEL analysis
- 4.3. BCG Analysis
- 4.3.1. Stars (High Growth, High Market Share)
- 4.3.2. Cash Cows (Low Growth, High Market Share)
- 4.3.3. Question Mark (High Growth, Low Market Share)
- 4.3.4. Dogs (Low Growth, Low Market Share)
- 4.4. Ansoff Matrix Analysis
- 4.5. Supply Chain Analysis
- 4.6. Regulatory Landscape
- 4.7. Current Market Potential and Opportunity Assessment (TAM–SAM–SOM Framework)
- 4.8. RAX Analyst Note
- 4.1. Porters Five Forces
- 5. Market Analysis, Insights and Forecast 2021-2033
- 5.1. Market Analysis, Insights and Forecast - by Product Type
- 5.1.1. Apparel
- 5.1.2. Footwear
- 5.1.3. Toys and Games
- 5.1.4. Other Product Types
- 5.2. Market Analysis, Insights and Forecast - by Distribution Channel
- 5.2.1. Offline Retail Stores
- 5.2.2. Online Retail Stores
- 5.3. Market Analysis, Insights and Forecast - by Region
- 5.3.1. North America
- 5.3.2. Europe
- 5.3.3. Asia Pacific
- 5.3.4. South America
- 5.3.5. Middle East and Africa
- 5.1. Market Analysis, Insights and Forecast - by Product Type
- 6. Global Licensed Sports Merchandise Market Analysis, Insights and Forecast, 2021-2033
- 6.1. Market Analysis, Insights and Forecast - by Product Type
- 6.1.1. Apparel
- 6.1.2. Footwear
- 6.1.3. Toys and Games
- 6.1.4. Other Product Types
- 6.2. Market Analysis, Insights and Forecast - by Distribution Channel
- 6.2.1. Offline Retail Stores
- 6.2.2. Online Retail Stores
- 6.1. Market Analysis, Insights and Forecast - by Product Type
- 7. North America Licensed Sports Merchandise Market Analysis, Insights and Forecast, 2020-2032
- 7.1. Market Analysis, Insights and Forecast - by Product Type
- 7.1.1. Apparel
- 7.1.2. Footwear
- 7.1.3. Toys and Games
- 7.1.4. Other Product Types
- 7.2. Market Analysis, Insights and Forecast - by Distribution Channel
- 7.2.1. Offline Retail Stores
- 7.2.2. Online Retail Stores
- 7.1. Market Analysis, Insights and Forecast - by Product Type
- 8. Europe Licensed Sports Merchandise Market Analysis, Insights and Forecast, 2020-2032
- 8.1. Market Analysis, Insights and Forecast - by Product Type
- 8.1.1. Apparel
- 8.1.2. Footwear
- 8.1.3. Toys and Games
- 8.1.4. Other Product Types
- 8.2. Market Analysis, Insights and Forecast - by Distribution Channel
- 8.2.1. Offline Retail Stores
- 8.2.2. Online Retail Stores
- 8.1. Market Analysis, Insights and Forecast - by Product Type
- 9. Asia Pacific Licensed Sports Merchandise Market Analysis, Insights and Forecast, 2020-2032
- 9.1. Market Analysis, Insights and Forecast - by Product Type
- 9.1.1. Apparel
- 9.1.2. Footwear
- 9.1.3. Toys and Games
- 9.1.4. Other Product Types
- 9.2. Market Analysis, Insights and Forecast - by Distribution Channel
- 9.2.1. Offline Retail Stores
- 9.2.2. Online Retail Stores
- 9.1. Market Analysis, Insights and Forecast - by Product Type
- 10. South America Licensed Sports Merchandise Market Analysis, Insights and Forecast, 2020-2032
- 10.1. Market Analysis, Insights and Forecast - by Product Type
- 10.1.1. Apparel
- 10.1.2. Footwear
- 10.1.3. Toys and Games
- 10.1.4. Other Product Types
- 10.2. Market Analysis, Insights and Forecast - by Distribution Channel
- 10.2.1. Offline Retail Stores
- 10.2.2. Online Retail Stores
- 10.1. Market Analysis, Insights and Forecast - by Product Type
- 11. Middle East and Africa Licensed Sports Merchandise Market Analysis, Insights and Forecast, 2020-2032
- 11.1. Market Analysis, Insights and Forecast - by Product Type
- 11.1.1. Apparel
- 11.1.2. Footwear
- 11.1.3. Toys and Games
- 11.1.4. Other Product Types
- 11.2. Market Analysis, Insights and Forecast - by Distribution Channel
- 11.2.1. Offline Retail Stores
- 11.2.2. Online Retail Stores
- 11.1. Market Analysis, Insights and Forecast - by Product Type
- 12. Competitive Analysis
- 12.1. Company Profiles
- 12.1.1 Adidas AG
- 12.1.1.1. Company Overview
- 12.1.1.2. Products
- 12.1.1.3. Company Financials
- 12.1.1.4. SWOT Analysis
- 12.1.2 G-III Apparel Group Ltd
- 12.1.2.1. Company Overview
- 12.1.2.2. Products
- 12.1.2.3. Company Financials
- 12.1.2.4. SWOT Analysis
- 12.1.3 VF Corporation
- 12.1.3.1. Company Overview
- 12.1.3.2. Products
- 12.1.3.3. Company Financials
- 12.1.3.4. SWOT Analysis
- 12.1.4 DICKS Sporting Goods Inc
- 12.1.4.1. Company Overview
- 12.1.4.2. Products
- 12.1.4.3. Company Financials
- 12.1.4.4. SWOT Analysis
- 12.1.5 Li Ning (China) Sports Goods Co Ltd
- 12.1.5.1. Company Overview
- 12.1.5.2. Products
- 12.1.5.3. Company Financials
- 12.1.5.4. SWOT Analysis
- 12.1.6 Iconix Brand Group
- 12.1.6.1. Company Overview
- 12.1.6.2. Products
- 12.1.6.3. Company Financials
- 12.1.6.4. SWOT Analysis
- 12.1.7 Puma SE
- 12.1.7.1. Company Overview
- 12.1.7.2. Products
- 12.1.7.3. Company Financials
- 12.1.7.4. SWOT Analysis
- 12.1.8 Under Armour Inc
- 12.1.8.1. Company Overview
- 12.1.8.2. Products
- 12.1.8.3. Company Financials
- 12.1.8.4. SWOT Analysis
- 12.1.9 Nike Inc
- 12.1.9.1. Company Overview
- 12.1.9.2. Products
- 12.1.9.3. Company Financials
- 12.1.9.4. SWOT Analysis
- 12.1.10 ASICS Corporation*List Not Exhaustive
- 12.1.10.1. Company Overview
- 12.1.10.2. Products
- 12.1.10.3. Company Financials
- 12.1.10.4. SWOT Analysis
- 12.1.1 Adidas AG
- 12.2. Market Entropy
- 12.2.1 Company's Key Areas Served
- 12.2.2 Recent Developments
- 12.3. Company Market Share Analysis 2025
- 12.3.1 Top 5 Companies Market Share Analysis
- 12.3.2 Top 3 Companies Market Share Analysis
- 12.4. List of Potential Customers
- 13. Research Methodology
List of Figures
- Figure 1: Global Licensed Sports Merchandise Market Revenue Breakdown (Million, %) by Region 2025 & 2033
- Figure 2: North America Licensed Sports Merchandise Market Revenue (Million), by Product Type 2025 & 2033
- Figure 3: North America Licensed Sports Merchandise Market Revenue Share (%), by Product Type 2025 & 2033
- Figure 4: North America Licensed Sports Merchandise Market Revenue (Million), by Distribution Channel 2025 & 2033
- Figure 5: North America Licensed Sports Merchandise Market Revenue Share (%), by Distribution Channel 2025 & 2033
- Figure 6: North America Licensed Sports Merchandise Market Revenue (Million), by Country 2025 & 2033
- Figure 7: North America Licensed Sports Merchandise Market Revenue Share (%), by Country 2025 & 2033
- Figure 8: Europe Licensed Sports Merchandise Market Revenue (Million), by Product Type 2025 & 2033
- Figure 9: Europe Licensed Sports Merchandise Market Revenue Share (%), by Product Type 2025 & 2033
- Figure 10: Europe Licensed Sports Merchandise Market Revenue (Million), by Distribution Channel 2025 & 2033
- Figure 11: Europe Licensed Sports Merchandise Market Revenue Share (%), by Distribution Channel 2025 & 2033
- Figure 12: Europe Licensed Sports Merchandise Market Revenue (Million), by Country 2025 & 2033
- Figure 13: Europe Licensed Sports Merchandise Market Revenue Share (%), by Country 2025 & 2033
- Figure 14: Asia Pacific Licensed Sports Merchandise Market Revenue (Million), by Product Type 2025 & 2033
- Figure 15: Asia Pacific Licensed Sports Merchandise Market Revenue Share (%), by Product Type 2025 & 2033
- Figure 16: Asia Pacific Licensed Sports Merchandise Market Revenue (Million), by Distribution Channel 2025 & 2033
- Figure 17: Asia Pacific Licensed Sports Merchandise Market Revenue Share (%), by Distribution Channel 2025 & 2033
- Figure 18: Asia Pacific Licensed Sports Merchandise Market Revenue (Million), by Country 2025 & 2033
- Figure 19: Asia Pacific Licensed Sports Merchandise Market Revenue Share (%), by Country 2025 & 2033
- Figure 20: South America Licensed Sports Merchandise Market Revenue (Million), by Product Type 2025 & 2033
- Figure 21: South America Licensed Sports Merchandise Market Revenue Share (%), by Product Type 2025 & 2033
- Figure 22: South America Licensed Sports Merchandise Market Revenue (Million), by Distribution Channel 2025 & 2033
- Figure 23: South America Licensed Sports Merchandise Market Revenue Share (%), by Distribution Channel 2025 & 2033
- Figure 24: South America Licensed Sports Merchandise Market Revenue (Million), by Country 2025 & 2033
- Figure 25: South America Licensed Sports Merchandise Market Revenue Share (%), by Country 2025 & 2033
- Figure 26: Middle East and Africa Licensed Sports Merchandise Market Revenue (Million), by Product Type 2025 & 2033
- Figure 27: Middle East and Africa Licensed Sports Merchandise Market Revenue Share (%), by Product Type 2025 & 2033
- Figure 28: Middle East and Africa Licensed Sports Merchandise Market Revenue (Million), by Distribution Channel 2025 & 2033
- Figure 29: Middle East and Africa Licensed Sports Merchandise Market Revenue Share (%), by Distribution Channel 2025 & 2033
- Figure 30: Middle East and Africa Licensed Sports Merchandise Market Revenue (Million), by Country 2025 & 2033
- Figure 31: Middle East and Africa Licensed Sports Merchandise Market Revenue Share (%), by Country 2025 & 2033
List of Tables
- Table 1: Global Licensed Sports Merchandise Market Revenue Million Forecast, by Product Type 2020 & 2033
- Table 2: Global Licensed Sports Merchandise Market Revenue Million Forecast, by Distribution Channel 2020 & 2033
- Table 3: Global Licensed Sports Merchandise Market Revenue Million Forecast, by Region 2020 & 2033
- Table 4: Global Licensed Sports Merchandise Market Revenue Million Forecast, by Product Type 2020 & 2033
- Table 5: Global Licensed Sports Merchandise Market Revenue Million Forecast, by Distribution Channel 2020 & 2033
- Table 6: Global Licensed Sports Merchandise Market Revenue Million Forecast, by Country 2020 & 2033
- Table 7: United States Licensed Sports Merchandise Market Revenue (Million) Forecast, by Application 2020 & 2033
- Table 8: Canada Licensed Sports Merchandise Market Revenue (Million) Forecast, by Application 2020 & 2033
- Table 9: Mexico Licensed Sports Merchandise Market Revenue (Million) Forecast, by Application 2020 & 2033
- Table 10: Rest of North America Licensed Sports Merchandise Market Revenue (Million) Forecast, by Application 2020 & 2033
- Table 11: Global Licensed Sports Merchandise Market Revenue Million Forecast, by Product Type 2020 & 2033
- Table 12: Global Licensed Sports Merchandise Market Revenue Million Forecast, by Distribution Channel 2020 & 2033
- Table 13: Global Licensed Sports Merchandise Market Revenue Million Forecast, by Country 2020 & 2033
- Table 14: Spain Licensed Sports Merchandise Market Revenue (Million) Forecast, by Application 2020 & 2033
- Table 15: United Kingdom Licensed Sports Merchandise Market Revenue (Million) Forecast, by Application 2020 & 2033
- Table 16: Germany Licensed Sports Merchandise Market Revenue (Million) Forecast, by Application 2020 & 2033
- Table 17: France Licensed Sports Merchandise Market Revenue (Million) Forecast, by Application 2020 & 2033
- Table 18: Italy Licensed Sports Merchandise Market Revenue (Million) Forecast, by Application 2020 & 2033
- Table 19: Russia Licensed Sports Merchandise Market Revenue (Million) Forecast, by Application 2020 & 2033
- Table 20: Rest of Europe Licensed Sports Merchandise Market Revenue (Million) Forecast, by Application 2020 & 2033
- Table 21: Global Licensed Sports Merchandise Market Revenue Million Forecast, by Product Type 2020 & 2033
- Table 22: Global Licensed Sports Merchandise Market Revenue Million Forecast, by Distribution Channel 2020 & 2033
- Table 23: Global Licensed Sports Merchandise Market Revenue Million Forecast, by Country 2020 & 2033
- Table 24: China Licensed Sports Merchandise Market Revenue (Million) Forecast, by Application 2020 & 2033
- Table 25: Japan Licensed Sports Merchandise Market Revenue (Million) Forecast, by Application 2020 & 2033
- Table 26: India Licensed Sports Merchandise Market Revenue (Million) Forecast, by Application 2020 & 2033
- Table 27: Australia Licensed Sports Merchandise Market Revenue (Million) Forecast, by Application 2020 & 2033
- Table 28: Rest of Asia Pacific Licensed Sports Merchandise Market Revenue (Million) Forecast, by Application 2020 & 2033
- Table 29: Global Licensed Sports Merchandise Market Revenue Million Forecast, by Product Type 2020 & 2033
- Table 30: Global Licensed Sports Merchandise Market Revenue Million Forecast, by Distribution Channel 2020 & 2033
- Table 31: Global Licensed Sports Merchandise Market Revenue Million Forecast, by Country 2020 & 2033
- Table 32: Brazil Licensed Sports Merchandise Market Revenue (Million) Forecast, by Application 2020 & 2033
- Table 33: Argentina Licensed Sports Merchandise Market Revenue (Million) Forecast, by Application 2020 & 2033
- Table 34: Rest of South America Licensed Sports Merchandise Market Revenue (Million) Forecast, by Application 2020 & 2033
- Table 35: Global Licensed Sports Merchandise Market Revenue Million Forecast, by Product Type 2020 & 2033
- Table 36: Global Licensed Sports Merchandise Market Revenue Million Forecast, by Distribution Channel 2020 & 2033
- Table 37: Global Licensed Sports Merchandise Market Revenue Million Forecast, by Country 2020 & 2033
- Table 38: South Africa Licensed Sports Merchandise Market Revenue (Million) Forecast, by Application 2020 & 2033
- Table 39: Saudi Arabia Licensed Sports Merchandise Market Revenue (Million) Forecast, by Application 2020 & 2033
- Table 40: Rest of Middle East and Africa Licensed Sports Merchandise Market Revenue (Million) Forecast, by Application 2020 & 2033
Frequently Asked Questions
1. What is the projected Compound Annual Growth Rate (CAGR) of the Licensed Sports Merchandise Market?
The projected CAGR is approximately 5.27%.
2. Which companies are prominent players in the Licensed Sports Merchandise Market?
Key companies in the market include Adidas AG, G-III Apparel Group Ltd, VF Corporation, DICKS Sporting Goods Inc, Li Ning (China) Sports Goods Co Ltd, Iconix Brand Group, Puma SE, Under Armour Inc, Nike Inc, ASICS Corporation*List Not Exhaustive.
3. What are the main segments of the Licensed Sports Merchandise Market?
The market segments include Product Type, Distribution Channel.
4. Can you provide details about the market size?
The market size is estimated to be USD 35.63 Million as of 2022.
5. What are some drivers contributing to market growth?
Increasing Sports Participation is Boosting the Market Growth; Increasing Innovation and Upgradation in Merchandizing Products.
6. What are the notable trends driving market growth?
Increasing Sport Participation is Expected to Drive the Market Growth.
7. Are there any restraints impacting market growth?
Availability of Counterfeit Sports Merchandise Products.
8. Can you provide examples of recent developments in the market?
September 2023: Adidas launched the X Crazyfast Messi 'Las Estrellas,’ shortly followed by the release of his 'Infinito' boots. Adidas added another signature boot to Messi's catalog, the X Crazyfast Messi 'Las Estrellas,' with a special design that celebrates his 2022 World Cup triumph with Argentina.
9. What pricing options are available for accessing the report?
Pricing options include single-user, multi-user, and enterprise licenses priced at USD 4750, USD 5250, and USD 8750 respectively.
10. Is the market size provided in terms of value or volume?
The market size is provided in terms of value, measured in Million.
11. Are there any specific market keywords associated with the report?
Yes, the market keyword associated with the report is "Licensed Sports Merchandise Market," which aids in identifying and referencing the specific market segment covered.
12. How do I determine which pricing option suits my needs best?
The pricing options vary based on user requirements and access needs. Individual users may opt for single-user licenses, while businesses requiring broader access may choose multi-user or enterprise licenses for cost-effective access to the report.
13. Are there any additional resources or data provided in the Licensed Sports Merchandise Market report?
While the report offers comprehensive insights, it's advisable to review the specific contents or supplementary materials provided to ascertain if additional resources or data are available.
14. How can I stay updated on further developments or reports in the Licensed Sports Merchandise Market?
To stay informed about further developments, trends, and reports in the Licensed Sports Merchandise Market, consider subscribing to industry newsletters, following relevant companies and organizations, or regularly checking reputable industry news sources and publications.
Methodology
Step 1 - Identification of Relevant Samples Size from Population Database


Step 2 - Approaches for Defining Global Market Size (Value, Volume* & Price*)

Note*: In applicable scenarios
Step 3 - Data Sources
Primary Research
- Web Analytics
- Survey Reports
- Research Institute
- Latest Research Reports
- Opinion Leaders
Secondary Research
- Annual Reports
- White Paper
- Latest Press Release
- Industry Association
- Paid Database
- Investor Presentations

Step 4 - Data Triangulation
Involves using different sources of information in order to increase the validity of a study
These sources are likely to be stakeholders in a program - participants, other researchers, program staff, other community members, and so on.
Then we put all data in single framework & apply various statistical tools to find out the dynamic on the market.
During the analysis stage, feedback from the stakeholder groups would be compared to determine areas of agreement as well as areas of divergence